From theory to practice - page 1329
You are missing trading opportunities:
- Free trading apps
- Over 8,000 signals for copying
- Economic news for exploring financial markets
Registration
Log in
You agree to website policy and terms of use
If you do not have an account, please register
The goal of all these studies is to find the time period where there is a stable average entropy that is minimal compared to the SB entropy.
If you believe that the indicator 1.5 (i.e. period = 720 minutes = 12 hours) is the most characteristic for EURUSD and characterizes both price series and returns, then this should be checked for other pairs as well.
If the results coincide, we should stop at this sample and never touch it.
Anything can be adjusted in your TS, just not the calculated time period of the sample.
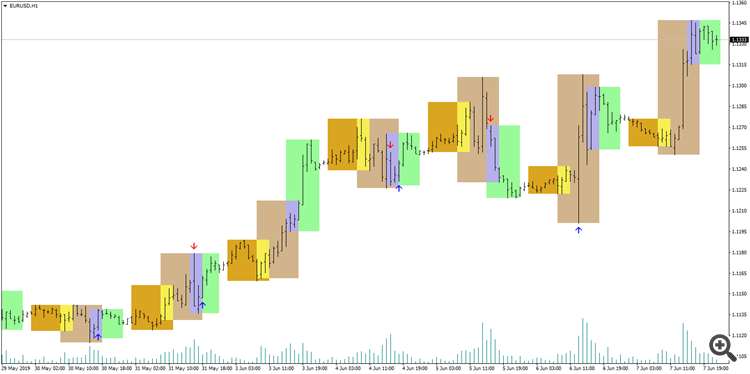
Here are the trading sessions and tick volumes
I don't see any periodicity
https://www.mql5.com/ru/code/7753Rupee dscounted. Pretty stubborn and stable metric.
OK. 1.5 seems to be the right one.
Next up - yourself, Maxim. I think NS is just obliged to find regularities in the calculated sliding window. I find them somehow :)))
I'll send you my TS in 3 months if you like my state. Only - on VisSim, don't mind me :))).
Thanks.
Here are the trading sessions and tick volumes
I don't see any periodicity.
it's not the trading session you should be looking at.
but at the moments of the highest volatility.
because that is where the highest probability of a non-random movement in market noise is.
this is the only time suitable for analysis, all other times are crap.
OK. 1.5 seems to be the right one.
Next, it's up to you, Maxim. I think NS is just obliged to find patterns in the calculated sliding window. I find them somehow :)))
I'll send you my TS in 3 months if you like my state. Only - on VisSim, don't mind me :))).
Thanks.
Yeah, we'll figure it out.
as a side dish, by the way, there was an entropy study by the creator of the MO branch, if you haven't read it yethttps://habr.com/ru/post/127394/
I think the results are exactly the same thereThis is not pure coin. Read Max's research on process entropy carefully.
I've been reading and trading for over 10 years.
it's not the trading sessions you need to watch.
but at the moments of highest volatility.
because that is where there is the highest probability of a non-random movement in market noise.
only that is suitable for analysis, all other times it's crap.
But until the tick volume increases to the necessary level, the signal will be late or you mean the exact time?
By the way, once the ewa went off at night.
and the pound was also the same overnight black swan...
and the chiff, around noon, gave me a thrush.
probably need to correlate the candlestick stroke statistics with the tick volume, and well...
But until the tick volume grows to the required volume, will the signal be too late, or do you have a specific time in mind?
By the way, once, the eva flew out at night.
and the pounder also rolled a black swan at night...
and the chiff, around noon, gave me a thrush.
You should rather compare the statistics of the candlestick stroke with the tick volume...
You don't really need that ... Judging by your pictures your system gives you a thrush anyway...)
You don't really need it ... Judging by your pictures, your system gives you a thrush.)
You mean this one?
---
Copyright © new-rena