From theory to practice - page 538
You are missing trading opportunities:
- Free trading apps
- Over 8,000 signals for copying
- Economic news for exploring financial markets
Registration
Log in
You agree to website policy and terms of use
If you do not have an account, please register
If so, we have one mass.
but we need to divide it into two - m1 and m2
and why do we need a square of height (width) since the channel has a finite "life" time
the current area is most likely more interesting - it is the mass and can serve as a check figure when trying to divide it into two masses
and instead of a regression, I suggest:
I drew it at the end of 16 and kept it, not finding any use for it.
may already be needed
I said 'as an option'.
There can be many approaches to the solution.
Especially "your" area and "my" square of width are essentially proportional values, if you are talking about the cross-sectional area of the canal. (I perceive canals as not flat.)
ZS. It's true that the current width is also counted integrally. So it's the same.If, however, you are talking about the area of the entire channel on the monitor screen, i.e. your "mass" depends on the length of the channel, then I disagree. Because the length of the channel of mass M is determined by the moment when this mass will be captured by a channel of larger mass or by 'collision' with a commensurable mass to combine them and give birth to a new channel with a new mass and a vector of direction. Especially how to calculate the area if the width of the channel is in pips and the length in seconds.
I do not consider the channel as two masses but as one common mass with a common centre of mass. After all, even in our solar system, the mass of the Sun is 99.866% of the total mass of the solar system. Although the centre of mass of the entire solar system sometimes extends beyond the Sun itself.
Of course, not everything is clear-cut here. I am not claiming that the mass of the channel is a constant. It may even increase as the width decreases. So perhaps your integral model is more preferable.
Well sometimes there are explanations for phenomena, for example gravitation, nobody can try it but feel it, Einstein calculated that gravitation distorts the trajectory of light, then proved by experience, so maybe with BingBang, found relic waves, maybe they will find something else))
It is just convenient to think that light has some trajectory (beam), because the source emits a sufficient statistical number of events for physiological interpretation of them as some beam. And the individual receives only a small fraction of all events, and many times over-radiated. There will be no mass, there will be no "light" event. Experiment on a simple picture (in the refraction picture place/replace sources, combine media), so to understand the value of calculations on gravitation and light, if interesting or bored look at the chromatic and polarization dispersion:
Good sample, I mean in terms of volume)
Auxiliary axiom #16 ... then what about Buffett from the forbes pages? Yeah, and half the other half of the axioms have questions.
Well Buffet is a professional, you can not know if he had an insider or bribe?, but it is a story of a survivor, you do not give examples of Buffet's losses, and they are, because he has been in the investment business for a long time, so there were failures.
https://www.mql5.com/ru/forum/221552/page525#comment_8563254
Something is defined in my mind, I do not understand what.
Increase per unit time of unipolar TickQ with value nTickQ = eTrend (elementary trend) greater than some threshold value of StartTrend.
Here. This is already a space with electrodynamic laws. The magnitude of the charge, its polarity. (I=U/R)
but also the possibility of this money supply increasing continuously, (additional controlled periodic emission)
All countries print money in a controlled way. As everyone prints money, the exchange rate does not fall against other currencies.
There is no progressive movement in the price - the price is controlled by central banks according to their pricing policy so it is naive to look for logic and economic expediency in it.
And the universe has nothing to do with it and it is known that there is no cosmos, and that science knows nothing about the universe.
it could be a "floating rate within a corridor", it could be "pegged to the dollar", it could be something else...
Pseudo-mathematicality of price movement in the forex market these days is caused by the fact that the crowd is using oscillators on their terminals, particularly Stochastic. And they move from side to side, each on a selected timeframe. And they throw their money from timeframe to timeframe. Here's a pseudo-Brown movement for you. Increase/decrease in the number of trades is like a temperature. The number of deals and lots increases on average - heating up, decreasing - cooling down. Volatility (amplitude) - microfluctuations in one or another direction on a microframe are summed up or subtracted and they start to participate in huge fluctuations with a chaotic picture on different timeframes.
then there are the institutionalists:
central banks, commercial banks, investment banks, brokers and dealers, pension funds, insurance companies, multinationals, etc.
Maybe some of them are involved in speculation.
No problem, that's why we're human, we all believe in something.
what's the problem (or my interest) here in general, once again I'll refer to the videohttps://www.mql5.com/ru/forum/221552/page525#comment_8564120
What's interesting about the presenter? - At the end of the video, he says that human beings are inherently objects of living nature and it is not inherent to them to live in the existing world - end of the video
if to think about it, all our science is a set of rules that we have made and we follow these rules. of course, technical progress shows that science "rules", but there is a "double-edged sword" - if science "rules" then it knows everything, but science cannot explain how other species (animals) explain the world without it - but they live and I think without problems
i.e. what I'm getting at:
- there's mathematics, there's the decimal system, there's arithmetic - well, hooray for that... But historically, for example, complex mathematics could be formed and we would answer the question "12 integers and 20 imaginary parts of day" .....
- nature doesn't have a mathematical basis, because it doesn't have these rules that people have made, but people are trying to describe everything around them with these rules.
- And to the topic to which I paid attention to your message, what you are trying to call the space-time continuum, well, this is the theory described by modern science, i.e. the environment which we have not seen and we are trying to describe by mathematical methods which describe only the conventions of modern science.
So the bottom line is that this is a theory described by the conventions of mathematics and not supported by anything.
Many people live ina "comfort zone" and are afraid to get out of it. Some just don't want to do it.
No, they don't.
It's just that to get out of your comfort zone, you have to be in it first. And we don't have the money.
and in general it's a survivor's story, you don't give examples of Buffett's losses, and there are, because he's been investing for a long time, which means there have been failures
Exactly.
Everyone cites Buffett's story of what he did to get rich.
But it doesn't say anything about those who did the same thing - and not only didn't become rich, but lost what they had.
This is what the basic task of AI is for - image recognition.
For example, my system recognizes such an image:
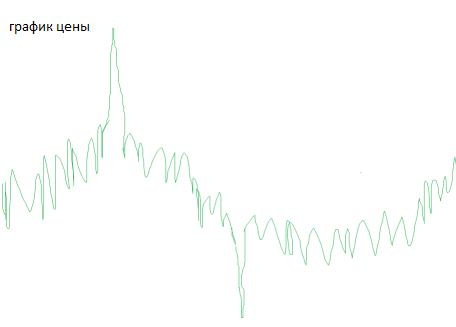
What do I do with the outliers? Smooth them out with some kind of filter?
Well, my system recognizes such an image from the chart, for example:
What should I do with the spikes? Smooth them out with a filter?
ISC will not notice the outliers.
Take all H-peaks (together with outliers), interpolate by the third power (either with my class or with ALGLIB), and get the upper bound. Exactly as on your plot. If you take all L-peaks (also with spikes), you get the lower bound, like yours.
Personally, I simply took Close prices, interpolated the midline, and then found deviations from the midline, and drew the boundaries (with the same curve as the midline, only shifted). If you take all the deviations, the boundaries will go through the peaks of the outliers. If you take only 90% of the outliers, the peaks will be eliminated.
ISC will not notice the outliers.
Take all H-peaks (together with outliers), interpolate by the third power (either with my class or with ALGLIB), and get the upper bound. Exactly as on your plot. Take all L-peaks (also with spikes) - you get the lower bound, as you have.
Personally, I just took Close prices, interpolated the average line, and then found deviations from the average, and drew the boundaries (with the same curve as the average, only shifted). If you take all the deviations, the boundaries will go through the peaks of the outliers. If you take only 90% of the outliers, the peaks will be eliminated.
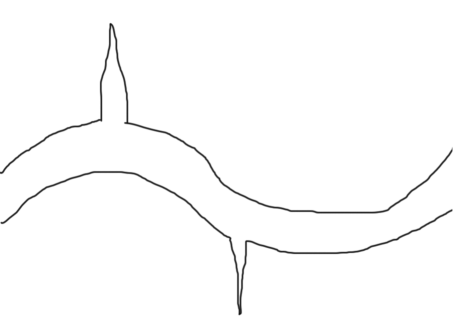
If we apply polynomials to them, we will also need to know the degree of the polynomial.
My picture has 2 bends, so a polynomial of degree 2 will not work there.
I'll have to do some research on filters...