Sultonov differential indicator
Dear programmers! I propose to create the specified non re-drawing, non-periodic, TF-independent and non-delayed indicator, which principle is clear from the table and drawings. The indicator may be started both right after the terminal start-up and using historical data, from which its readings will not change. I will answer all questions concerning the construction of the indicator. I would be grateful if you discover that such an indicator has been already developed and is available on the Internet.
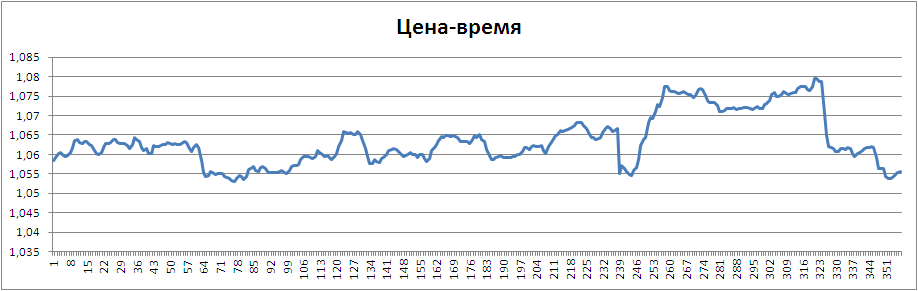
The time is delayed here in hours.
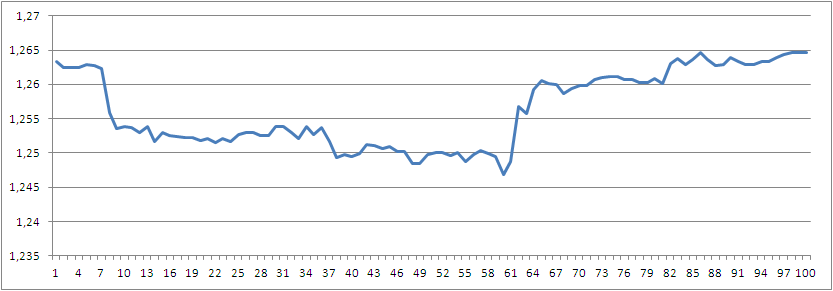
I wish I could align the charts by phase, but probably you will understand that they are in real time coincide. You can see that, the indicator is even slightly ahead of the price and probably has a predictive ability. We will check it as soon as we create the indicator in the code. Perhaps, in the future, we will be able to mark time on the abscissa axis. Here is the indicator in its initial form, where the y-axis shows the price and the abscissa axis shows the sum of absolute increments (differentials) of the price every hour (you can use any time, even after every tick of the price):
To decide whether it's worth the trouble, what's missing is the most important thing. How to use it? What can be extracted from the readings of this creation.
If I understand correctly, this 'bike' is called a 'renko'.
If I understand correctly, this 'bike' is called a 'renko'.
Or something like that. No well progress )
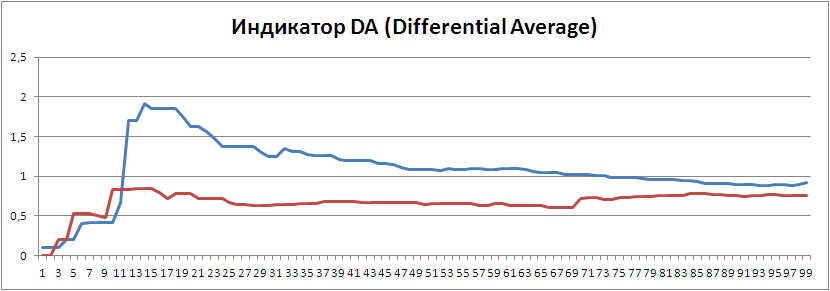
Then, I will present this indicator in the following form:
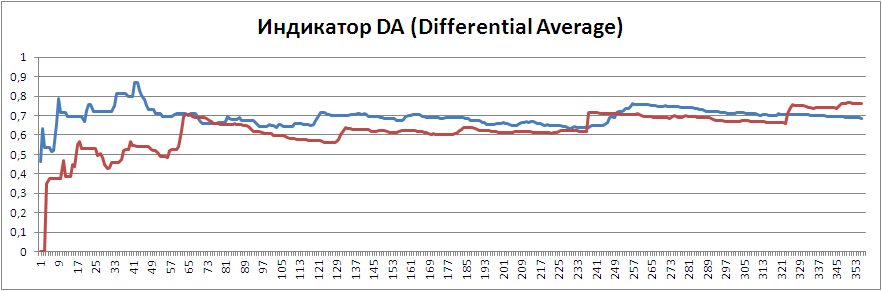
The indicator is based on the intersection of two DAs:
1. When the blue DA is higher than the red one - buy;
2. When the blue DA is below the red one - sell;
3. DA alignment - out of the market;
4. Crossing of DA - closing of positions.
On the abscissa axis - the bars of the selected timeframe, on the ordinate axis - indicator readings. The indicator, by definition, does not re-draw, is stable, does not lag, has no period, but, if desired, it is possible to set the same periods for both DA, it works immediately after plugging or using historical data, if such a condition is set in the settings, it does not depend on TF.
can be superimposed on the graph?
can be superimposed on the graph?
Now, let's move on to testing the indicator on historical data. Let's start with the H1 TF, set the period of both DA's equal to 100 and take 100 values of bar opening prices from 1-00 of 13.07.2006 till 4-00 of 19.07.2006, inclusive:
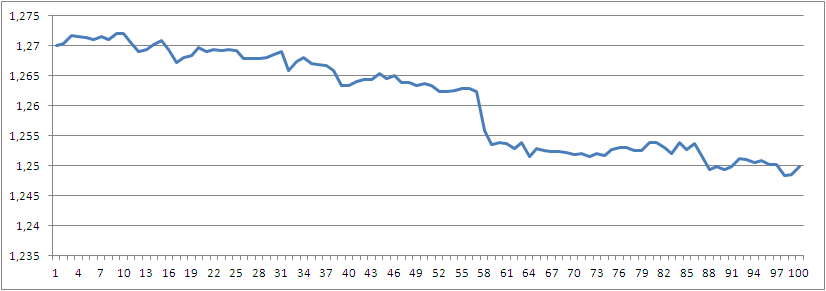
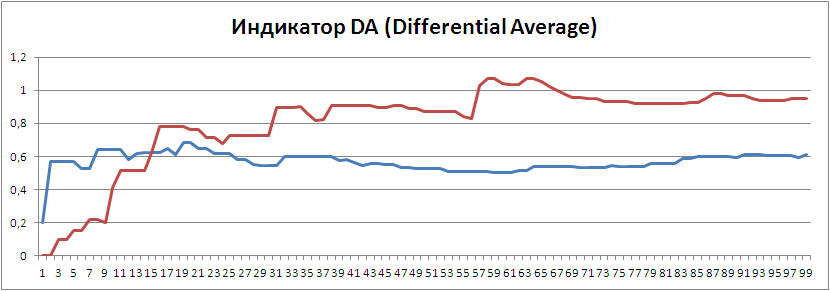
The triumph of the indicator is obvious.
Now, we take data from 4-00 on 19.07.2006 till 8-00 on 25.07.2006. (100 values of opening prices H1):

I think comments are unnecessary.
Now, let's move on to testing the indicator on historical data. Let's start with the H1 TF, set the period of both DA's equal to 100 and take 100 values of bar opening prices from 1-00 on 13.07.2013 till 4-00 on 19.07.2013, inclusive:
The triumph of the indicator is obvious.
with respect.
If you build the indicator on the time frame where the price goes down and then follows it up, the trough should be located approximately in the middle of the date frame.
with respect.
Then, I will take from the 50th point of the first graph to the 50th point of the second graph, i.e. from 2-00 on 17.07.2006 to 6-00 on 21. 07. 2006г. 100 price values:
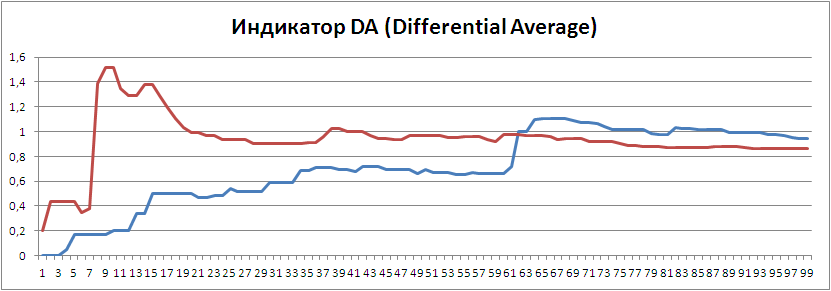
I think the indicator has succeeded in its task.
GENTLEMEN PROGRAMMERS, TRADERS AND INVESTORS! THE SECRET OF THE FOREX MARKET HAS BEEN FINALLY SOLVED BY THE POWER OF HUMAN MIND. LONG LIVE MY TEACHERS - NISSON ILYICH GELPERIN, VICTOR GRIGORIEVICH AINSTEIN, YURY VASILYEVICH NESTEROV! ETERNAL MEMORY TO THEM!
- Free trading apps
- Over 8,000 signals for copying
- Economic news for exploring financial markets
You agree to website policy and terms of use
Dear programmers! I propose to create the specified non re-drawing, non-periodic, TF-independent and non-delayed indicator, which principle is clear from the table and pictures above. The indicator may be started both right after the terminal start-up and using historical data, from which its readings will not change. I will answer all questions concerning the construction of the indicator. I would be grateful if you discover that such an indicator has been already developed and is available on the Internet.
The time is delayed here in hours.
I wish I could align the charts by phase, but probably you will understand that they are in real time coincide. You can see that, the indicator is even slightly ahead of the price and probably has a predictive ability. We will check it as soon as we create the indicator in the code. Perhaps, in the future, we will be able to mark time on the abscissa axis. Here is the indicator in its initial form, where the y-axis shows the price and the abscissa axis shows the sum of absolute increments (differentials) of the price in every hour (you can do it in any time, even in every tick of the price):