Dependency statistics in quotes (information theory, correlation and other feature selection methods)
Bravo, Alexey, I didn't expect you to be the one to surprise your namesake (forgive me for God's sake, but I still have an idea of the average level of maturity on our forum).
Glad you're going about the same way I did, down to mutual information I() and rough estimation in hundredths of a bit. True, I did not use Kolmogorov-Smirnov test. And I took not days, but hours (there is more data and conclusions are more reliable). И... I discretized the increments in a slightly different way.
It's really a bit steep for a hubr, I guess. They are just IT people, though very smart :) (Look at Cher's comment which got rating +3, i.e. maximum).
I have a couple of questions for you - I'll write in person a little later. And here for now I will observe: suddenly someone else knowledgeable will come up...
Alexey, thank you... Glad you appreciated it, in fact, I was finally fired up with the idea after reading the summary of your research results.
Some specifics of the research could be changed, of course. I myself have long thought how to better discretize values, and stopped at such a simple way as rounding.
And I've already done the analysis for EURUSD H1 as well. Took a quote from Alpari for 10 years (64500 bars). Here it is:
")
And with arrows I marked weekly lags: they somehow stand out, in my opinion.
And this is what the autocorrelation function looks like on this series:
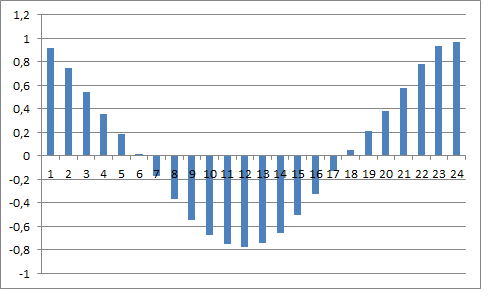
All in all, you can see a strict 24-hour cyclicality. This too can be discussed.
By the way, I rounded up the increments here too, to 10 points (because of this the entropy of the data turned out to be about 2.5 Bits). Also, I couldn't plough through more variables, say in the case of diving into a year's worth of history. Excel hangs the computer up tight, gobbling up 4GB of RAM. Couldn't physically do it, although the thought was certainly there.
By the way, chi-square gives approximately the same picture: with increasing lag we observe a decent spike of criterion's value in every 24 bars.
P.S. I would like to emphasize that ACF here is not calculated by a number of returns, but by the averaged information flow, delivered by past quotes to the zero bar. If we take a specific zero bar for calculations, the information flow to it will be calculated differently.
It can be concluded that in natural finance data (at least for the DJI index) there are statistically significant arbitrary relationships between the increments of quotes. That is, such a series of data cannot be considered random. Theoretically, there is space for predicting future values of such a series, e.g. using neural networks.
The fact that a relationship has been found can be explained by the well-known fact that volatility is dependent on previous values. You can even see it with the naked eye by your graph of increments. There are theoretical models that describe the dependence of volatility - like ARCH/GARCH.
That is why the cycles of 24 hours are formed within a day - the ox on the forex market has a stationary cyclic behavior:
It simply has to do with the opening and closing times of different financial centres. The trading activity changes. If you use a coin as a data source))), then it starts to be tossed more often, then less often at the same time.
Plus there is a weekly vol cycle, but it is less pronounced than for the stock markets. Just a lag of 5 in daily increments ;)
So it is not an argument to predict the direction of quote changes (which is what we are interested in). The comparison should be with a random series generated from real volatility (e.g. tick volume). I.e. dependence of dispersion in the distribution during generation. Otherwise a lot of statistical tests determine exactly the dependence of volatility, not the variance of the increments
In general, a strict 24-hour cycle is visible. This too can be discussed.
Otherwise a lot of statistical tests determine exactly the dependence of volatility, rather than the corrections of increments
And this is correct. I came right down to it myself, I just didn't post all my thoughts here.
By the way, chi-square gives approximately the same picture: with increasing lag somewhere every 24 bars there is a decent spike of criterion value.
P.S. I would like to emphasize that ACF here is not calculated by a number of returns, but by the averaged information flow, delivered by past quotes to the zero bar. If we take a specific zero bar for calculations, the information flow to it will be calculated differently.
Yes, the histogram is calculated by the values of mutual information and I just put it out to confirm the idea of cyclicity.
What's there to discuss? It has long been a known fact, intraday cyclicality. It has even been pointed out by people who do not understand mathematics at all, but who do understand the market. Moreover, there is cyclicality even within the trading sessions of specific trading floors. It does not come close to the understanding of what should be done, per se. A little edge can be extracted from it, though.
I understand it. We should take the timeframe of a day or more.
I don't get where this cyclical beauty is coming from?
Here is the result for the last 100 days.
Initial chart:
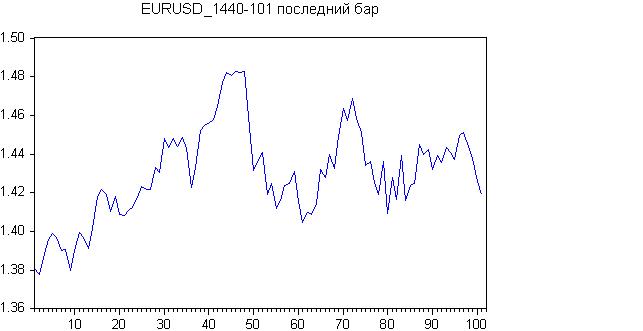
There seems to be a trend at the start, or a sideways trend altogether. Let's check it out with the Roast-Beer.
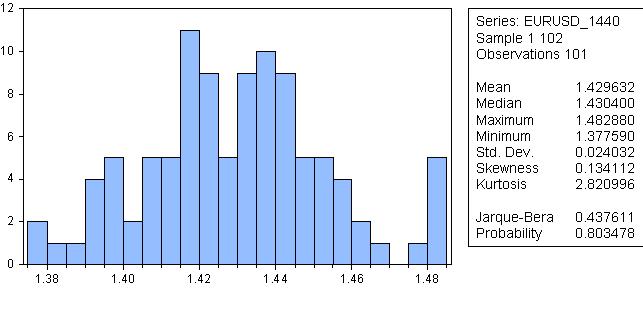
It sounds ridiculous, but the probability that the distribution is normal is 80%!
Let's look at the autocorrelation:
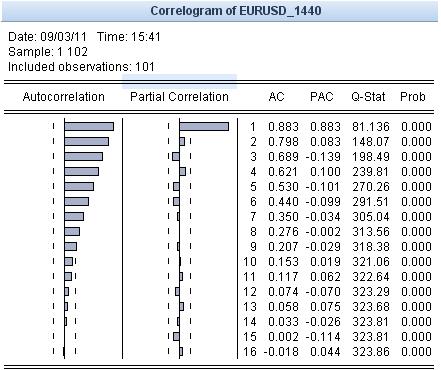
Where is the cyclicality? I don't see it, but I see the trend. As long as there is a trend, all statistical reasoning is irrelevant. Let's do a Hodrick-Prescott smoothing. Result:
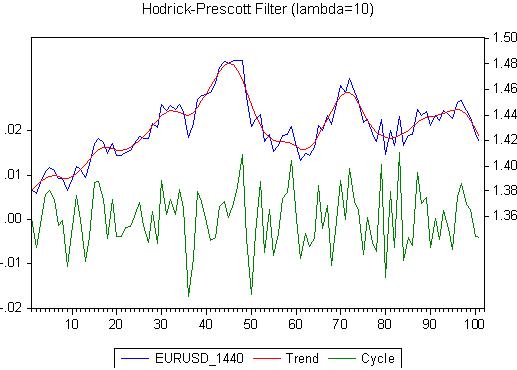
Please note the anti-theoretical lambda. Now let's look at the residual, which is called Cycle here:
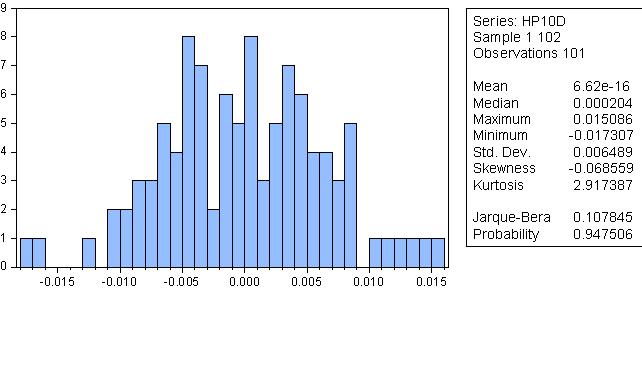
The residual from HP smoothing is, well, quite normal!

There are no trends. Maybe there is cyclicality (3 - 13,14), but this requires more serious evidence.
- Free trading apps
- Over 8,000 signals for copying
- Economic news for exploring financial markets
You agree to website policy and terms of use
Good afternoon!
I decided to slightly develop the topic touched upon by Alexey (Mathemat) in one of the forum threads.
I tried to search for dependencies in the quotes of one financial instrument using statistical methods. To begin with, I took the Dow Jones Industrial index, daily data, and transformed a series of series into the series of percentage increments.
The article is actually here: http: //habrahabr.ru/blogs/data_mining/127394/
I would like to continue for FX quotes, I will post the results here.