Machine learning in trading: theory, models, practice and algo-trading - page 2476
You are missing trading opportunities:
- Free trading apps
- Over 8,000 signals for copying
- Economic news for exploring financial markets
Registration
Log in
You agree to website policy and terms of use
If you do not have an account, please register
it's about the same developer's responsibility - I don't believe and see no reason to put any financial models from books/blogs/articles (and statistically processed distributions) into financial analysis when approximating/interpolating chaos... to further extrapolate the output
That's the basis, you see the thing, people created these formulas and models without reference to the problem, they tried to make something universal, while naively thinking that it applies to everything. For some reason everybody likes to throw around the words Laplace, Fourier, Taylor, Normal Distribution, and think that if they sew it all into a system, it's bound to work for some reason. I was good at it, I used to derive Tsiolkovsky's formula on my knee and nobody could understand how I did it... I had this experience, I was I tried to predict the next candlestick using the system of linear equations and made huge matrices, and the determinants and other stuff, and I thought it was so cool, no one had it, but after testing it turned out to be complete crap, i thought it was so cool and no one else had it, but when i tested it it turned out to be complete bullshit. although according to my estimations i should have become the market guru in the next moment, it was probably 5 years ago, i was just finishing university ( by the way i knew math and physics very well ), i mean knowing great formulas and theorems it does not make us stronger than the average trader, and if it comes to the practical side even weaker in the end... The right way is to do the opposite. You have to ask yourself first what are we counting on, answer first in simple human language and then turn it all into some mathematical criteria. Now I know that for this you do not need to think about the original model and how to build it, and you need to go from end to end, if the model produces the right indicators then after that you can try to understand it, but all in the end it comes down to the AI, and the more intelligent the system will be the more it will annoy the mathematics, I have overcome this barrier and in my work I try as much as possible to delegate the machine.
found your answer earlier... I may have rushed the previous post... probably really should at least start from a parabola as a function describing motion with velocity and acceleration... (even once somewhere I saw a study on this type of charts and the Greeks (delta and gamma) of options - I can't remember and I can't find it - and there's no need - we need a time analysis - horizontal, not vertical)
I just gave Parabola as an example of how an infinite number of data can be compressed into a finite number, there are an infinite number of points on the chart, and you can reduce it to a formula with only 3 coefficients. And if it's your idea I understand what you're thinking, you can take any function like:
A[1]*X^0 + A[2]*X^1+ ... + A [N]*X^N, it is in the general case a Taylor series (functional series), except that A[i] > 0 for all i = 1...N it gives in the general case a constant increase in the first derivative, to put it clearly, so:
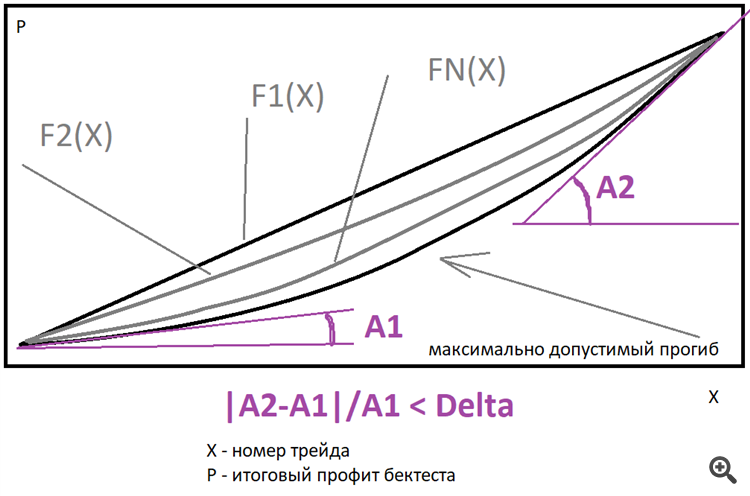
Ideally a straight line is the best option, but you can use a family of power functions just like the one I described above to estimate the deviations. You only need to specify how many times the final derivative can be greater than the starting derivative. It is possible to approximate final graph near such family, find the best function and look for deviation of real graph relative to this function. I use straight line only, though maybe I will extend functionality later, it will give order of magnitude efficiency gain and as consequence may decrease need for computing power if approached wisely.
Evgeniy Ilin #:
reduce the need for computing power with the right approach.
Get some library on numerical methods and there will be a gain in power, maybe even on gpu
Get some library on numerical methods and there will be an increase in power, perhaps even on the gpu
The idea is not bad, but as far as I know for vidyuha need to write code in a very strange way, as everything works a little differently, ready-made library is unlikely to work, most likely you will have to write yourself. By the way, maybe I'll get around to it someday.
In general, as always, all differentiation comes down to MNC... and the whole prediction of the future to the target function, which should be derived by this MNC... thanks for the pictures...
I'll think how to evaluate demand-supply for now (actual liquidity is more important for me than undiscovered regularities, which I'm not ready to give to my machine for statistical probability)...
but I will remember about the developer's responsibility to choose the features that are important for him... And then according to the template: normalize inputs, calculate probabilities, probably cluster (if there is a lot of data), build a gradient, find all the troughs (using OLS) , normalize all the troughs and combine them into a general function... like I said "till blue in the face"... but faster by machine...
Ideally a straight line is best, but you can use a family of power functions just like the one I described above to estimate outliers. You only need to specify how many times the final derivative can be greater than the starting derivative.
Does the family of power functions turn into a log-normal distribution Or does it reflect it?... sorry if the question is silly
question removed, the answer is probably no
In fact, I don't really understand much. Let me put it this way:
1) What is the target function and why do you need it?
2) Why do you need lognormal distribution and why do you think you need it at all?
3) I don't quite understand how a "family" of functions can turn into one prototypical function, even a lognormal distribution.
4) The lognormal distribution of what? What is the random variable in your distribution?
5 ) What is MNC?
Try to ask the question in simple language and get a simple answer ) sorry if anything )
In fact, I don't really understand much of it. Let me put it this way:
1) What is the target function and why do you need it?
2) Why do you need lognormal distribution and why do you think you need it at all?
3) I don't quite understand how a "family" of functions can turn into one prototypical function, even a lognormal distribution.
4) The lognormal distribution of what? What is the random variable in your distribution?
5 ) What is MNC?
Try to ask a question in simple language and get a simple answer ) sorry if anything )
1) output is a function for prediction (in this context, not for neural network levels)
2) because there is asymmetry (introduced by %rate*time and the buyers sellers themselves)
3) ... because they are the same type - why should the prototype be different?...come on, I see that the power distribution is an indicator of inverse dependence
4) price is a random variable
5) method of least squares
the question was originally (in my mind) "to determine the cumulative Debit-Credit imbalance" (also sorry for the expression) in Range (and on the time interval) -- you have to count here without learning yet... But thanks for the reminder about the mathematical modeling - I'm not a physicist, I'm an ecologist - it's easier for us (without functions and mathematical modeling, but with distributions, facts and probabilities; we don't predict the ecosystem, although it must be good to assess risks sometimes; we didn't dig deeply into theory) ; it was just interesting what we could do with these probabilities later (with profit)
In fact, I don't really understand much. Let me put it this way:
1) What is the target function and why do you need it?
2) Why do you need lognormal distribution and why do you think you need it at all?
3) I don't quite understand how a "family" of functions can turn into one prototypical function, even a lognormal distribution.
4) The lognormal distribution of what? What is the random variable in your distribution?
5 ) What is MNC?
Try asking the question in simple language and get a simple answer ) sorry if anything )
1) the target or fitness function is a quantitative measure of the performance of your algorithm
If you train e.g. regression, the target function is a function/formula used to calculate an error for the algorithm, it is the same with genetic algorithm or any other algorithm that minimizes/maximizes almost any MO algorithm.
https://ru.wikipedia.org/wiki/%D0%A6%D0%B5%D0%BB%D0%B5%D0%B2%D0%B0%D1%8F_%D1%84%D1%83%D0%BD%D0%BA%D1%86%D0%B8%D1%8F
5) least squares method
- I understood - to optimize any TS on any indices (by training for any period according to the developer's choice)... - To get conditions to enter with min error in your own inductor...
(although these are different probabilities than the ones I was thinking about as an ecologist, assessing the environment and conditions)