Machine learning in trading: theory, models, practice and algo-trading - page 2182
You are missing trading opportunities:
- Free trading apps
- Over 8,000 signals for copying
- Economic news for exploring financial markets
Registration
Log in
You agree to website policy and terms of use
If you do not have an account, please register
simply added or subtracted a number from all the features in the dataset, depending on the label. The model has become an even deeper test of the history
That's something you have to sleep with. Some primitive stuff, it would seem. It's like 10 five-digit points here, just separated the classes away from each other, it turns out. I don't know how to do it better, because the signs have a different spread of values. I guess a different number makes sense for each column. Or maybe not.
I'll visualize it later.
Oh, right.
was
became .
The main thing is not to overdo it.
I got such a picture: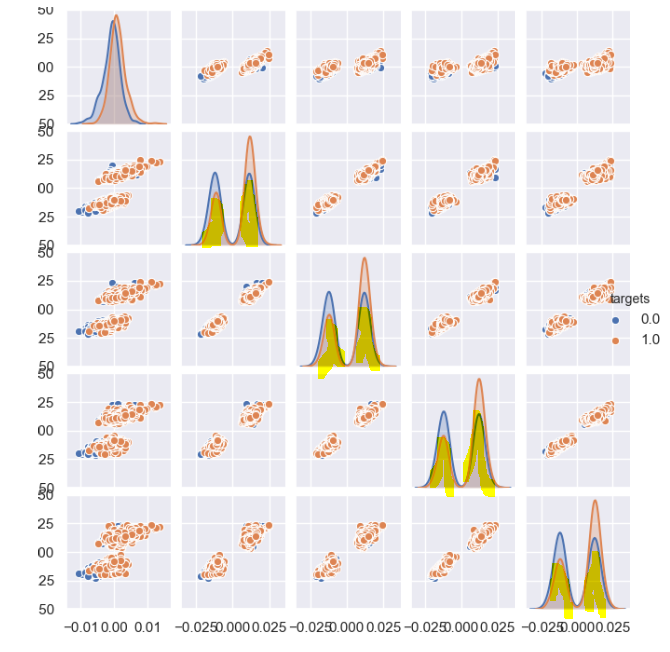
Then I dropped the distributions in the original dataframe that are not in their places (in yellow in the picture above)
resulted in the following
I put everything into a random forest and ran it in the tester
Train from 06.20 to 08.20. Not too much, but not too much.
What an interesting idea! Using your method I tried to use the MA incremental sign to split the distribution of chips
I got such a picture:
Then I dropped the distributions in the original dataframe that are not in their places (in yellow in the picture above)
resulted in this
I put everything into a random forest and ran it in the tester
Train from 06.20 to 08.20. not so rich, but not a minus.
i know it ' s not so bad, but it's not a minus.
Yesterday Maximka posted a ready-made grail on these pictures and put the bot on the signal. why do not you take
I am looking for my own, do not interfere, please.
Interesting idea! Your method I tried using the MA incremental sign to split the distributions of the features
I got such a picture:
Then I dropped the distributions in the original dataframe that are not in their places (in yellow in the picture above)
resulted in this
I put everything into a random forest and ran it in the tester
Train from 06.20 to 08.20. Not much, but not a minus.
There was one such magician here. He recorded videos with similar transformations. He moved clusters, did other geometric transformations. I don't know what he wanted to say, but they say he is a happy owner of Grail...
I've seen some references to the Trickster in this thread. 2182 pages... with its heroes, passions, traditions, grail, ups and downs. Yes, it's already a fantasy world of its own))))
There was one such magician here. He recorded videos with similar transformations. He moved clusters, did other geometric transformations. I don't know what he wanted to say, but they say he is a happy owner of Grail...
Yep, was, was and was gone... maybe even in two ways ))
Describe the rules for shifting something with something and into genetics .... shove - teach - see result ... shove - teach - see result
============================
If there is a ready way to build such channels in R-ka or Python
S-ka how not to adore this R, it has everything...
Yeah, he was, he was, and he was gone... maybe even in two senses ))
Describe the rules for shifting something with something and into genetics .... shove - teach - see result ... shove - teach - see result
============================
if there is a ready way to build such channels in r-ka or python
Can't you calculate the regression line in p?
Yes, I do, I just always look for a ready-made one with a minimum of code
I've never done anything like this before.
Just think how easily and elegantly a channel can be built, you don't have to mark any extremums and put a channel on top of them, etc..
I'm thinking, instead of increments, SZ and balances, etc... why not make AMO draw channels.
The pluses:
1) the forecast is stationary in the sense that it does not change and does not recalculate at each candlestick
2) the forecast takes into account volatility and volatility of the market
3) the forecast is very clear and easy to interpret... up sold, down bought... + accurate entries
4) very easy to program
5) it is possible to scale one model on different TFs
I'm thinking, instead of increments, SZ and balances, etc... why not make AMO draw channels.
The pluses:
1) the forecast is stationary in the sense that it does not change and does not recalculate at each candlestick
2) the forecast takes into account volatility and volatility of the market
3) the forecast is very clear and easy to interpret... up sold, down bought... + accurate entries
4) very easy to program
You're thinking correctly - I already use it :)
The question is what points to use to build a channel, and what information to take for predictors.