Machine learning in trading: theory, models, practice and algo-trading - page 146
You are missing trading opportunities:
- Free trading apps
- Over 8,000 signals for copying
- Economic news for exploring financial markets
Registration
Log in
You agree to website policy and terms of use
If you do not have an account, please register
I'm not a forex trader, I'm not even familiar with Metatrader :)
I would like to experiment with the profile in its different types in the R-ka, I just do not understand how to make a distribution of two vectors
I would like to experiment with different variants of profile, I just don't understand the distribution with two vectors, it's not necessary the volumes, it's just a start, you can put to the profile anything you like but it should be related to the price and that means two vectors
Then what are you doing in this forum? A forum that is devoted entirely to the MetaTrader terminal? You've already said before that there will be no direct access (API) to the MetaTrader ecosystem from the outside.
Read the title of this thread and tell me how Metatrader figures here?
And what is the point of this discussion?
Read the title of this thread and tell me how Metatrader figures here?
And what is the point of this discussion?
New mathematical libraries appeared in the terminal's delivery, such as these:(Discussing the article "Statistical Distributions in MQL5 - Using the Best of R") - so why not publish examples for MetaTrader?
Because I'm not very good at it :) I'm not familiar with MQL
Even I (who's not a programmer) understand that there's nothing you can do with built-in functions, you have to write everything yourself... What you translated a dozen of statistical functions from R is certainly good and even commendable, but this is not even a drop in the ocean compared to the capabilitiesof R, it is constantly evolving, new libraries appear every day, not functions but libraries, how can you keep up with this?
Because I'm not very good at it :) I'm not familiar with MQL
Even I (who's not a programmer) understand that no built-in functions are enough here, you have to write everything yourself... The fact that you translated a dozen statistical functions from R is certainly good and even commendable, but understand that this is not even a drop in the ocean compared to the capabilities of R, it is constantly evolving, every day there are new libraries, not functions but libraries, how can you keep up with this?
You don't know MQL language, you don't know terminal, how can you judge about something in general?
PS. It's a pity, but there are so many users on this forum who are parasitizing on MT ecosystem. But it also shows the great popularity and sophistication of the platform, which attracts the smartest people to research in MQL, and, of course, attracts parasites, how could it be without them...
Let's stop talking about nothing, everyone has his own opinion, and this thread has a specific topic...
So what's up with that distribution? can it be built by two vectors or not? :)
So what's up with that distribution? Can it be plotted using two vectors or not? :)
Here's a good article:https://www.r-bloggers.com/5-ways-to-do-2d-histograms-in-r/
Here is a more vivid example. In the archive - RData with eurusd h1 from 2012 to today.
MetaQotes-Demo provides both tick volumes and trading volumes, but I don't know how much I can trust them.
Thank you! I got a similar thing in my trailer...
I just don't know how to interpret thish2$counts matrix, there's so much stuff there, it's creepy...
I would like to get something similar to a normal distribution, like withhist() remember? It would be similar to the volume profile, or, better yet, one-to-one, is it possible to do it with R-ki tools?
I've got something at https://futures.io/matlab-r-project-python/29465-r-volume-profile-volume-price.html, I'll look into it
I would like to get something similar to a normal distribution, like withhist() remember? It would be similar to volume profile, and better it would be exactly the same, is it possible to do it with P-key tools?
If you take only one vector, the price, the histogram will show the number of repetitions of each price level. There will be bars growing out of the line, to put it simply.
If we take two vectors - price and volume, then price will have its own levels, and volume will have its own levels. These are two different dimensions that form a plane. From the plane, histogram bars will grow up, showing the number of repeats for each combination of price and volume.
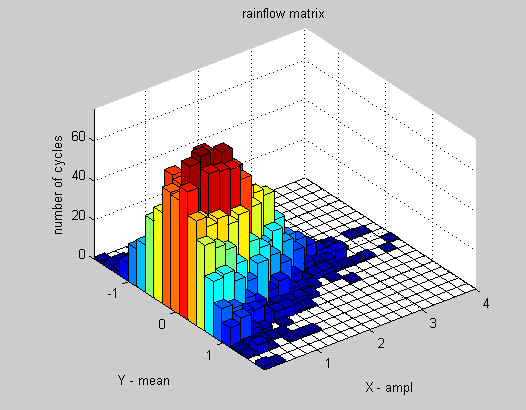
hist2d shows the height of the bars in color instead of drawing three-dimensional bars. A nicer version on the same data would look something like this:
To draw a simple histogram as in hist() for price and volume, you must first bring two vectors (price and volume) to a single vector by some formula and draw a histogram for it. You must decide what kind of new vector this is, what you want from it, and where to get it. Roughly speaking, you want to get a flat histogram from that three-dimensional picture above, which can be done in an infinite number of ways.
The h2$counts is the matrix representation of that histogram. Take nbins=5 for example to make the histogram 5x5 for clarity and look at h2$counts - that too will be a 5x5 matrix. The brighter the histogram cell, the higher the number will be in the matrix in the corresponding cell.
Finished this later.
Found a way to make it look nice.