How to use market statistics histogram
read this thread (and the theory as a Word file inside zip archive on the first post of the thread) -
Market Statistics (Volume Histogram, VWAP with SD bands)The article - The Price Histogram (Market Profile) and its implementation in MQL5".
and look at this page (for video and more) - Indicators: MarketProfile
Forum on trading, automated trading systems and testing trading strategies
Sergey Golubev, 2018.04.04 13:34
MarketProfile - indicator for MetaTrader 5
Market Profile is a tool widely used by futures traders.
Market Profile MetaTrader is a standard solution of the Market Profile that displays the statistical time distribution of the price, price area and control value for the day trading session. The indicator is based on the simple price movement and does not use standard MetaTrader 5 platform indicators.
ore information on the Market Profile can be found in:
- Erik L. Nayman, Master Trading. The Secret Materials (in Russian)
- Erik L. Nayman, A Way to Financial Freedom. Professional Approach to Trading and Investments (in Russian)
- J. Piper, The Way to Trade.
See also the article "The Price Histogram (Market Profile) and its implementation in MQL5".
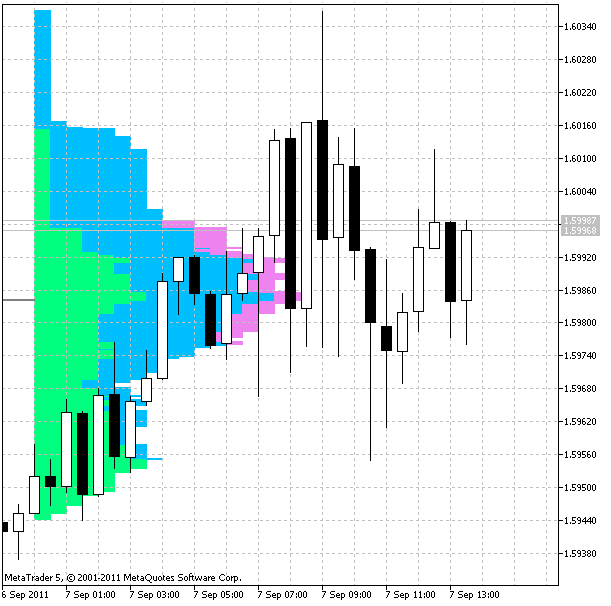
The author implemented different colors for the indicator: green is for the Asian session, blue is for the European one, while violet is for the American session. Working periods are M30 and M15.
..and more and more (a lot of everything on the forum and CodeBase).
For example, look at this post #4432 with market_statistics_jurik indicator attached.
Market Profile
The forum
- Market Statistics (Volume Histogram, VWAP with SD bands) - the thread
- Kevin 'Huddy' Hudson - The Basics of Market Profile - edicational video: post #16
- How to use market statistics histogram - the thread
- market_statistics_jurik indicator (for MT4) - post #281
- Forex Market Profile - the thread
The articles
- The Price Histogram (Market Profile) and its implementation in MQL5 - MT5
- Market Profile indicator - MT5
CodeBase
- MarketProfile - indicator for MetaTrader 5
- more here - search results link
Blog

- 2025.07.14
- www.mql5.com
Forum on trading, automated trading systems and testing trading strategies
Sergey Golubev, 2025.07.15 04:41

Forum on trading, automated trading systems and testing trading strategies
Sergey Golubev, 2025.07.30 03:53
Market Profile indicator (Part 2): Optimization and rendering on canvas
: Optimization and rendering on canvas")
In the previous article, we delved into the Market Profile indicator. As it turns out, constructing a market profile diagram using ordinary graphical objects consumes quite a lot of resources. Each price point from Low to High of the daily bar is filled with rectangle graphical objects in the number of bars that reached this price level throughout the day. This is true for each item - they all contain many graphical objects, and all these objects are created and drawn for each day where the profile diagram is drawn. When an indicator creates thousands of graphical objects, this may cause significant slowdowns when handling other graphical objects and redrawing the chart.
- Free trading apps
- Over 8,000 signals for copying
- Economic news for exploring financial markets
You agree to website policy and terms of use
Dear trader
Is there any theory for market statistics histogram. I don't know what is it
Sincerely,