Harmonic Analysis - page 204

You are missing trading opportunities:
- Free trading apps
- Over 8,000 signals for copying
- Economic news for exploring financial markets
Registration
Log in
You agree to website policy and terms of use
If you do not have an account, please register
usdchf 1h chart no 1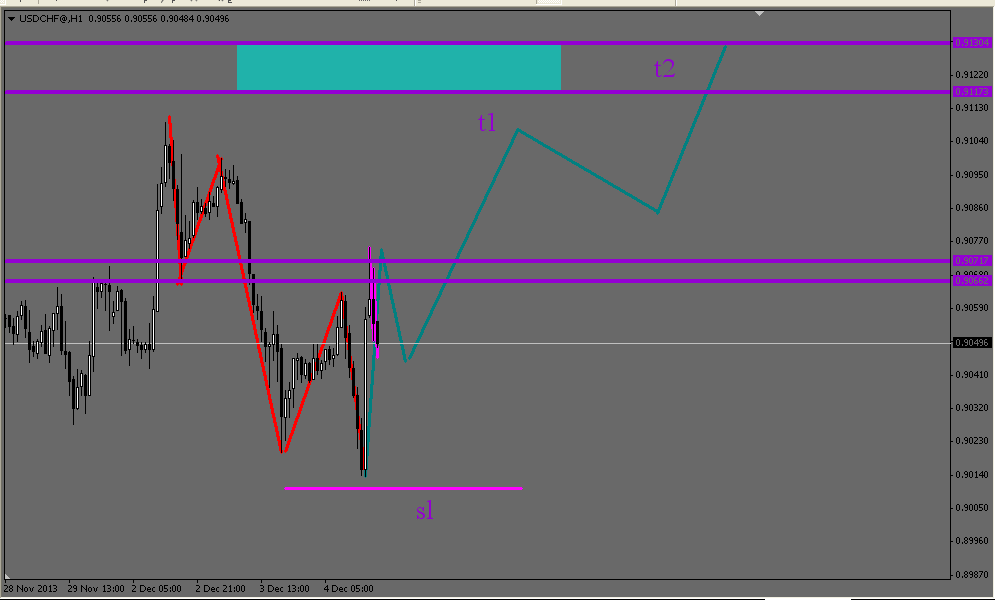
usd chf 5 m chart the end of wave 2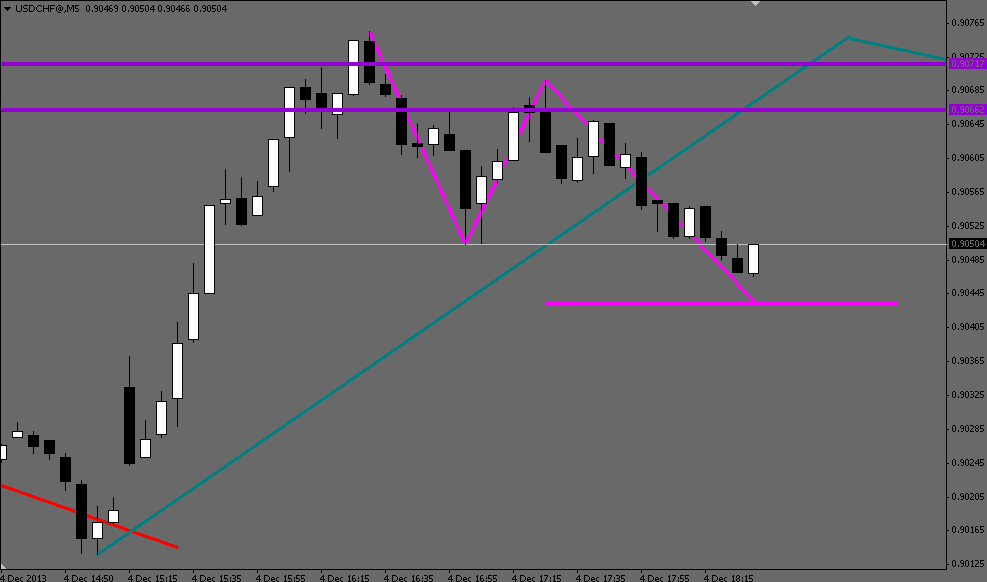
usdchf 1h chart no 1
How did you determine that blue elliot-wave-like movement?
You can see this type of structure movement very often.
Another example.
Bullish bat, bearish N200 and bullish bat.
you need elloit wave as DNA for your chart and need harmonic to confirm your count and need price structure and s&d zone to help you to find the best PRZ.
Bullish bat, bearish N200 and bullish bat.
we'll keep having patterns on eurusd because it's consolidate now forming a triangle
you need elloit wave as DNA for your chart and need harmonic to confirm your count and need price structure and s&d zone to help you to find the best PRZ.
I mean what did you assess in order to construct the wave? I was expecting that you'd expand on that.
irad, that's very possible