Coding help... Cyclical indicator
...
As far as I see you are using centered SMA over difference of 2 centered SMAs (and so on ...) for the oscillator. Here is a first step to it : the centered SMA
PS: Can you specify the exact lengths (or formula) used in a more readable form than the one used in the sheet?
Hello all...
Can someone pls help me to convert the excel formula that I attach into an indicator for metatrader?
It repaints because make a projection of the last available value.
But it traces a cycle indicator and its momentum very clear and precise.
I think it will be useful for all, especially when used in combination with other indicators such as the DSS Bressert, MACD and moving averages.
Here is excel indicator:
Here is an image

I try to explain the columns of excel file "cycleok":
A: market data (to remedy the problem of centered moving averages - last
period to be calculated remains uncovered, for example, with 48-period
centered moving average remain uncovered the last 24 periods) we assume that
data from A1001 to A1500 are exactly equal to A1000;
B: centered moving average of data (24 period) shifted back of half period;
C: centered moving average of data (48 period) shifted back of half period;
D: difference between B and C;
E: centered moving average of D (24 period) shifted back of half period;
F: (value of E) minus (value of E-1);
G: centered moving average of F (24 period) shifted back of half period;
H  value of G) minus (value of G-1);
I: centered moving average of H (24 period) shifted back of half period;
J value of I) minus (value of I-1).
The indicator must have as its output only "I" and "J".
Mladen, I follow your work and I really appreciate your ability. 
Thanks
Lucmat
...
Forgive me for stupid question...just want to be really sure....does SMA Centered repaints?
Forgive me for stupid question...just want to be really sure....does SMA Centered repaints?
Yes, it repaints....
I use this indicator to know where the price is cyclically, but I take signals using moving averages, macd and DSS bressert.
By the way, are there good versions or updates of bressert's dss or BLINE?
Lucamt
...
Lucmat
Try this one out. I think that it is OK (translated the formula you described here in mql), but check it out
PS: the deviation is that it takes half length instead of "full length" as a parameter. It is done so to ensure centering
I try to explain the columns of excel file "cycleok":
A: market data (to remedy the problem of centered moving averages - last
period to be calculated remains uncovered, for example, with 48-period
centered moving average remain uncovered the last 24 periods) we assume that
data from A1001 to A1500 are exactly equal to A1000;
B: centered moving average of data (24 period) shifted back of half period;
C: centered moving average of data (48 period) shifted back of half period;
D: difference between B and C;
E: centered moving average of D (24 period) shifted back of half period;
F: (value of E) minus (value of E-1);
G: centered moving average of F (24 period) shifted back of half period;
H value of G) minus (value of G-1);
I: centered moving average of H (24 period) shifted back of half period;
J value of I) minus (value of I-1).
The indicator must have as its output only "I" and "J".
Mladen, I follow your work and I really appreciate your ability.
Thanks
LucmatDear Mladen
your work is simply wonderful!
What you mean with "PS: the deviation is that it takes half length instead of "full length" as a parameter. It is done so to ensure centering"'
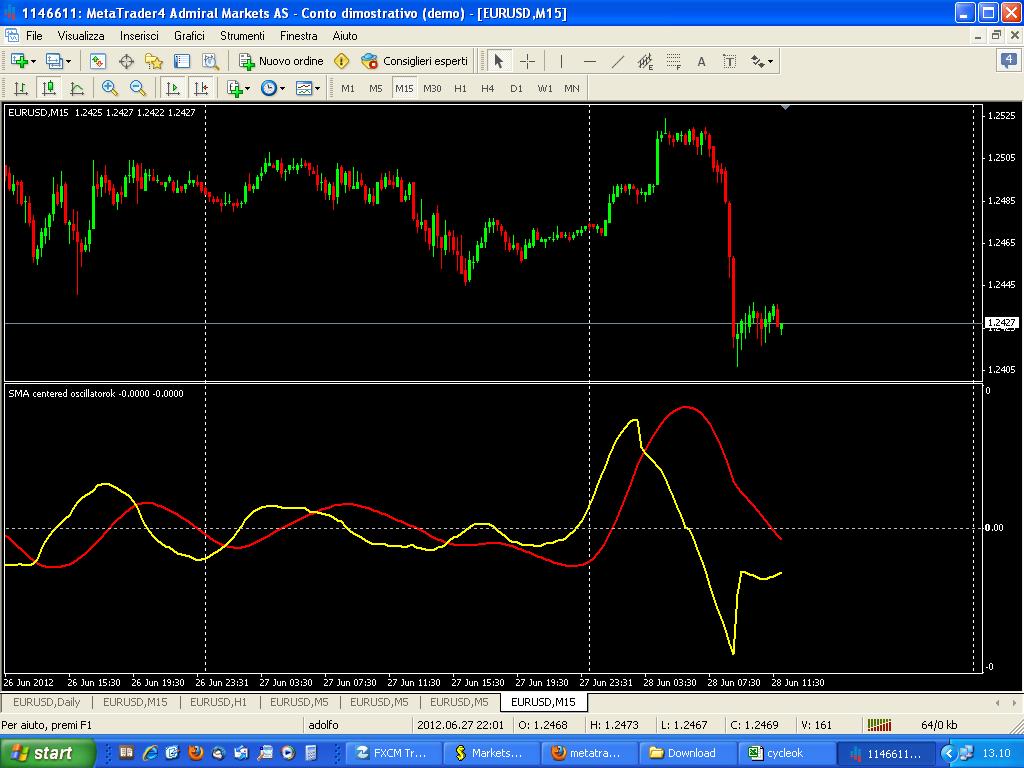
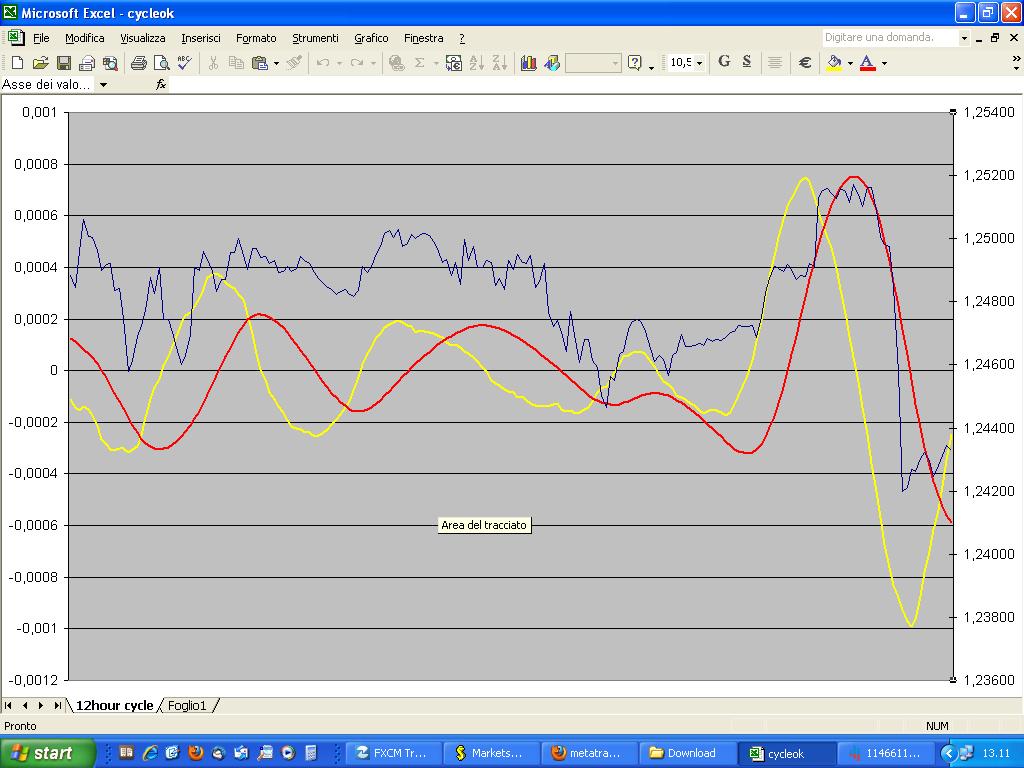
There is only a problem: last period of metatrader indicator is different from excel indicator.
I post their images.
Thanks Mladen 
...
Don't know exactly why is there a difference (what does excel do in cases when there are no values - the missing future values) so try out this version : it calculates the last bars differently. It is a "guessing work" but might be closer to excel version
Dear Mladen
your work is simply wonderful!
What you mean with "PS: the deviation is that it takes half length instead of "full length" as a parameter. It is done so to ensure centering"'
There is only a problem: last period of metatrader indicator is different from excel indicator.
I post their images.
Mladen your second indicator is almost identical to the excel file.
The only difference is in the last few bars.
The problem of centered moving averages is that the last period to be calculated remains uncovered, just because the moving average is shifted backward by n-periods: for example, with 48-period centered moving average remain uncovered the last 24 periods.
In excel I remedy that problem, assuming that the missing values for calculating moving average are exactly equal to the last one: if the last known value is 1.2550 we can assume that every missing and unknown values, required to draw the centered moving average, are equal at 1.2550 (it is a good compromise).
A similar proceeding should be adopted for calculating the other centered moving average of my cyclical indicator.
Thanks Mladen, I really appreciate your work! 
Don't know exactly why is there a difference (what does excel do in cases when there are no values - the missing future values) so try out this version : it calculates the last bars differently. It is a "guessing work" but might be closer to excel version
Hi
Anyone here have done something like the following?
Do a fast fourier transform (FFT) on the price data to obtain the frequency response.
Filter out only the top 3 highest amplitude signals, this is to eliminate the other frquency components as noise.
Do a inverse fast fourier transform (IFFT) of these 3 signals and plot the resultant time domain signal within the band of COG.
The regression of COG through the time domain plus the frequency domain approach will confirm each other to give us a direction of where price is heading.
SMA smoothed Oscillator- cycle stability
As far as I see you are using centered SMA over difference of 2 centered SMAs (and so on ...) for the oscillator. Here is a first step to it : the centered SMA
PS: Can you specify the exact lengths (or formula) used in a more readable form than the one used in the sheet?
Hi Lucmat and Mladen,
Its a wonderful indicator. Liked it. But when I configured it at 1 m chart and 5 m chart, I am facing the cycle stability issue !
Is there a way I can precisely pin point the Cycle Peak and Cycle Trough ?
Thanks for any help.
Regards,
Krish
- Free trading apps
- Over 8,000 signals for copying
- Economic news for exploring financial markets
You agree to website policy and terms of use
Hello all...
Can someone pls help me to convert the excel formula that I attach into an indicator for metatrader?
It repaints because make a projection of the last available value.
But it traces a cycle indicator and its momentum very clear and precise.
I think it will be useful for all, especially when used in combination with other indicators such as the DSS Bressert, MACD and moving averages.
Here is excel indicator:
cycleok.xls
Here is an image
Thanks to all