Advanced trading lessons - page 4
You are missing trading opportunities:
- Free trading apps
- Over 8,000 signals for copying
- Economic news for exploring financial markets
Registration
Log in
You agree to website policy and terms of use
If you do not have an account, please register
...
IGoR already knows my opinion on market randomness ...
I would like to add just one thing that needs to be thought of : when talking about laws of entropy in that manner it is about entropy of isolated systems. Stating that market is "isolated system" is rather unwise (just take a look at the recent "random" Swiss ... what shell we call it ... head scratching as an obvious example and then all the "isolation" part is lost). Market would be random if there was no energy invested into it (the market itself). But since it is anything but an isolated system ...
And to remind that those same laws (the 3 principles - laws of thermodynamics of which the entropy is just a part) make the airplanes fly, among other things ... without any randomness, otherwise I doubt that there would be a single passenger taking a flight on any airplane
To conclude : good work boe. Keep it up ...
You can not and will never be able to predict the markets. They are absolutly random.
iGor you can't believe this as an absolute statement, or the spread and commission alone would ensure you yourself are not a profitable trader. Even if you believe in a longer term trend, that it it's essence is evidence that the markets are not absolutely random.
Or are you implying that you only make money via money management, i.e. martingale.
From what I've read about you, you do not use martingale, but there must be some edge somewhere?
Ryan
Hi Mladen and rick,
I will not start to clutter up this topic of Boe with a debate again on randomness or predictable.
Boe talks about support line and price paterns. Rick you talk about trend. Then Mladen talks about entropy in isolated systems....
I just want to show all 3 of you something and think this really through. Not just have a look at it but really think what is happening in that zipfile.
Does it give proof that the markets are acting like a random price generator. Or is a random price generator acting like the markets (which
you guys see as predictable or driven by some forces).
In the zipfile you will find an excel sheet. When you open it make sure that your Macro's are enabled. There is a button that you can click.
Every time you click it will generate a 100% random chart. No mass psychology nor any other force is making this chart. As I said for all the
same it could be a chart that per each country showing how many people smoke cigarets or watch football or the amount of rainfall in the amazon
or what ever...
Included in the zipfile you find some charts. I did some technical analisys based on the support and resistance lines and price paterns. There
were even perfect head and sholder formations. You name a patern and it was to find on a chart. You will see consolidation and you will see
trend periods. As I said please have a long thought about this. What does it proof it or what does it proof on how markets behave. What is
the difference between what you see in the zipfile and what you see on your charts ?...
Rick I will and would never use any martingale nor any grid systems nor avering down or any other obscure trading techniques or special MM. I trade in the most normal way.
But to give some more proof to you: can you show me a system that has a S/L that is equal to its T/P (in fact the stoploss needs to have the spread added and the T/P needs to have spread deducted. ex. T/P 101 pips and S/L 99 pips or T/P 21 and S/L 19pips) that has a hitrate higher then 55% ??
I am trading for 16 years now and I have NEVER encountered such a system.
If you have an edge or a predicting capability then one should have a hitrate higher then 55% even with a S/L that is equal to it S/L. Again I NEVER saw such a system working over a longer period of time and on several pairs( there is not one indicator in the world that can do this nor a combination of indicators nor a combination of rules) (if you can find me such a system, I prommisse, I will pay you big money for it).
I hope this post will help to look to trading and randomness in a bit different way. But remember it is not because markets would move randomly that you are not profitable. That are 2 different elements. People always think or reply to me: I am making money so markets are not random. Well I am making money also in clear and proven way and over a long period of time and still I say that the markets are random and that everything you see on a chart can be done in the same way with a 100% random price generator.
Friendly regards... FXiGoR
...
iGoR
You already posted those example(s) some 1.5 years ago, and I will answer you the same thing I told you then : use a simple auto correlation function of that "random" values and when you get a value of under 0.9 rejoice. That example is anything but random and is just showing that combining random number generator with known ranges (since that example is using predictable range which is also 100% applicable to the real market too : ranges are predictable) there can not be anything similar to "randomness" you are talking about.
As of entropy of an isolated system : it is saying that a degree of disorder (entropy) of a closed / isolated system can not be lessened without adding energy into that system (or subtracting "members" of that system). If you think that market is an isolated system, then I am afraid that you are ignoring just the whole world, nothing less. Market can not be and never will be an isolated system, hence any attempt to apply that "law of entropy" as you call it, in a manner you are trying, to a completely opened system in which "energy" is pouring in in every nanosecond is plain meaningless
friendly regards
Mladen
wow
what bunch of smart traders!! you guys seem very into your work as i have been,
regardless of any disagreements here, my impression is there is some great trading minds
here. i like the discussions also.
you guys are 100% correct about one thing for sure," the market needs to be look at with trust!!
the contrary trader will loos as much as any other type of trader, if not more...
no i promise you just because i may talk about contrary views does not mean that,s how i trade.
i promise not to mess any of your friends and client up with that same old song!!
no when i get near the plan part, i will talk about. the core of trading, identifying no predictions
at all, the market can walk on me as well as anyone else, it happens to me, and each time it
does it reminds me i am no god here!!no one can be!
but what i do want to show is places of probability, and places to take risks!!! how a true plan
can eliminate emotions from trading. not crappy plan, not a definite plan, but a plan that flexes
with the markets as the markets flex.
the contrary view that is held in high regard: but only after contrary view takers get kick off the markets
the trusting the market view is held in high regard by me also, other wise i could not make money.
both views are important to me. by you guys are some smart assume traders, i can tell that.
as go on with this, its my wish for you guys to put your opinions in discussions i like that.
i like to here what experience traders, like your selves honest inputs. thanks this is fun.
also i hope we all grow from this forum.
i want to go off track here a moment.
you see, this is what i have done for researching the market.
i wanted to find the reality of the markets. that takes honesty.honest with yourself.
honesty when back testing.
i started years back in my early days, i would look at candles, all sorts of candles.
trending candles, pin bars, spinning tops.. i wanted to know what makes them tick.
i look at the lower frequencies of candles and how where they formed? not from
any point of view, just honestly.. what was the price action inside a trending candle.
was their contrary candles inside weekly candle: yes, pins going the wrong way: yes. was there
fake smaller move with the trend, only to break the highs of some smaller consolidations on short trend: yes
was there trend line breaks: yes constantly. this was just what i kept seeing.
that was not enough for me though, i wanted to know and gauge strength and weakness quickly.
so studies habits of the markets, clues to this regard.
later i realized that was not enough. i wanted to learn psychology of the markets, not the usual
bull crap, i wanted to know, how it applies to the reality of the markets, so i spent another
year studding that.
that was not enough, i needed to identify smart places to take risks. i wanted place that left me emotionless. so studied ranges, for another year. i been offered jobs in trading, turned them all down.
on line trading academy offered me lots capital to teach their pro. traders to how i trade. i am
not perfect. but i have fun trying to get there, if possible. so what ever happens here , i think at least
we can all learn from this forum discussions. i wanted to say i am not above learning, that's how i got where i am. i do not have all the answers i wish i did. do i have some real and working trading ways
that really make money in the market? well i would never write this stuff i did not. will i change your
life and open your eyes, i can only hope!!
that being said lets have fun.
Hi Boe and Mladen,
To Boe:
as said I do not mean to clutter up your topic because I know from experience that when "some great trading minds" as you call them start a little inside discussion and they decide to stop or leave that the whole topic dies out because it scares of newbies that want to learn something.
Your topic is a good initiative. It is to help people and there can never be something wrong with that. I just disagreed with some major elemantary elements and or claims you made. Your way of taking an entry or exit is or can be help to some people that only see chaos in a chart. And with your help they start to see some structure on a chart and start to see some logics in the chaos. So please my friend continue with what you are doing. It is your topic and the majority of the people need your help and have no help with what I say.
To Mladen::
Indeed I showed this proof already quite some time ago. But that means that I am consequent I need to be honest to you I do not understand that corellation thing with a value lower then 0.9 etc....sorry...
But I have a feeling where you want to get me to. So please let me explain you this: If you start with a theoretical chartand give it the value 1.3000. And you start to toss a coin. And for every HEAD you toss, you add 1 pip to that value of 1.3000 and for every TAIL you deduct 1 pip. Then I can asure you that you will get the exact same chart as you see in my previous spread sheet. It will indeed stay in some sort of a real market range. But that will be done in a 100% random way to get that chart. Again tossing a coin is a 50% probability to get tails or 50% to get heads.
But will you then say to me: Igor that is not random. Because you start from 1.3000 and that value combining with random number from tossing a coin with known ranges, can not be anything similar to "randomness" you are talking about ???..Mladen, that is what you said in your previous posting.
Mladen, you also say: the randomnes I talk about ?... there are not several randomnesses. Or one can predict with a certainty higher then 55% an event that will happen in the future. In our case that means if the next bar will go up or if the next bar goes down. And if one would be attempted to say: I do not know the direction of the next bar (the closest possible event in the future) then he can not come and say: But I do know the direction of that chart in 15-20 or 30 bars.
Or one can not predict at all the outcome of the next event that will follow and then we speak about only one state and that is randomness.
To give an example: photons that are created in the core of the sun will ALWAYS move to the surface of the moon. So one could say: YES I can predict that photons will move to the surface of the sun with 100% certainty and then they will shoot out in space in the formation of light.
BUT
It is scientificly accepted that one can not predict the way photons will move from the core of the sun to the surface or how long it will take. For some photons it takes 5000 years to get to the surface for others it takes 10.000.000 years. And that is scientifcily considered as randomness
In entropy one can not say: If I drop this glass, filled with red wine, on the floor, I don't know if it will break, but I do know that the red wine will be splattered on the floor and the shards will be all over the room. Implemented to trading then according the entropy rules you can not say that one does not know the direction of the next bar or second bar, but that one would know the direction of the 15th bar.
To give you an idea how strong a system would be if it would be capable to predict the outcome of the next bar with a certainty of "only 55%."
I added a zipfile. Again if you open the zipfile make sure that you have Macro's enabled.
I have placed a weekly chart from the euro in an excel sheet. The only thing the spread sheet does is go long or short at the beginning of the week with a certainty of 55% ( you can change it) and stay in that position till the end of the week. No S/L and no T/P. Meaning that no money management can influence the test.
If you click the sequence button 10 times it will be very clear that you have a HOLY GRAIL if you place an indicator or system or set of rules that can predict the outcome of the next bar with a certainty of 55% and that on 10 different pairs.
As said I do not want to clutter up this topic with a "does god exist yes or no" debate. I have a scientific aproach in everything I do. I try to give proof in a mathematical way to give a scientific proof that the market is random. If you would have a scientific proof where you can show me that the markets are predictable can you please provide some results where you clearly show that you can predict the outcome of the next event or bar and that show proftable results in your personal trading on several pairs with a 55% hitrate with no S/L and T/P or with a hitrate that is equal or higher then 55% and where the avg. winning trade is equal or smaller then the avg. loosing trade ?...
For the sake of Boe I would like to keep this topic as tight as possible. To do so I suggest that you show proof that we can all understand and see with our eyes (in trading the best way to do that is by showing results--verified publisher links. I hope you understand because there are to many people who make claims and think and suggest and know and are sure and have heared and have seen or they know a friend or they had such results 3 years ago etc etc etc).
Iknow I make a good living in trading but I know if have that tindicator that could predict just that 55% of the times the outcome of the next bar then I would be 100 X times richer next Xmas.
Friendly regards... FXiGoR
PS. For the newbies or people who have less experience, if you think or know about systems that have a clear hitrate far above 55%, please be awere that the additional rules I mesnioned above, are VERY important ( T/P needs to be equal or bigger then S/L. Or No S/L and no T/P and time of entry and exit always need to be the same).
you know i went back over my post from the beginning
i see it is very difficult to explain things well, when i can not show people personally
and talk to people personally. so i have to be more graceful here.
i am about to drag people into new territory here, lets organize your brain.
one of the most difficult things to do as a trader, let alone for trader to teach!! this will take some real effort here.
what we are going to try to achieve.
this could blow some fuses here this is not hard but it is a deliberately complicated sequence.
think of a time frame as range between two points.
inside that there are smaller time frames. smaller ranges.
if a time frame closes strongly down, inside that time frame was a time frame that did not close
strong every single time.
somewhere inside that time frame fuel was taken (a trap) trend line break trap candle or candles.
but now the candle is closed. so looking at the higher freq. it's just a down candle.
but what happened while that candle was formed.
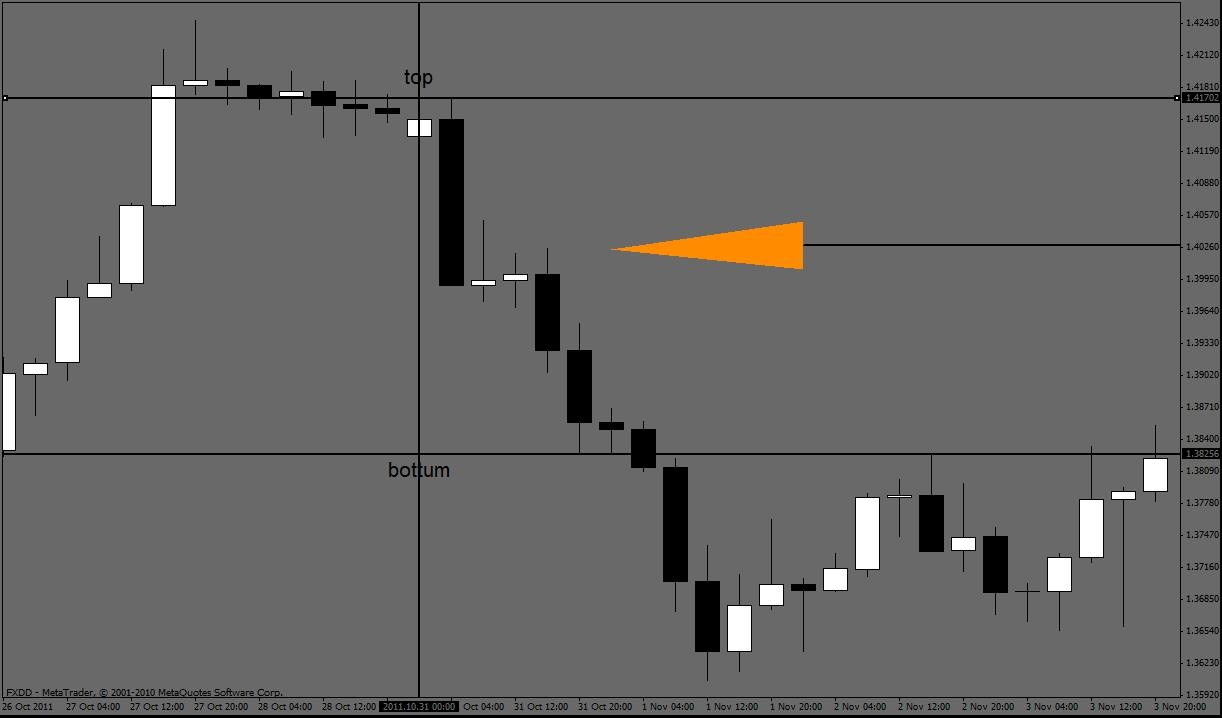
so lets take a look at that first daily candle in this shot, looks smooth, nice, strong!!
now the next thing is:
we are going to jump down one frequency and look at the candle in the inside.
going from the daily to the 4 hour.
not much there a couple of spinning tops, i don't see the trap? ok