Ranging indicators:
- MTF_HI_LOW: multi timeframe indicator for high/low daily, week and so on in one chart window.
- some good ranging indicators (averaging daily, weekly etc) is here.
- Range Indicators are here.
- Price amplitude counter: original thread.
- Narrow Range Day Indicator: the thread with good informative indicator.
- MTF Range indicators are here.
Re:
hello Newdigital,
Thank you so much for all related information. I appreciate for it! All indicators look very interesting.
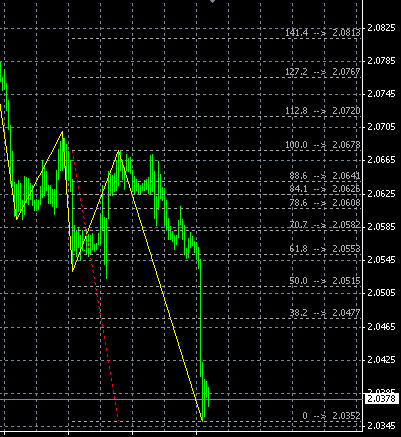
I have attached the pic following example of showing price range (see 2.00) like I mentioned previousely. Do you think there exists the similar simple indicator like this? It would be fantastic if it is like Fibonacci retracemnet on MT4.
Thank you!
H.
You can check ZZ_Ensign_Fibo indicator on this page:
https://www.mql5.com/en/forum/172952

For more advinced versions check this popst for ZUP indicators https://www.mql5.com/en/forum/178120
And all the links concerning zigzag indicator: https://www.mql5.com/en/forum/172952
Some other links:
- Channel trading system with zigzag indicator is here.
- Follow The Bouncing Pip: trading system with zigzag indicators and good EAs, for example: bouncingPipEA_BigBear_v23 EA and bouncingPipEA_mPowerV41 EA.
- Zigzag Scalping system is here.
But I think your case is more related to ICWR indicator:
ICWR:
- ICWR development: original development thread with indicators, explanatuions and so on.
- ICWR indicator with alert is here.
- ICWR as an EA: EA development thread and the other thread with EAs.
- ICWR Trades: the thread about how to treade manually using ICWR indicator.
Re:
Hello Newgidital,
thanks so much for all information!
I have checked all threads and indicators, and found out that
this would be easiest and fastest way to calculate the High and Low (price range).
Drawing trendline and go to option and check the value, which shows High and Low price. Then calculate the price range.
I would check out all info you sent to me again and see how I can fit into my trading style.
Thanks again, Newdigital!
Cheers.
Job Well Done
Newdigital,
I follow several forums regularly. The service you provide is second to none. I appreciate the time it takes to locate all the threads and web sites to give an informative response to a question.
You are an asset to those who choose to learn.
My best regards,
Richard Dutcher
"If you enjoy what you do and do it with passion the money will come" Richard III
Bid and offer price in chart window
Hi
I have tried searching with no luck, i would like to see the bid and offer price of the fx pair in the same window as my chart, also a decent per secont/minute candle count down timer would also be useful, anyone have any ideas?
Why did you move my post to here Newdigital, this thread has no relavence to my question?
Why did you move my post to here Newdigital, this thread has no relavence to my question?
I did not find any thread to move. So I moved on this links thread. If someone will create MTF indicator for ask/bid price so this thread will be good one as there are some other links above.
I am looking for the price number of the sell and buy to be displayed in the same window as the chart to save me looking over to the price column on the left. Example: 19100 (to sell)/19102 (to buy).

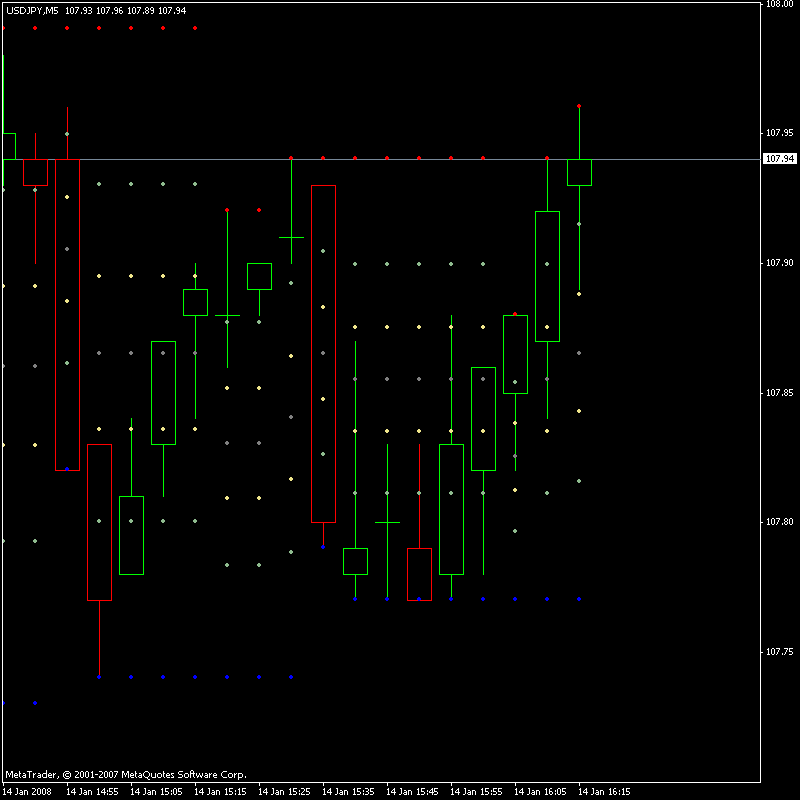
TRO DYNAMIC FIB SR plots the fib retracement dots from the dynamic support and resistance levels.
- Free trading apps
- Over 8,000 signals for copying
- Economic news for exploring financial markets
You agree to website policy and terms of use
Hi,
I am wondering if somebody know the following indicator or could code this.
(price range indicator)
* To calculate automatically the price range between A and B...
like Fibonacci retracemnet on MT4
It would be very appreciaitve if you could kindly let me know it.
Thank you.
H.