Price range calculator for MT4 - page 2
You are missing trading opportunities:
- Free trading apps
- Over 8,000 signals for copying
- Economic news for exploring financial markets
Registration
Log in
You agree to website policy and terms of use
If you do not have an account, please register
Thank you TheRumpledOne for complete post of indicator with chart.
Please, is there an explanation manual or thread for further knowledge.?
Thanking you in advance
This is a great indicator, thanks.! Can you modify the indicator to have the fib retracements/expansions only from the support/resistance dots and not from every bar?
In other words. The fib dots are only painted when a new set of support resistance dots are painted.
thanks again for your work
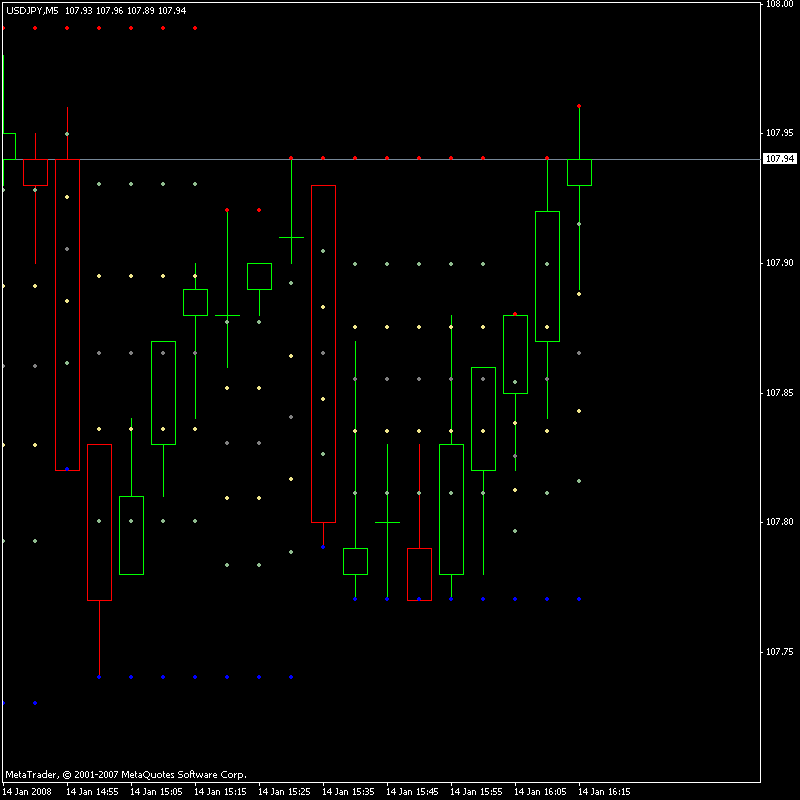
TRO DYNAMIC FIB SR plots the fib retracement dots from the dynamic support and resistance levels.Hopefully this is clearer. Can the fibs only be drawn in between the blue and red support and resistance major areas?
Can any of the clever coders fro this great site do this?
thanks
Alta
Change the period of support/resistance.
Still paints the intermediate dots. Can this indicator only paint the major support/resistance only and the associated fibs?
thanks
Change the period of support/resistance.
MT4 code
Is there a coder out there that can code a "simple" pop up/info box, that gives the open, close, high, low of a candle that has closed, in my case a 4 hour candle? Or is there something already available????
Is there a coder out there that can code a "simple" pop up/info box, that gives the open, close, high, low of a candle that has closed, in my case a 4 hour candle? Or is there something already available????
9oymkgj
BidAsk_Flow Indicator
Hello my friends.
I learned about this indicator from another trading platform besides MT4. Perhaps someone can write a code for Mt4 as well.
Basically the indicator looks like a Heiken Ashi candle, but without the candles's shadow only the body. Then it paints the candle body green when the ask volume is hit and red when the bid volume is hit. So basically you can see if the bid or ask is hit.
The size of the body also depends on volume but forget about that in MT4.
I attach an image.
Could someone code this into MT4?
Thanks.
Ranko Chart
Hello my friends.
I learned about this indicator from another trading platform besides MT4. Perhaps someone can write a code for Mt4 as well.
Basically the indicator looks like a Heiken Ashi candle, but without the candles's shadow only the body. Then it paints the candle body green when the ask volume is hit and red when the bid volume is hit. So basically you can see if the bid or ask is hit.
The size of the body also depends on volume but forget about that in MT4.
I attach an image.
Could someone code this into MT4?
Thanks.Hi McDuck,
This is ranko chart system and discussed on This forum as well under Mr.Nims Ranko system
Thank you for your post.
But the indicator I am talking about is not Renko.
Renko is based on price movements.
The indicator I have posted is based on bid/ask volume. It tracks whether the bid or ask is hit and paints the bar accordingly.
It could be extremely useful.