RSI of Moving Average - page 32
You are missing trading opportunities:
- Free trading apps
- Over 8,000 signals for copying
- Economic news for exploring financial markets
Registration
Log in
You agree to website policy and terms of use
If you do not have an account, please register
Their SimpleMAOnBuffer has the same error as their iMAOnArray (they use the same way of calculating). It is the way that is made to be faster but they overlooked the case of repeating values and SMA.
Here is a function that always calculates correct values, and is as fast as that fast way they are using (even in those cases of repeated values, so all in all, it was just a matter of writing it using different calcuation way and predicting what can happen with the way they are using):
double iSma(double price, int period, int r, int instanceNo=0)
{
if (ArrayRange(workSma,0)!= Bars) ArrayResize(workSma,Bars); int k = period; instanceNo *= 2;
workSma[r] = price;
if (r>=period)
workSma[r] = workSma[r-1]+workSma[r]-workSma[r-period];
else { workSma[r] = 0; for(k=0; k=0; k++) workSma[r] += workSma[r-k]; }
return(workSma[r]/k);
}
Nice
Tested it on some data and it really fives correct results
I think OHLC is held. I just made another test and if you plot simple RSI mismatch don't occur.
(basic test methodology - if nothing works back to the square 1). So RSI which is implemented
in MT4 as separate script is working.
But i think during 'test mode' some imprecisions are occuring most likely for speeding up as the biggest mismatch occurs for this test in detrended mode as Close-mab is a very small value.
So all those iMAOnArray/iRSIOnArray/iMA internally may use much lower precision than 'double'
Simple test. Rewrite this indi using scripts like SimpleMAOnBuffer from MovingAverages.mqh
but not build in functions would confirm/deny this theoryTheir SimpleMAOnBuffer has the same error as their iMAOnArray (they use the same way of calculating). It is the way that is made to be faster but they overlooked the case of repeating values and SMA.
Here is a function that always calculates correct values, and is as fast as that fast way they are using (even in those cases of repeated values, so all in all, it was just a matter of writing it using different calcuation way and predicting what can happen with the way they are using):
double iSma(double price, int period, int r, int instanceNo=0)
{
if (ArrayRange(workSma,0)!= Bars) ArrayResize(workSma,Bars); r = Bars-r-1; int k = period; instanceNo *= 2;
workSma[r] = price;
if (r>=period)
workSma[r] = workSma[r-1]+workSma[r]-workSma[r-period];
else { workSma[r] = 0; for(k=0; k=0; k++) workSma[r] += workSma[r-k]; }
return(workSma[r]/k);
}
RSOMA non detrended results
Here are results for RSIOMA EA non detrend setting for 6 pairs for 1 week 1 min data. Seems to be slightly profitable
Krzysztof
USDJPY Gross profit 67.74 Gross loss -85.46
GBPUSD Gross profit 118.30 Gross loss -133.40
GBPJPY Gross profit 127.93 Gross loss -217.59
EURUSD Gross profit 194.50 Gross loss -77.30
AUDUSD Gross profit 126.80 Gross loss -97.50
AUDJPY Gross profit 163.33 Gross loss -126.12
PF 1.08
RSOMA detrended results
and here are some RSOMA results with detrending.
USDJPY Gross profit 204.17 Gross loss -124.32
GBPUSD Gross profit 98.10 Gross loss -126.90
GBPJPY Gross profit 285.54 Gross loss -250.14
EURUSD Gross profit 135.30 Gross loss -159.70
AUDUSD Gross profit 135.40 Gross loss -127.30
AUDJPY Gross profit 119.84 Gross loss -289.95
PF = 0.9
Seems detrending makes more harm than good
I cloned RSIOMA with DZ to MATLAB and discovered another surprise. Here is a screenshot of MATLAB plot
and here screenshoot from MT4 on the same data with the same settings and its clear difference between them. The timing of crosses
between RSI and DZ seems to be similar, overall shape also but absolute values of RSI and DZ very different !!! Only explanation of it is that RSI calculated as iRSIOnArray is calculated in some strange way like e.g. internal smoothing is applied which supresses absolute levels of RSI. Can someone explain this ??
Krzysztof
here is a screenshoot of RSIOMA based on Wilder RSI (the most bottom window) and MT4 RSI. Clearly the slopes of Wilder
RSI are more horizontal so Dynamic zones are much wider.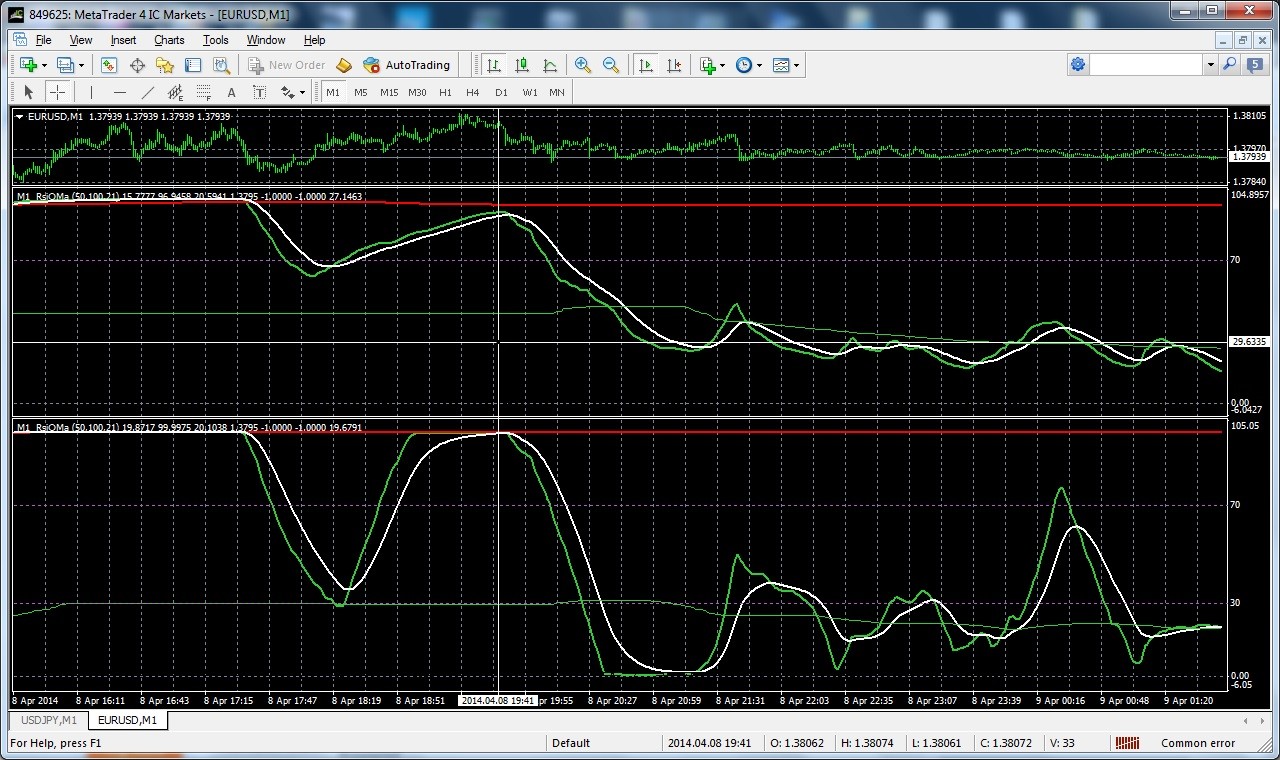
and the code of function which calculates Wilder RSI
double rrsi(double& data[], int period, int j)
{
int i;
double diff;
double advances;
double declines;
double rs;
double rrsi;
for(i=j; i<=j+period; i++)
{
diff=data-data;
if(diff>=0)
advances+=diff;
else
declines-=diff;
}
// Calculate RSI
if (declines !=0){
rs = advances / declines;
rrsi = 100 - (100 / (1+rs));
}
else rrsi = 100;
return rrsi;
}
Krzysztof
You might want to read this post : https://www.mql5.com/en/forum/183208/page2
It might save you some time (I was looking for my coding error for 1 whole day only to find out that the error was not in my code at all)
regards
Krzysztof
You might want to read this post : https://www.mql5.com/en/forum/183208/page2
It might save you some time (I was looking for my coding error for 1 whole day only to find out that the error was not in my code at all)
regardsYes, RSIOMA using both iMA and iMAOnArray and after replacing RSI implementation with Wilders
one (so like in MATLAB) MT4 chart still does not match MATLAB chart, its only 'more or less'
similar.
Krzysztof