ASCTrend system - page 40
You are missing trading opportunities:
- Free trading apps
- Over 8,000 signals for copying
- Economic news for exploring financial markets
Registration
Log in
You agree to website policy and terms of use
If you do not have an account, please register
Trading simulator, part #2
How to trade.
So, the chart is moving, everything is going on and under controll. Now we need to understand about how to trade.
1. Open buy or sell orders.
Press b on keybord for buy and s for sell.
Visually you must see buy or sell arrow on the testing chart.
For example, I pressed b and I see the following (i just added b key for this image):
2. Modify the order for stop loss and take profit.
- Press pause
before pressing pause (chart is moving)
after pressing pause (chart is not moving)
- double click on arrow (buy or sell arrow)
before
after "double click"
Trading simulator, part #3
- right mouse click on arrow (remember: arrow is your order), then "Arrow properties" and you must modify this window
You see this: Price= 1.4163.
It is the price for the order. I opened buy at the price 1.4163 with stop loss =0 and take profit =0. So, place your stop loss and take profit (price).
For example, I am modifying this order for stop loss = 1.4113 and take profit 1.4363:
Press OK.
Press F12 (you may press F12 on your keyboard many times).
Then open "Results" to see your modification:
Press pause and chart will start moving.
3. Pending orders.
The chart is moving. And you want to open buy stop, or sell stop, or buy limit, or sell limit orders.
- press this one in Metatrader
Use "Arrow UP" for buy orders and "Arrow Down" for sell orders. When click on the place of the chart where you want to open pending order:
if you click (by mouse) with "Arrow UP" on the place which is above the price so buy stop order will be opened; below the price - buy limit.
Use "Arrow Down" for sell pending orders.
And we may see that our pending order is opened now (buy stop in my case):
If you want to modify pending order for stop loss and take profit so use the explanation above: it is the same as with the other orders - press pause, double click on pending order arrow, properties, modify the order and press ok, then press pause once again and chart will start to move (or press F12 on keyboard if you will modify the other orders for example).
Trading simulator, part #4
4. How to close the orders.
Press this one on keyboard if you want to close all buy orders:
It is for close all sell orders:
If you want to delete all pending orders so press d (keyboard).
If you want to delete just one pending order,
or
you want to close just one order
so you may do it in the same way as modification of the order:
press pause; double click on arrow of the order you want to close; right-mouse click on arrow; open "Arrow Properties" and type:
del - to delete pending order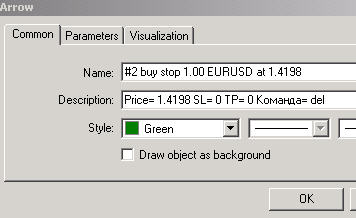
close - to close buy or sell order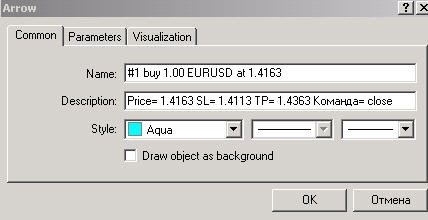
Don't forget to press pause for the chart to continue to be moved.
Trading simulator, part #5, last one.
Making the statements.
To make the statement you need to stop testing: press Stop button on Tester's window.
Then open "Report", right mouse click and select "Save as Report".
It is the statement of our info template to few days, H4 timeframe.
And please find those two files (EA and dll file attached).
Why we need this trading simulator?
- We can test our manual trading systems without any EA creating.
- We can improve our trading technique. We even can start some thread about trading technique: for example support/resistance and so on.
- We can backtesting 1 or 2 months just for few hours and it is very good for the people who do not have time to trade full time.
- and we will have the statements with 90% modelling quality.
Thanks ND, that clears things up. Happy Holidays..
As I said in many posts so I am always starting the day to analyze the pairs.
Today I was busy in the morning replying to some other threads ... but anyway we can start now.
Just want to remind that we are having 4 templates:
- 1 M5 trading template;
- 1 M5 informational template (baicly using for exit);
- 1 H4 template (informationl one);
- 1 D1 template (informationl as well).
Everything is on the first post of this thread as the links or attachments.
EURUSD.
It is our main trading template looks like:
From this template we can understand in the morning that price was too far from pivot like, it was local downtrend. Pobable we should not trade this pair today (or in this first half of the day). But to take final decision so we must look at the other pairs and templates.
From our informational template we can understand that this downtrend was finished probable (look at the 3 stoch indicators). But anyway downtrend can continue but we can espect big movement only because of some news events.
It was our "theory" in the morning.
To prove this theory we need to look at H4 and D1 informational templates.
It is H4:
It is D1: