Indicators: ZoomPrice tick indicator
Can the indicator be moved to the chart window without a frame or will slow down the terminal?
and also it is possible to make lines [brown, blue, red] switchable in settings?
Can the indicator be moved to the chart window without a frame or will it slow down the terminal?
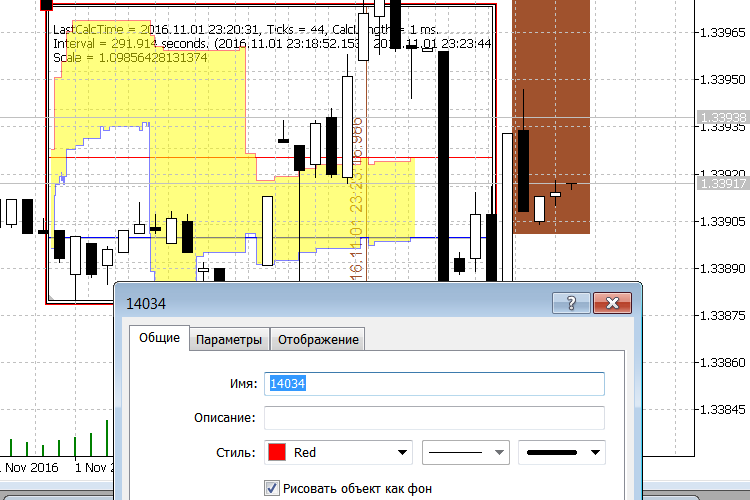
This is an interactive graphical object, some properties of which are changed (for example, coordinates) via CTRL+B (it will be visible as Chart if you press "All"). Therefore, you can do everything with it that you can do with standard graphical objects. In particular, place it in any window (subwindow).
The short EA source in the description does just that.
in this variant you can switch the chart to other symbols, and the object will continue to show the symbol on which it was originally created.
and also can you make the lines [brown, blue, red] switchable in the settings?
These lines carry certain information
- brown (by default) - vertical line shows the time position at the cursor location, horizontal line shows the price.
- blue (default) - shows bid-price at the cursor position. At the same time, the time of this tick and the spread are displayed on the right (along the vertical scale).
- red (default) - the same for ask-price.
This is an interactive graphical object, some properties of which are changed (e.g. coordinates) via CTRL+B (will be visible as Chart if you press "All"). Therefore, you can do with it all the same things as with standard graphical objects.
There it is also possible to switch off the vertical scale and place the object on the background of the chart.
Thus, you can get, for example, a background tick chart (historical/realtime) of variable scale.
In general, how to use this object is a matter of imagination.
By default, "Display trading levels (levels of open positions, Stop Loss, Take Profit and pending orders) on the chart" is disabled on a tick chart.
But enabling this mode is sometimes useful
On the screen you can clearly see that a SELL-position was opened and the bid-price (penultimate bar) fell below the TP-level. However, it becomes clear why TP was not triggered - ask-price (red broken line) did not reach TP.
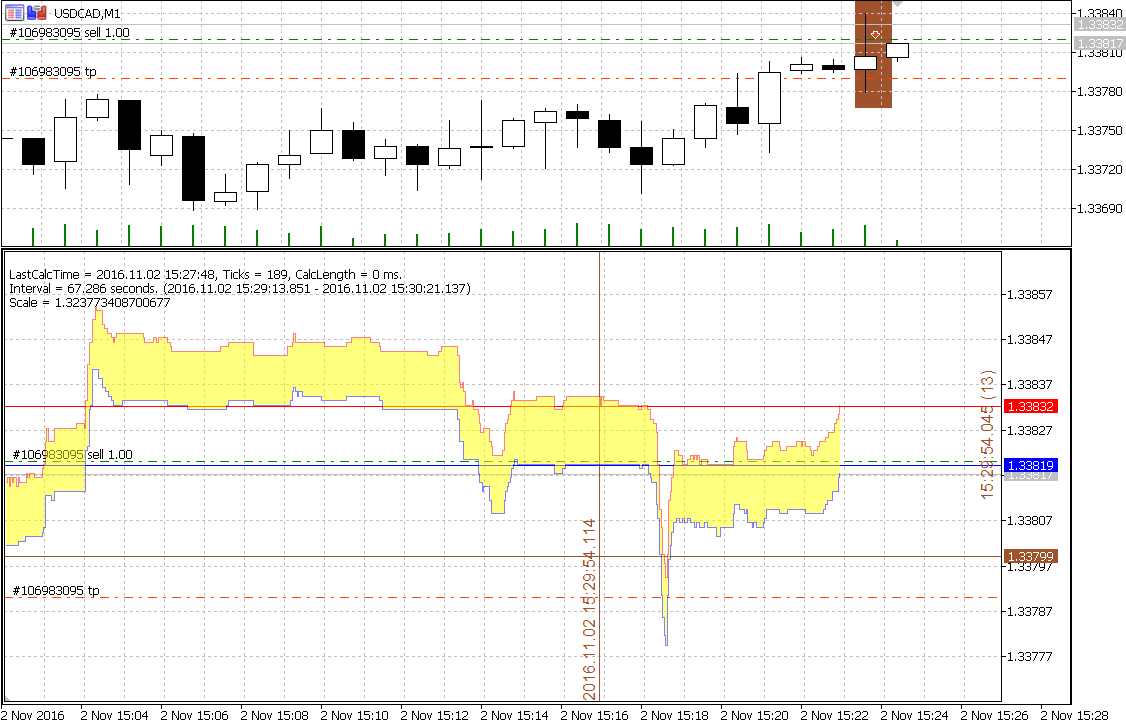
The display can be switched on by editing the source code
in this line you need to replace false with true. Or, if you want the tick chart to get the same settings as the main chart, comment this line.
.
By default, "Display trading levels (levels of open positions, Stop Loss, Take Profit and pending orders) on the chart" is disabled on a tick chart.
But enabling this mode is sometimes useful
On the screen you can clearly see that a SELL-position was opened and the bid-price (penultimate bar) fell below the TP-level. However, it becomes clear why TP was not triggered - ask-price (red broken line) did not reach TP.
The display can be switched on by editing the source code
in this line you need to replace false with true. Or, if you want the tick chart to get the same settings as the main chart, comment this line.
.
The first tick indicator "fxsaber" is more functional and convenient. You could overlay standard indicators on top of it in the chart window. You could apply 'scale by pips per bar' to the chart. Everything is clear. In the same indicator 'zoomprice' everything jumps and slides, while you adjust it to yourself a hundred years will pass. Crosshairs and blue and red lines are superfluous at all, they only distract you.
The only advantage of "zoomprice" is that it looks faster than "fxsaber".
The first tick indicator "fxsaber" is more functional and convenient. Standard indicators could be overlaid on top of it in the chart window. It was possible to apply 'scale by pips per bar' to the chart. Everything is clear.
I'm a weak terminal user, so I'm not aware of what the advanced ones need. It would be useful to know how you use it. For example, the 'scale by points per bar' mode has never been enabled and I don't know how it can be useful. In general, please share your experience.
In the same indicator "zoomprice" everything jumps and slides, while you adjust it for yourself a hundred years will pass.
Nothing should jump and slide. Understand the interaction interface. It is very intuitive, as it seemed to me. I adjust the scale with a mouse. If someone has problems with it - please speak up. So far, I have only one dissatisfaction.
To understand how to set the same settings for an object, here is an example EA.
input int exY = 50; // Y-coordinate
input int exWidth = 450; // Width
input int exHeight = 300; // Height
input bool exShowGrid = true; // Grid
input color exColorBackGround = clrSnow; // Background colour
input bool exTradeLevels = true; // Orders
input bool exPriceScale = true; // Price scale
#include <fxsaber\ChartObjects\ChartObject_ZoomPrice.mqh>
// CHARTOBJECT_ZOOMPRICE ChartObject;
CHARTOBJECT* ChartObject;
void OnInit( void )
{
ChartObject = new CHARTOBJECT_ZOOMPRICE; // Create ZoomPrice object
// It is possible to set and read any object properties from enumerations (F1 - help)
// ENUM_OBJECT_PROPERTY_INTEGER, ENUM_OBJECT_PROPERTY_DOUBLE, ENUM_OBJECT_PROPERTY_DOUBLE
// ENUM_CHART_PROPERTY_INTEGER, ENUM_CHART_PROPERTY_DOUBLE, ENUM_CHART_PROPERTY_STRING
// Write properties via ChartObject.SetProperty
ChartObject.SetProperty(OBJPROP_XDISTANCE, exX); // Distance in pixels along the X axis from the snap angle
ChartObject.SetProperty(OBJPROP_YDISTANCE, exY); // Distance in pixels along the Y axis from the snap angle
ChartObject.SetProperty(OBJPROP_XSIZE, exWidth); // Width of the object along the X axis in pixels.
ChartObject.SetProperty(OBJPROP_YSIZE, exHeight); // Height of the object along the Y axis in pixels.
ChartObject.SetProperty(CHART_SHOW_GRID, exShowGrid); // Display the grid on the graph
ChartObject.SetProperty(CHART_COLOR_BACKGROUND, exColorBackGround); // The background colour of the chart
ChartObject.SetProperty(CHART_SHOW_TRADE_LEVELS, exTradeLevels); // Display trading levels (levels of open positions, Stop Loss, Take Profit and pending orders) on the chart
ChartObject.SetProperty(OBJPROP_PRICE_SCALE, exPriceScale); // Sign of price scale display for the "Chart" object
#define TOSTRING(A) #A + " = " + (string)(A)
// Read properties via ChartObject.GetProperty
Print(TOSTRING(ChartObject.GetProperty(OBJPROP_XDISTANCE)));
Print(TOSTRING(ChartObject.GetProperty(CHART_COMMENT)));
}
void OnDeinit( const int Reason )
{
delete ChartObject; // Delete the graphic object
}
void OnChartEvent( const int id, const long& lparam, const double& dparam, const string& sparam )
{
EVENTBASE::MyEvent(id, lparam, dparam, sparam); // Need for object interactivity
}
void OnTimer( void )
{
EVENTBASE::MyEventTimer(); // Need for object interactivity
}
void OnTick( void )
{
EVENTBASE::MyEventTick(); // Need for object interactivity
}
Crosshair and blue and red lines are superfluous at all, they only distract.
To disable lines and text, you need to find a function in the sources
{
if (this.GetProperty(CHART_WIDTH_IN_PIXELS) == 0)
return;
const ulong TimeCross = (ulong)(this.Ticks.GetTime() + this.Ticks.GetInterval() *
((double)(X - (int)CHARTOBJECT::GetProperty(OBJPROP_XDISTANCE) - OBJ_CHART_BORDER_SIZE) /
this.GetProperty(CHART_WIDTH_IN_PIXELS) - 0.5));
this.TextCross.SetProperty(OBJPROP_TIME, (int)this.VLineCross.GetProperty(OBJPROP_TIME));
this.TextCross.SetProperty(OBJPROP_PRICE, this.GetProperty(CHART_PRICE_MIN));
this.TextCross = CHARTOBJECT::TimeToString(TimeCross);
this.SetTextPrices(TimeCross, Y);
return;
}
and comment out its body.
{
/* if (this.GetProperty(CHART_WIDTH_IN_PIXELS) == 0)
return;
const ulong TimeCross = (ulong)(this.Ticks.GetTime() + this.Ticks.GetInterval() *
((double)(X - (int)CHARTOBJECT::GetProperty(OBJPROP_XDISTANCE) - OBJ_CHART_BORDER_SIZE) /
this.GetProperty(CHART_WIDTH_IN_PIXELS) - 0.5)));
this.TextCross.SetProperty(OBJPROP_TIME, (int)this.VLineCross.GetProperty(OBJPROP_TIME));
this.TextCross.SetProperty(OBJPROP_PRICE, this.GetProperty(CHART_PRICE_MIN));
this.TextCross = CHARTOBJECT::TimeToString(TimeCross);
this.SetTextPrices(TimeCross, Y);
*/.
return;
}
To disable crosshairs, you need to find the lines
this.VLineCross = time;
and comment them out
// this.VLineCross = time;
The only advantage of "zoomprice" it seems to be faster than "fxsaber".
ZoomPrice can be a great addition to Ticks - it allows you to drill down into what Ticks is showing. After writing ZoomPrice, I stopped using Ticks myself.

- votes: 19
- 2016.10.14
- //www.mql5.com/ru/users/fxsaber">
- www.mql5.com
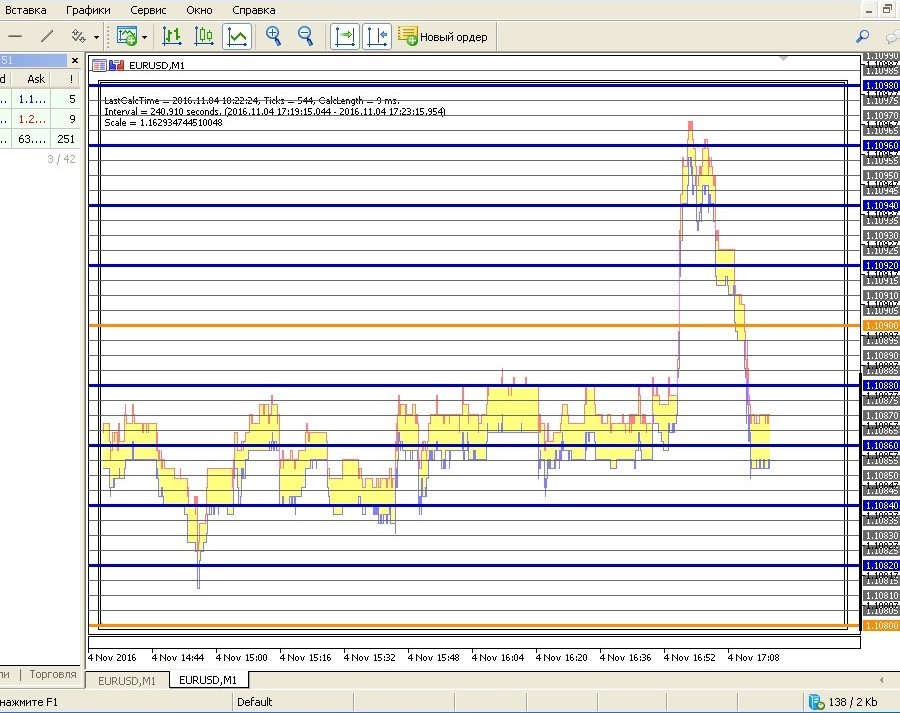
Here is an example
I need to overlay another grid indicator on top of the ZoomPrice indicator to visually determine how many pips the price has travelled. Between neighbouring blue lines 40 pips, between neighbouring orange lines 200 pips. I don't need any crosshairs, just grid levels that are tied to the scale. One glance is enough to assess the situation. And the orange lines in the grid are round numbers of the chart, if the line is at the chart value of 1.10900, then no matter how we change the scale, the line will not change its value. 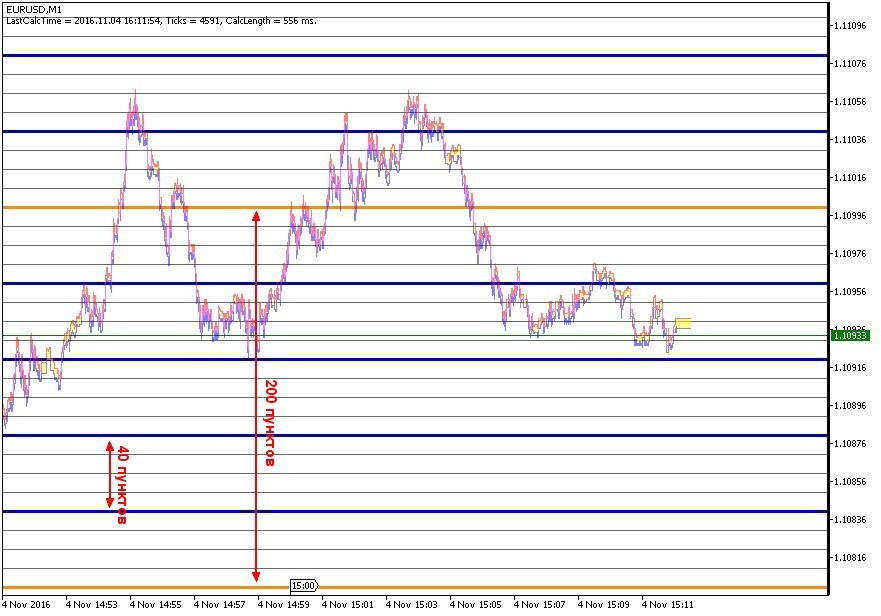
I tried to put a grid indicator on top of ZoomPrice and link the lines to the scale, nothing worked. I have little understanding of code.
I commented out all the unnecessary things, now it's left to make the grid and it will be perfect.
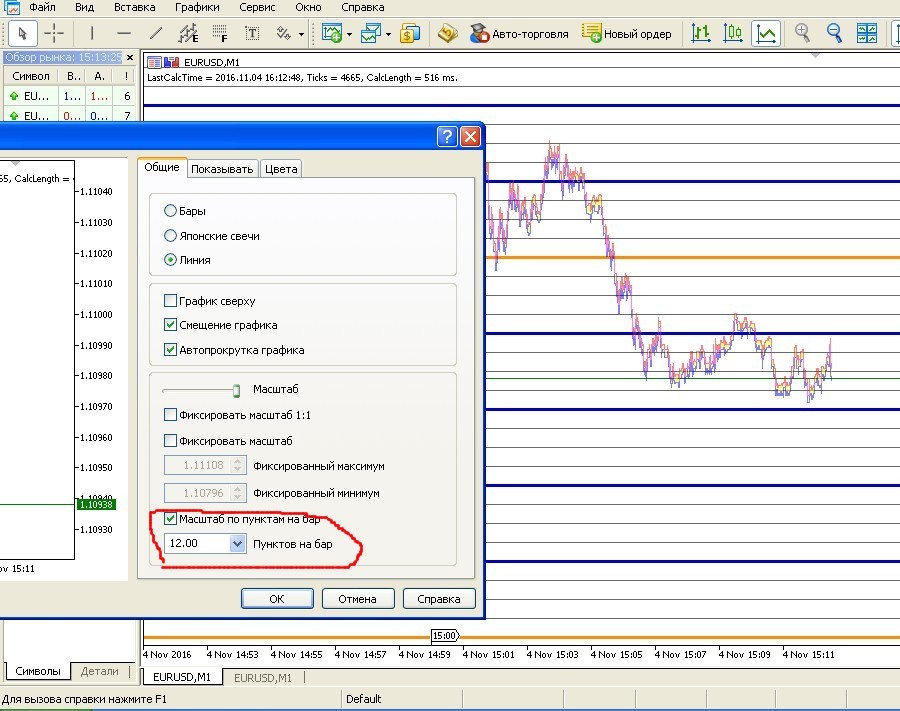
The scale by points per bar is set in the tab: properties>>general
I tried overlaying a grid indicator on top of ZoomPrice and linking the lines to the scale, nothing worked. I'm not very good at code.
I commented out all the unnecessary things, now I just need to make a grid and it will be perfect.
You can make a horizontal grid by hanging a corresponding indicator on this graphical object. But this, let's say, is not trivial for a person who doesn't understand code.
The scale by points per bar is set in the tab: properties>>general
ZoomPrice is the only indicator in the 16-year history of MQ that allows you to make ANY level of scale. That is, not six clearly defined scales, but whatever you want. This required some non-standard solutions (this is the reason why the object does not have a horizontal scale). And it is because of these non-standard solutions that ZoomPrice has some limitations that do not allow certain types of indicators to be overlaid on the object (this does not apply to the horizontal grid). And setting a different kind of zoom is something I have to think about. I still haven't understood what "scale by points per bar" is, even after reading the Help.
In fact, without understanding it yourself, you have touched upon the topic of correct behaviour of indicators. Because of the possible presence of OBJ_CHART objects, you can throw an indicator not on the chart itself, but on the OBJ_CHART object. And it is logical in this case to run the indicator exactly on OBJ_CHART, not on the main chart.
Please provide a link to an indicator with a horizontal grid. Let's see what you can come up with.
Send me a link to an indicator with a horizontal grid. Let's see what we can come up with.
- votes: 17
- 2016.02.29
- Nikolay Kositsin
- www.mql5.com
- Free trading apps
- Over 8,000 signals for copying
- Economic news for exploring financial markets
You agree to website policy and terms of use
ZoomPrice tick indicator:
The indicator shows the price chart of any scaling level.
Author: fxsaber