Forecast and levels for Dow Jones Industrial Average
Forum on trading, automated trading systems and testing trading strategies
Sergey Golubev, 2016.12.29 07:51
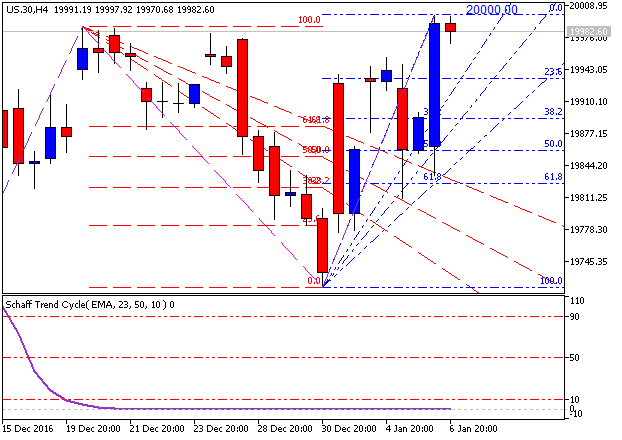
Dow Jones Industrial Average Intra-Day Tecgnicals (based on the article)
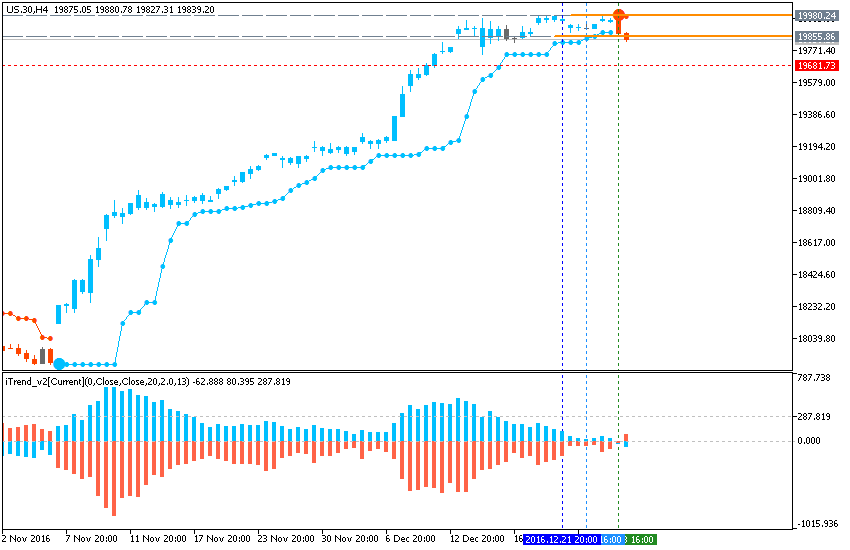
"Based on the consolidation that began December 14, it does appear as though DJIA may dip slightly to finish the consolidation pattern. A dip appears poised to move towards 19,750-19,840. At this point, we do not think it will extend much, but could work its way back down towards 19,000-19,250. The medium term pattern does appear incomplete to the upside. Therefore, we anticipate the dips would be supported near one of the previously cited levels."
- "If price moves below 19,000 it may become an early warning signal that another pattern is at play and we will have to reassess the wave relationships. Below 18,600 we will abandon the pattern altogether."
- "If prices are supported and move higher, the next level of wave relationships show up near 21,378. It would take a successful breakout above 20,000 for us to consider focusing on the higher level."
Forum on trading, automated trading systems and testing trading strategies
Sergey Golubev, 2017.01.05 17:42
Intra-Day Fundamentals - EUR/USD, AUD/USD and DJIA: ISM Non-Manufacturing PMI
2017-01-05 15:00 GMT | [USD - ISM Non-Manufacturing PMI]
- past data is 57.2
- forecast data is 56.6
- actual data is 57.2 according to the latest press release
if actual > forecast (or previous one) = good for currency (for USD in our case)
[USD - ISM Non-Manufacturing PMI] = Level of a diffusion index based on surveyed purchasing managers, excluding the manufacturing industry.
==========
From official report:
"The report was issued today by Anthony Nieves, CPSM, C.P.M., CFPM, chair of the Institute for Supply Management® (ISM®) Non-Manufacturing Business Survey Committee. "The NMI® registered 57.2 percent in December, matching the November figure. This represents continued growth in the non-manufacturing sector at the same rate. The Non-Manufacturing Business Activity Index decreased to 61.4 percent, 0.3 percentage point lower than the November reading of 61.7 percent, reflecting growth for the 89th consecutive month, at a slightly slower rate in December."
==========
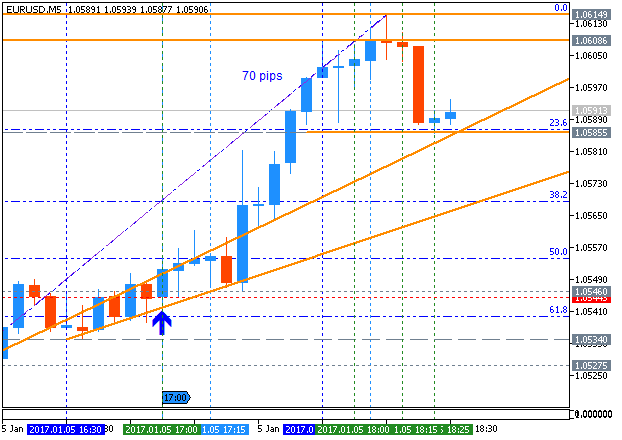
EUR/USD M5: 70 pips range price movement by ISM Non-Manufacturing news events
==========
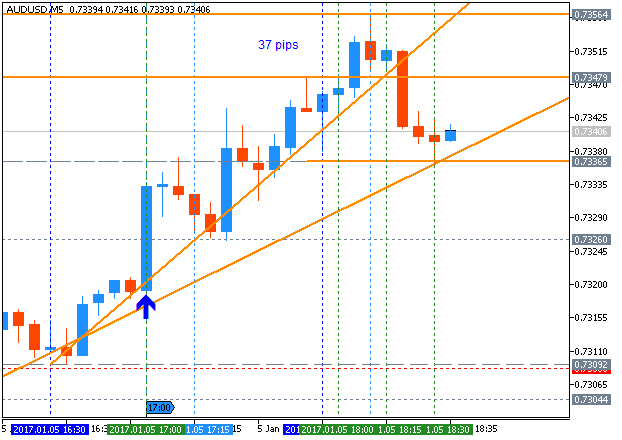
AUD/USD M5: 37 pips range price movement by ISM Non-Manufacturing news events
==========
Dow Jones Industrial Average: pips range price movement by ISM Non-Manufacturing news events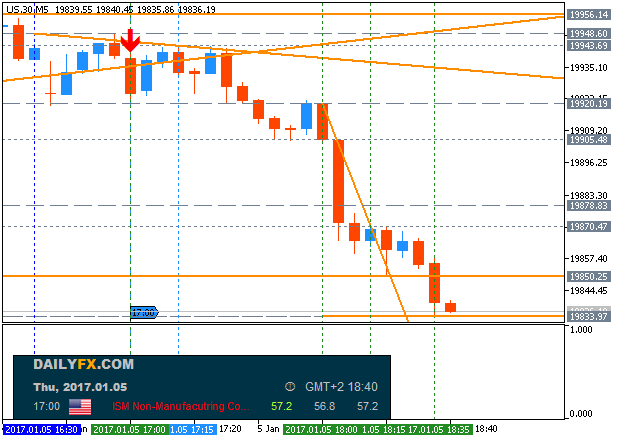
Forum on trading, automated trading systems and testing trading strategies
Sergey Golubev, 2017.01.06 11:11
Nasdaq Hits New High as Dow, S&P 500 Slip (based on the article)
"The S&P 500 dipped 0.1% to 2,269.00 today, while the Dow Jones Industrial Average declined 42.87 points, or 0.2%, to 19,899.29. The Nasdaq Composite rose 0.2% to 5,487.94, a new record."
Dow Jones Industrial Average: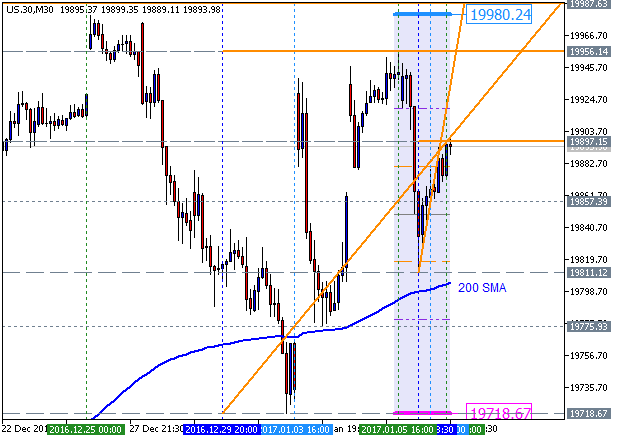
S&P 500:
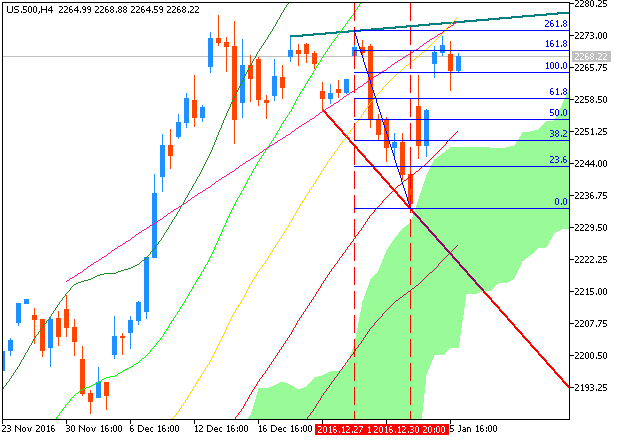
"The S&P 500 reached new all-time highs in December and then moved horizontally on lighter volume as the holiday period approached. The S&P 500 reached overbought status on some oscillators in early December and both its internal momentum and the number of NYSE stocks making new 52-week highs pulled back markedly towards year-end. Equity put/call ratios (a contrary indicator) and bullish prognosticator show rising optimism and the percentage of NYSE stocks trading above their respective 50-day Moving Averages were at 67% at year-end (courtesy of Investors Intelligence). With the S&P 500 near its all-time highs, these negative divergences suggest a correction."
Forum on trading, automated trading systems and testing trading strategies
Sergey Golubev, 2017.01.08 13:44
What should you do when the Dow hits 20,000? (based on the article)
"The Dow Jones industrial average failed yet again last week to clear the magic 20,000 mark, but it will someday."
Rebalance your portfolio. "As stocks have increased in value, you may find your portfolio a bit out of whack. A portfolio that consisted of 60% stocks and 40% bonds a couple years ago, may very well consist of 70% stocks and 30% bonds today. Rebalancing can help realign your holdings and lessen risk. Much like you check a carton of eggs for cracks in the store before you buy them — you need to lift open the carton on your portfolio and check for any cracks or changes."
Manage risk. "When the market is on the escalator up, it’s easy to forget that the market can also fall in an instant, without any warning. Don’t let your emotions trick you into taking on more risk just because the recent stock market performance has been favorable. Stick to your long-term plan, even though it may be tempting to chase good short-term performance."
Remain diversified. "Although the U.S stock market is hovering around all-time highs, international and emerging markets are not. For the fourth consecutive year, U.S. stocks outperformed both international and emerging markets. It is important to stay diversified and to not become an investing homebody. Oftentimes the world markets are a seesaw — with one side up and one side lower."
Don’t panic. "Many investors seem to panic more when the market is at a high than when the market is at a low. The “should I just go to cash now” question can begin to creep into our heads."
Appreciate the appreciation. "If charitable giving is a goal of yours, take a look at any appreciated securities in your portfolio to accomplish your giving plans. Gifting highly appreciated securities may be a good way to support your favorite charity while receiving a higher tax benefit in the process."Forum on trading, automated trading systems and testing trading strategies
Sergey Golubev, 2017.01.16 09:13
3 Things to Watch in the Stock Market This Week (based on the article)
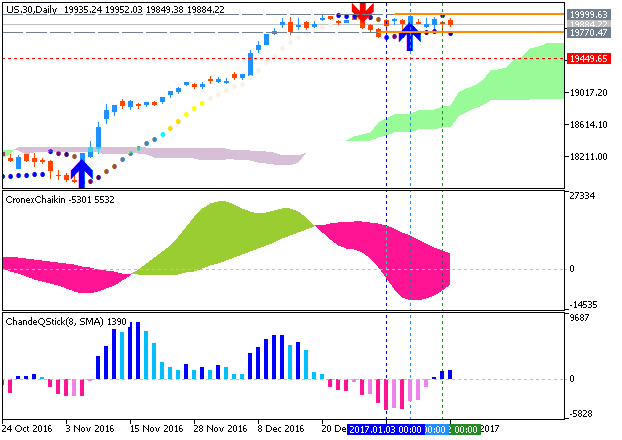
- "Stocks posted another week of gains last week. And even though the Dow Jones Industrial Average never cracked the 20,000 point level, it and the S&P 500 index ticked higher to keep firmly in rally mode."
Dow Jones Industrial Average, Daily Chart: the price is testing 19,999 resistance level for the bullish trend to be continuing.
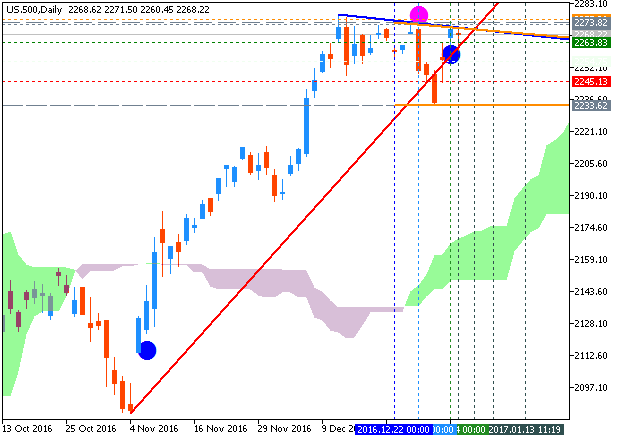
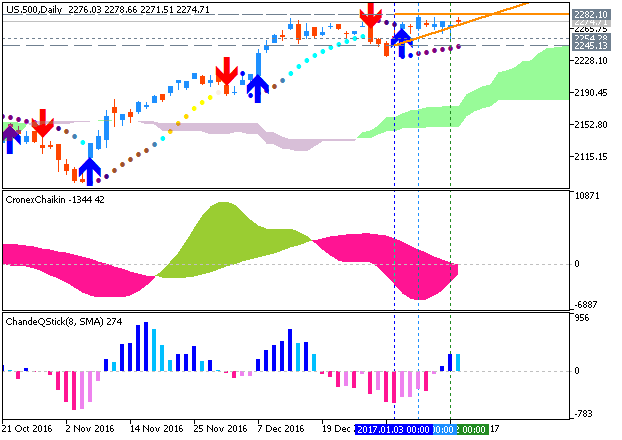
S&P 500, Daily Chart: the price is testing 2,282 resistance level for the bullish trend to be continuing.
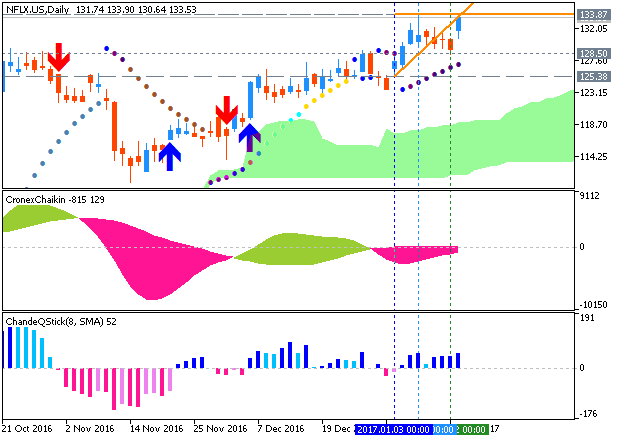
- "The week ahead could bring big portfolio swings for shareholders of Netflix, CSX, and General Electric, as the companies will post highly anticipated earnings announcements over the next few trading days."
Netflix, D1 Chart: daily share price is on bullish breakout for the testing resistance level at 133.87 to above for the bullish trend to be continuing:
Forum on trading, automated trading systems and testing trading strategies
Sergey Golubev, 2017.01.20 19:17
The major indices were each up about 0.2% as the day's ceremonies and inauguration speech were underway (based on the article)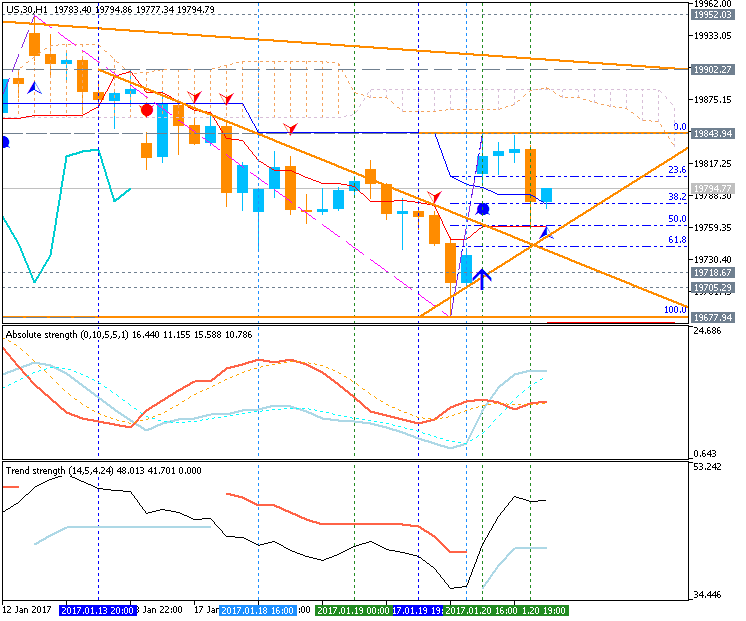
- "The major indices were each up about 0.2% as the day's ceremonies and inauguration speech were underway. The minor gains were not enough to push the Dow, at 19,785, above the long-awaited 20,000 level."
----------------
S&P 500 rised from 2,258 support level to above for the resistance level at 2,277 to be testing for the bullish trend to be continuing. By the way, the secondary ranging condition to be started for the price to be waiting for the directionof the trend.
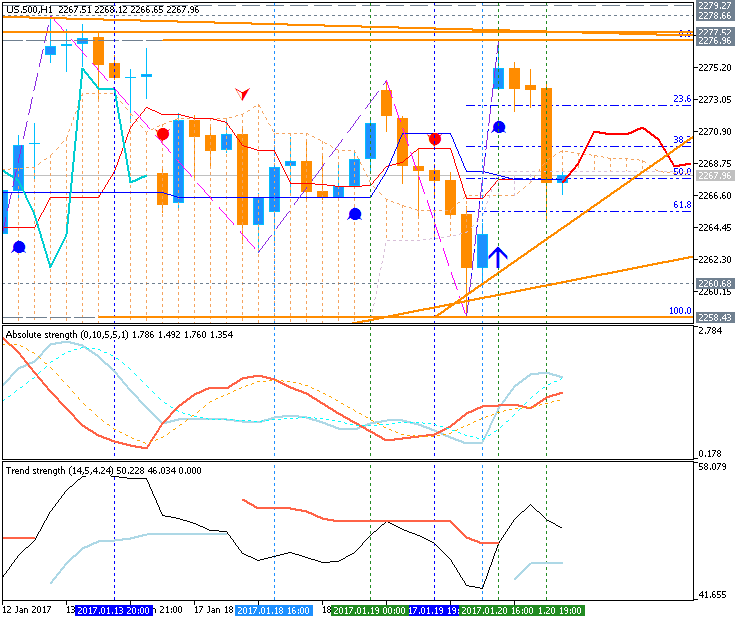
- "The stock market has enjoyed a broad-based rally since Trump was elected, with the S&P 500 adding 5% and the Dow adding 1,000 points since November. The investor excitement has been fueled by expectations that regulations will be scaled back, taxes will be lowered and fiscal spending will rise."
Forum on trading, automated trading systems and testing trading strategies
Sergey Golubev, 2017.01.23 17:49
How To Trade Nike (NKE) In 2017 (based on the article)
"The Dow Jones Industrial Average is up just 0.3% year-to-date. Bucking the sideways-to-down trend are gains between 3.6% and 6.2% for Apple, Merck, Nike, Procter & Gamble and Visa."
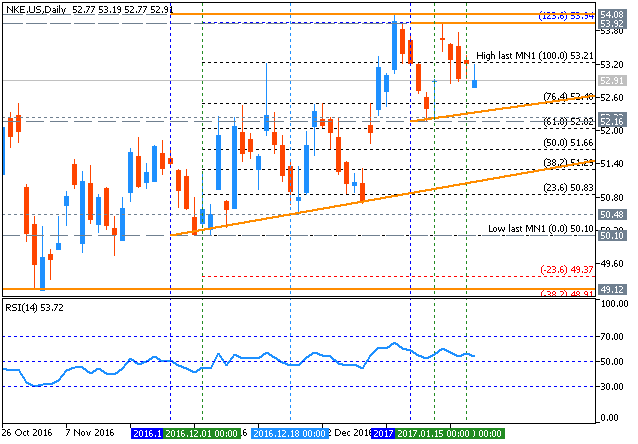
- "Nike (NKE) closed at $53.20 last week, up 4.7% year-to-date and up 8.5% from its Nov. 2, 2016 low of $49.01. The stock remains in bear market territory, 22% below its all-time intraday high of $68.19 set on Dec. 23, 2015."
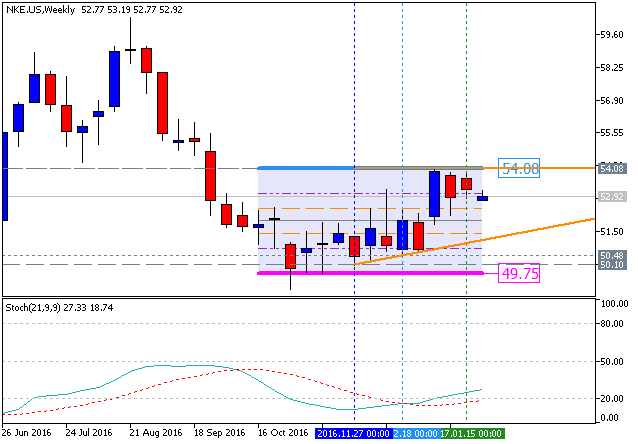
- "Nike's weekly chart remains positive with the stock above its five-week modified moving average of $52.35 and well above its 200-week simple moving average of $47.34. The stock’s 12x3x3 weekly slow stochastic reading ended last week at 65.21, up from 55.17 on Jan. 13."
- "Investors looking to buy Nike should do so on weakness to $47.31, which is my monthly value level. Investors looking to reduce holdings should do so on strength to $62.65 and $62.85, which are annual and quarterly risky levels, respectively."
Forum on trading, automated trading systems and testing trading strategies
Sergey Golubev, 2017.01.29 08:17
Markets To Watch In The Week Ahead: Dow Jones Industrial Average (based on the article)
DJIA daily is testing 20,125 resistance level together with ascending triangle pattern to above for the primary bullish market condition to be continuing.
- "The Dow ended the week well above 20,000 as investors bet on the pro-growth policies of President Trump and continue to push stocks to new heights."
Forum on trading, automated trading systems and testing trading strategies
what is your forecast for Dow-jones .. will reach the 20,000 again ???
Basheer Shaheen, 2017.01.31 09:24
what is your forecast for Dow-jones .. will reach the 20,000 again ???
Forum on trading, automated trading systems and testing trading strategies
Sergey Golubev, 2017.02.14 16:04
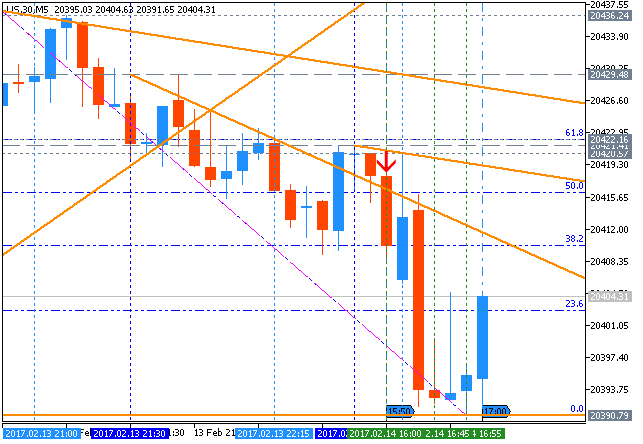
Intra-Day Fundamentals - Dow Jones Industrial Average: U.S. Producer Price Index
2017-02-14 13:30 GMT | [USD - PPI]
- past data is 0.3%
- forecast data is 0.3%
- actual data is 0.6% according to the latest press release
if actual > forecast (or previous one) = good for currency (for USD in our case)
[USD - PPI] = Change in the price of finished goods and services sold by producers.
==========
From official report:
- "The Producer Price Index for final demand increased 0.6 percent in January, seasonally adjusted, the U.S. Bureau of Labor Statistics reported today. Final demand prices rose 0.2 percent in December and 0.5 percent in November. On an unadjusted basis, the final demand index climbed 1.6 percent for the 12 months ended January 2017."
==========
DJIA M5: range price movement by U.S. Producer Price Index news events
- Free trading apps
- Over 8,000 signals for copying
- Economic news for exploring financial markets
You agree to website policy and terms of use
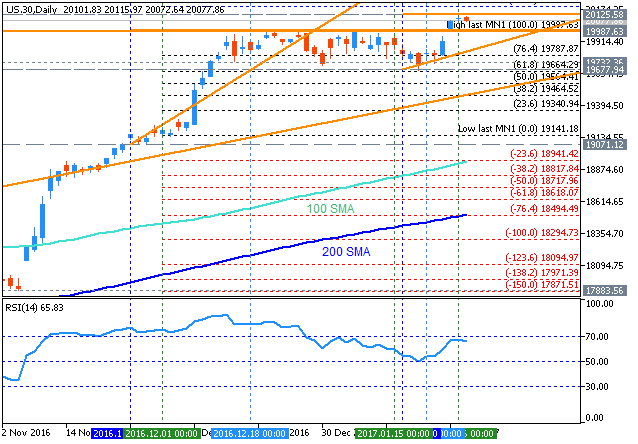
DJIA January-March 2017 Forecast: long-term bullish; resistance level at 19,987 is the key
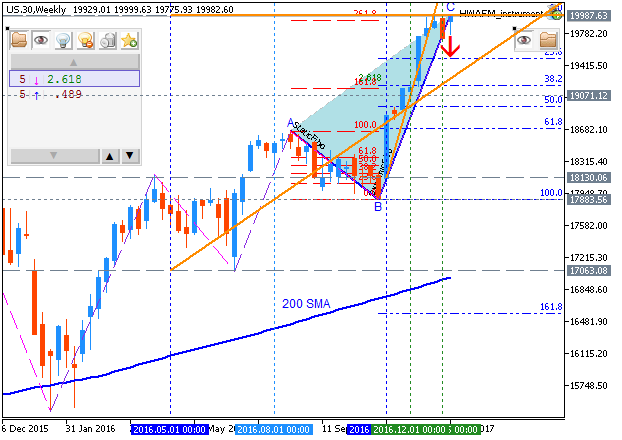
W1 price is located above Ichimoku cloud in the bullish area of the chart: the price is on testing 19,987 resistance lkevel to above for the primary bullish market condition to be continuing. The price is located within the following support/resistance levels:
- 19,987 resistance level located above Ichimoku cloud in the bullish trend to be resumed, and
- 19,225 support level located in the beginning of the correction to be started.
Chinkou Span line is located above the price indicating the ranging condition in the future, Trend Strength indicator is estimating the trend as the primary bullish, and Absolute Strength indicator is evaluating the future trend to be ranging bullish. Tenkan-sen line is above Kijun-sen line for the bullish trend to be resumed.Trend:
W1 - bullish