Press review - page 170
You are missing trading opportunities:
- Free trading apps
- Over 8,000 signals for copying
- Economic news for exploring financial markets
Registration
Log in
You agree to website policy and terms of use
If you do not have an account, please register
Audio - Weekend Edition with John O'Donnell
May ended on a sweet note with all 4 major market indexes finishing up for the month. Will that continue in June? John O’Donnell joins Merlin for a big announcement about an upcoming event where Power Trading Radio will be broadcasting live with a ton of great speakers! John and Merlin also discuss the importance of metals and where the trading opportunities may lie.
if actual > forecast = good for currency (for AUD in our case)
AUD - Retail Sales = Change in the total value of sales at the retail level. It's the primary gauge of consumer spending, which accounts for the majority of overall economic activity
==========
Australia Retail Sales Gain 0.2% In April
Retail sales in Australia added a seasonally adjusted 0.2 percent on month in April, the Australian Bureau of Statistics said on Tuesday - coming in at A$23.168 billion.
That missed forecasts for an increase of 0.3 percent following the 0.1 percent gain in March.
Among the individual components of the survey, food retailing was up 0.3 percent, along with household goods retailing (0.6 percent), cafes, restaurants and takeaway food services (0.7 percent) and other retailing (0.2 percent).
Department store retail was relatively unchanged (0.0 percent), while clothing, footwear and personal accessory retailing fell 0.1 percent.
By region, retail sales in New South Wales added 0.7 percent, followed by Victoria (0.5 percent), Queensland (0.2 percent), Tasmania (0.3 percent) and the Northern Territory (0.4 percent).
Sales in Western Australia (-0.2 percent), the Australian Capital Territory (-0.7 percent) and South Australia (-0.1 percent) were down.
Also on Tuesday, the ABS said that Australia saw a current account deficit of A$5.67 billion in the first quarter of 2014 - up 52 percent on quarter.
That beat forecasts for a shortfall of A$7.0 billion following the downwardly revised deficit of A$11.7 billion in Q4 (originally a deficit of A$10.1 billion).
Exports of goods and services gained A$4.959 billion (6 percent) and imports of goods and services added A$759 million (1 percent). The primary income deficit fell A$1.811 billion (17 percent).
In seasonally adjusted, the net goods and services surplus surged A$5.315 billion (54 percent) to A$15.118 billion in Q1.
Net exports of GDP climbed 1.4 percent - beating forecasts for 0.80 and up from 0.60 in the previous three months.
Australia's net international investment liability position was A$850.4 billion, an increase of A$11.9 billion from Q4. Australia's net foreign debt liability fell A$3.2 billion to a net liability position of A$855.6 billion. Australia's net foreign equity shed A$15.1 billion to a net asset position of A$5.2 billion.
if actual < forecast = good for currency (for EUR in our case)
EUR - Spanish Unemployment Change = Change in the number of unemployed people during the previous month. Although it's generally viewed as a lagging indicator, the number of unemployed people is an important signal of overall economic health because consumer spending is highly correlated with labor-market conditions
==========
if actual > forecast = good for currency (for EUR in our case)
[EUR - CPI] = Change in the price of goods and services purchased by consumers. Consumer prices account for a majority of overall inflation. Inflation is important to currency valuation because rising prices lead the central bank to raise interest rates out of respect for their inflation containment mandate
==========
Eurozone Inflation Slows More Than Forecast
Eurozone inflation slowed more than expected in May, raising concerns about deflationary pressures.
Inflation fell to 0.5 percent in May from 0.7 percent in April, flash estimates published by Eurostat showed Tuesday. The rate was forecast to ease marginally to 0.6 percent.
Inflation held below the European Central Bank's target of 'below, but close to 2 percent' for the sixteenth consecutive month.
Excluding food, alcohol and tobacco, core inflation slowed to 0.7 percent from 1 percent a month ago.
Energy prices remained flat after declining 1.2 percent in April. Cost of services advanced 1.1 percent, slower than the 1.6 percent increase seen in the previous month. Food, alcohol and tobacco prices gained only 0.1 percent.
if actual > forecast = good for currency (for USD in our case)
[USD - Factory Orders] = Change in the total value of new purchase orders placed with manufacturers. It's a leading indicator of production - rising purchase orders signal that manufacturers will increase activity as they work to fill the orders.
==========
U.S. Factory Orders Rise 0.7% In April, More Than Expected
New orders for U.S. manufactured goods rose by more than expected in the month of April, according to a report released by the Commerce Department on Tuesday.
The report said factory orders increased by 0.7 percent in April after jumping by an upwardly revised 1.5 percent in March.
Economists had expected orders to climb by about 0.5 percent compared to the 1.1 percent increase that had been reported for the previous month.
The Commerce Department said factory orders increased for the third consecutive month, rising to their highest level since the series was first published on a NAICS basis in 1992.
The continued growth was partly due to an increase in orders for transportation equipment, which rose by 1.4 percent in April after surging up by 5.2 percent in March.
Excluding the increase in orders for transportation equipment, factory orders still rose by 0.5 percent in April compared to a 0.8 percent increase in the previous month.
Meanwhile, the report showed that factory orders edged down by 0.1 percent in April when excluding a jump in orders for defense.
The Commerce Department said orders for durable goods increased by a revised 0.6 percent in April compared to the 0.8 percent growth that was reported last Tuesday. Orders for non-durable goods rose by 0.7 percent.
The report also showed that shipment of manufactured goods edged up by 0.3 percent in April, while inventories of manufactured goods rose by 0.4 percent.
With inventories and shipments both rising, the inventories-to-shipments ratio was unchanged compared to the previous month at 1.30.
EURUSD: "Sell the Rumor, Buy the News" Reaction to ECB? (adapted from fxstreet article)
It seems like the only topic on forex traders’ minds this week is Thursday’s European Central Bank announcement. Since last month’s hint of future action from ECB President Mario Draghi, the market has grown more and more convinced that the ECB will not only cut its main interest rate on Thursday, but also take nonconventional actions to try to stave off deflation. We’ll have a full ECB preview up tomorrow, but for now we’d like to set the scene from a sentiment and positioning perspective.
Beyond the traditional dichotomy between technical and fundamental analysis, one oft-overlooked aspect of a currency’s value is traders’ sentiment and positioning. When traders are overly optimistic on a certain currency pair, it often falls despite typically bullish fundamental and technical events. Likewise, when traders become excessively pessimistic on an instrument, it may rally regardless of the fundamental or technical developments because there’s “no one left to sell.” The most reliable way to see how the market is positioned is through the CFTC’s Commitment of Traders report, which shows whether various types of traders have bought or sold different currency pairs. A chart of the most recent COT data (from last Tuesday) is shown below:
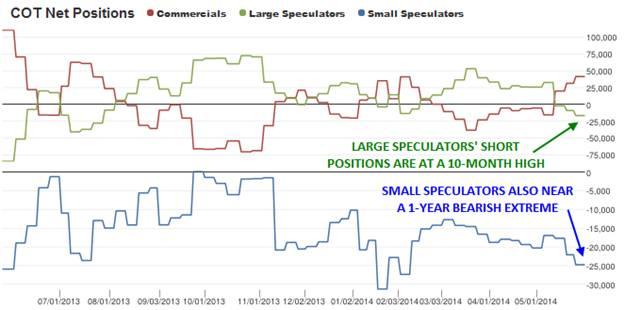
“Commercial traders,” shown in red below, are typically large companies trying to hedge their currency risk, and as a result, they are not interested in making money trading. For this reason, the large (green) and small (blue) speculators give the most reliable indication of how active, profit-driven traders are positioned. Looking at the current data shows that these traders are nearing bearish extremes on the EUR/USD heading into Thursday’s ECB meeting: large speculators are currently net short the EUR/USD to the tune of 17,000 futures contracts, the most bearish reading since August 2013, while small speculators are net short almost 25,000 contracts, also near 1-year lows.
This extreme bearish positioning suggests that many traders have already sold the EUR/USD in anticipation of bold action by the ECB on Thursday. Paradoxically, this suggests that even if the ECB fulfills expectations by cutting its main interest rate by a token amount and reducing its deposit rate to negative levels, the EUR/USD could actually bounce in a classic “sell the rumor, buy the news” dynamic. At this point, the ECB may have to reach for its “Big Bazooka” – Quantitative Easing – to truly elicit more weakness in the EUR/USD.
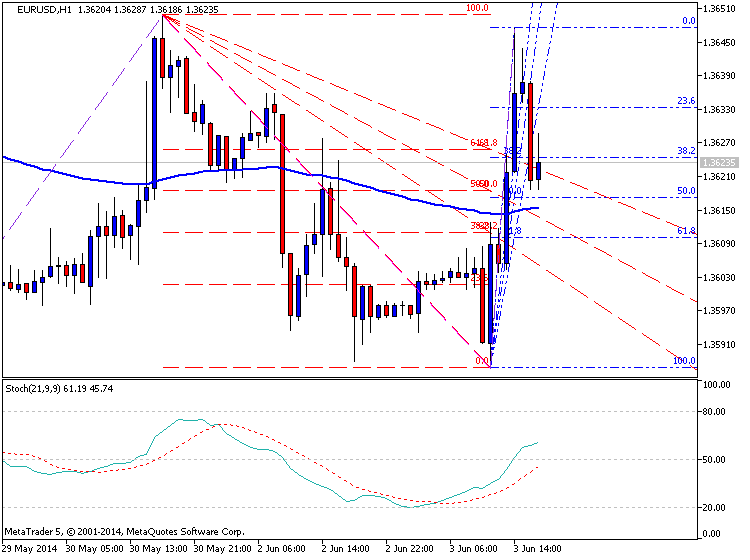
We saw an instructive example of this phenomenon earlier today with the release of the eurozone CPI, which printed at just 0.5% vs. expectations of a 0.7% rise. With the ECB’s laser-like focus on inflation of late, this weak report increases the likelihood of bold action by the central bank. However, the EUR/USD has actually spiked 50 pips higher since the report (see chart below), suggesting that euro shorts may be simply overextended and exhausted.
In the short term, the pair may remain trapped within its recent range between 78.6% daily Fibonacci retracement support at 1.3587 and previous-support-turned-resistance at 1.3650 ahead of the ECB’s decision. However, the EUR/USD may be primed for a bounce later this week unless the traditionally-conservative ECB can break its mold with truly bold action on Thursday.
if actual > forecast = good for currency (for AUD in our case)
[AUD - GDP] = Change in the inflation-adjusted value of all goods and services produced by the economy. It's the broadest measure of economic activity and the primary gauge of the economy's health.
==========
Australia Q1 GDP Climbs 1.1% On Quarter
Australia's gross domestic product expanded a seasonally adjusted 1.1 percent on quarter in the first three months of 2014, the Australian Bureau of Statistics said on Wednesday.
That beat forecasts for an increase of 0.9 percent following the 0.8 percent gain in the fourth quarter of 2013.
On a yearly basis, GDP climbed 3.5 percent - also topping expectations for a rise of 3.2 percent and up from 2.8 percent in the three months prior.
The terms of trade decreased 1.2 percent on quarter and 3.8 percent on year.
Real gross domestic income increased 0.8 percent, while disposable income added 1.3 percent on quarter and 2.2 percent on year.
The contributors to the increase in expenditure on GDP were net exports (1.4 percentage points), final consumption expenditure (0.3 percentage points) and private gross fixed capital formation (0.2 percentage points). The main detractor was changes in inventories (-0.6 percentage points).
The main contributors to GDP were mining (up 8.6 percent), financial and insurance services (up 2.8 percent) and construction (up 3.0 percent).
Mining contributed 0.9 percentage points to the increase in GDP while financial and insurance services and construction each contributed 0.2 percentage points.
Upon the release of the data, the Australian dollar strengthened against major currencies, trading near 0.9296 against the U.S. dollar, 95.40 against the yen, 1.0155 against the Canadian dollar, 1.4637 against the euro and 1.1023 against the kiwi.
Also on Wednesday, Australia's service sectors improved in May to be just barely in contraction, the latest survey from the Australian Industry Group revealed on Wednesday.
AiG's performance of service index came in with a score of 49.9 - up sharply from 48.6 in April but still just barely below the reading of 50 that separates expansion from contraction in a sector.
Among the individual components of the survey, growth in the sector was confined to health and community services, finance and insurance, and personal and recreational services during May.
But wholesale trade, employment and retail trade were lower.
if actual > forecast = good for currency (for EUR in our case)
[EUR - Spanish Services PMI] = Level of a diffusion index based on surveyed purchasing managers in the services industry. It's positively correlated with interest rates - early in the economic cycle an increasing supply of money leads to additional spending and investment, and later in the cycle expanding money supply leads to inflation.
==========
Spanish Service Sector Activity Rises At A Slower Rate In May
Spanish service sector activity continued to rise in May, though at a slower rate, the results of a survey by Markit Economics showed Wednesday.
The service sector business activity index fell to 55.7 in May from 56.5 in April. The index was also below the consensus estimate that called for a reading of 56.1. Nevertheless, this marked the seventh consecutive month of expansion.
Among the sub-sectors, the biggest expansion was seen at post and telecommunications and financial intermediation companies
Staffing levels rose for the second consecutive month, marking the first instance of back-to-back rises in employment since early 2008, though at a moderate rate. Due to weak job creation and strong growth of new orders, backlogs of work rose for the fourth consecutive month.
New orders rose sharply in May and a general improvement in market conditions was reported.
Input cost inflation remained weaker than the series average. However, among the sub-sectors, input costs at hotels and restaurants rose sharply, diverging from the general trend.
Output prices continued to remain low owing to competitive pressures. However, the pace of decrease slowed for the fifth straight month and was at its weakest since August 2008 when the current sequence of decline began.
Business sentiment remained positive in May, changing little from the previous month. The optimism is attributed to predictions of an ongoing economic recovery in Spain.
Forum on trading, automated trading systems and testing trading strategies
Indicators: Levels
newdigital, 2014.06.04 12:44
Gold Presses Fibonacci Wave Relationship
- Triangles are consolidation patterns that tend provide clean technical levels to trade from
- Gold may be nearing a bullish reaction point that offers a trading opportunity to buy
- Try trading gold in a practice demo account
Gold appears to be consolidating in a sideways triangle for the past 12 months. This is a big consolidation pattern that offers some trading opportunities inside the triangle.Look for the yellow metal to find support over the next several days and a potential $100 rise in the price of the gold.
The Anatomy of a Triangle
Triangles are consolidation patterns that allow prices to trade sideways in an effort to alleviate overbought and oversold pressures. In the case of gold, it has been working its way lower for the past three years and needs to consolidate those losses, which it has been doing in the triangle pattern.
Elliott Wave triangles are made up of five waves inside the triangle with each wave being contained inside the previous wave. In the idealized example above, notice how wave ‘B’ ends BEFORE the beginning of wave ‘A’. Notice how wave ‘C’ ends BEFORE the beginning of wave ‘B’. This continues until prices squeeze together in five waves (A-B-C-D-E) then they eventually explode.
In the same idealized example above, it appears gold is closing in on the end of the ‘D’ wave which should yield a bounce higher in wave ‘E’.
wave ending near $1235 per ounce. Both wave relationships are expressed through alternating waves having a fibonacci relationship in length.
First, inside the green ‘D’ wave, you’ll see we have a blue a-b-c sequence. Many times, the length of wave ‘c’ will have an equality or fibonacci relationship to the length of wave ‘a’. In the case for gold, the length of blue wave ‘c’ equals blue wave ‘a’ times 61.8% at $1235 per ounce.
Secondly, green wave ‘B’ and green wave ‘D’ are alternating waves. If you take the distance of green wave ‘B’ and multiply it by 61.8% and project it for a distance on green wave ‘D’, it yields a price target of $1235 per ounce.
So we have two different alternating waves pointing to the same price target. This means there will likely be a reaction higher near $1235. If $1235 does fail, look to $1190-$1200 providing significant support.
The price target to the upside in this scenario would be $1340-$1390. So there is enough room to the upside to position towards the long side of the trade.
if actual > forecast = good for currency (for EUR in our case)
[EUR - GDP] = Change in the inflation-adjusted value of all goods and services produced by the economy. There are 3 versions of GDP released about 20 days apart - Flash, Revised, and Final. The Flash release is the earliest and thus tends to have the most impact
==========
Eurozone Q1 GDP Growth Confirmed At 0.2%
The euro area economy grew as initially estimated in the first quarter, second estimate from Eurostat showed Wednesday.
Gross domestic product in the 18-nation currency bloc grew 0.2 percent sequentially, slower than the revised 0.3 percent expansion posted in the fourth quarter of 2013.
On a yearly basis, growth accelerated to 0.9 percent from 0.5 percent. Eurostat confirmed the preliminary estimates for the first quarter released on May 15.
On the expenditure side, household spending gained only 0.1 percent, while government expenditure grew 0.3 percent.
Investment advanced 0.3 percent versus a 0.9 percent rise in the previous quarter. The increase in exports eased sharply to 0.3 percent from 1.4 percent. On the other hand, imports growth rose marginally to 0.8 percent from 0.7 percent.