Press review - page 115
You are missing trading opportunities:
- Free trading apps
- Over 8,000 signals for copying
- Economic news for exploring financial markets
Registration
Log in
You agree to website policy and terms of use
If you do not have an account, please register
Trading the News: U.S. Durable Goods Orders (based on dailyfx article)
2013-03-26 12:30 GMT (or 13:30 MQ MT5 time) | [USD - Durable Goods Orders]
A 1.0% rebound in U.S. Durable Goods Orders may prompt a bullish reaction in the dollar as it raises the outlook for growth and inflation.
Why Is This Event Important:
Indeed, prospects for a stronger recovery may encourage the Federal Open Market Committee (FOMC) to normalize policy sooner rather than later, and we may see Fed Chair Janet Yellen continue to soften her dovish tone for monetary policy as a growing number of central bank officials see a stronger recovery in 2014.
However, the slowdown in private sector credit paired with the pullback in consumer confidence may generate a dismal release, and another decline in U.S. Durable Goods Orders may trigger a selloff in the greenback as it limits the Fed’s scope to remove the zero-interest rate policy (ZIRP) later this year or in early 2015.
How To Trade This Event Risk
Bullish USD Trade: Demands Increase 1.0% or Greater
- Need to see red, five-minute candle following the release to consider a long dollar trade
- If market reaction favors a short EURUSD position, sell pair with two separate position
- Set stop at the near-by swing high/reasonable distance from entry; look for at least 1:1 risk-to-reward
- Move stop to entry on remaining position once initial target is hit; set reasonable objective
Bullish USD Trade: Durable Goods Orders Disappoint- Need green, five-minute candle to favor a short dollar trade
- Implement same setup as the bullish USD trade, just in reverse
Potential Price Targets For The ReleaseDemands for large-ticket items decline another 1.0% in January following a revised 5.3% drop the month prior, while Non-Defense Capital Goods Orders excluding Aircrafts, a proxy for business investments, unexpectedly increased 1.7% amid forecasts for a 0.2% contraction. Nevertheless, the initial reaction to the data print was short-lived, with the EURUSD coming off of the 1.3650 region, and the reserve currency continued to lose ground throughout the North American trade as the pair closed at 1.3708.
Forum on trading, automated trading systems and testing trading strategies
Something Interesting in Financial Video February 2014
newdigital, 2014.02.10 11:15
06: DURABLE GOODS
This is the 6th video in a series on economic reports created for all markets, or for those who simply have an interest in economics. In this lesson we cover the Durable Goods report.
============
Previous parts:
============
Durable Goods OrdersDurable Goods Orders (DGO) is an indicator of orders placed for relatively long lasting goods. Durable goods are expected to last more than three years, e.g.: cars, furniture, appliances, etc.
This indicator is important for the market because it gives an idea of the consumers' confidence in the current economic situation. Since durable goods are expensive, the increase in the number of orders for them shows the willingness of consumers to spend their money on them. Thus, the growth of this indicator is a positive factor for economic development and leads to growth of the national currency.
============
USDJPY M5 : 47 pips price movement by USD - Durable Goods Orders news event
EURUSD M5 : 32 pips price movement by USD - Durable Goods Orders news event :
EURUSD Technical Analysis (based on dailyfx article)
An actionable short Euro trade setupin line with our long-term fundamental outlook remains elusive after an expected move lower the US Dollar. The spotlight is on support in the 1.3779-1.38 area, marked by the 38.2% Fibonacci retracement and a rising channel bottom set from late January. We will look for a daily close below this boundary to confirm reversal and position for selling opportunities. The break lower would initially expose the 50% level at 1.3721. Alternatively, a breach above the 23.6% Fib at 1.3850 would target recently broken rising trend line support-turned-resistance at 1.3876.
2013-03-26 03:30 GMT (or 04:30 MQ MT5 time) | [AUD - RBA Gov Stevens Speech]
Speech at the 17th Annual Credit Suisse Asian Investment Conference, in Hong Kong
==========
RBA Chief Sees Encouraging Signs Of Broader Private Demand Growth
Reserve Bank of Australia Governor Glenn Stevens said there is encouraging early evidence that the so-called 'handover' from mining-led demand growth to broader private demand growth is beginning.
He expects economic growth to continue and to strengthen a little later this year and pick up further during 2015.
"This outlook is, obviously, a balance between the large negative force of declining mining investment and, working the other way, the likely pick up in some other areas of demand helped by very low interest rates, improved confidence and so on, as well as higher resource shipments," central banker said.
RBA, in its biannual Financial Stability Report, cautioned that a cyclical upswing in housing prices when interest rates are low cannot continue indefinitely.
Although present conditions in the housing market are not assessed as posing a near-term risk to financial stability, the recent pick-up in momentum warrants close monitoring.
The bank advised investors and owner-occupiers not to base their decisions on an extrapolation of recent outcomes.
What is the ’Best’ Time Frame to Trade? (based on dailyfx article)
One of the most important aspects of a trader’s success is the approach being utilized to speculate in markets. Sometimes, certain approaches just don’t work for certain traders. Maybe its personality or risk characteristics; or perhaps the approach is just un-workable to begin with.
When using multiple time frame analysis, traders will look to use a longer-term chart to grade trends and investigate the general nature of the current technical setup; while utilizing a shorter-term chart to ‘trigger’ or enter positions in consideration of that longer-term setup. We looked at one of the more common entry triggers in the article, MACD as an Entry Trigger; but many others can be used since the longer-term chart is doing the bulk of the ‘big picture’ analysis
The Long-Term Approach
Optimal Time Frames: Weekly, and Daily Chart
For some reason, many new traders do everything they can to avoid this approach. This is likely because new, uninformed traders think that a longer-term approach means it takes a lot longer to find profitability.
In most cases, this couldn’t be further from the truth.
By many accounts, trading with a shorter-term approach is quite a bit more difficult to do profitably, and it often takes traders considerably longer to develop their strategy to actually find profitability.
There are quite a few reasons for this, but the shorter the term, the less information that goes into each and every candlestick. Variability increases the shorter our outlooks get because we’re adding the limiting factor of time.
There aren’t many successful scalpers that don’t know what to do on the longer-term charts; and in many cases, day-traders are using the longer-term charts to plot their shorter-term strategies.
All new traders should begin with a long-term approach; only getting shorter-term as they see success with a longer-term strategy. This way, as the margin of error increases with shorter-term charts and more volatile information, the trader can dynamically make adjustments to risk and trade management.
Traders utilizing a longer-term approach can look to use the weekly chart to grade trends, and the daily chart to enter into positions.
The ‘Swing-Trader’ Approach
Optimal Time Frames: Daily, and Four-Hour Charts
After a trader has gained comfort on the longer-term chart they can then look to move slightly shorter in their approach and desired holding times. This can introduce more variability into the trader’s approach, so risk and money management should absolutely be addressed before moving down to shorter time frames.
The Swing-Trader’s approach is a happy medium between a longer-term approach, and a shorter-term, scalping-like approach. One of the large benefits of swing-trading is that traders can get the benefits of both styles without necessarily taking on all of the down-sides.
Swing-Traders will often look at the chart throughout the day in an effort to take advantage of ‘big’ moves in the marketplace; and this affords them the benefit of not having to watch markets continuously while they’re trading. Once they find an opportunity or a setup that matches their criteria for triggering a position, they place the trade with a stop attached; and they then check back later to see the progress of the trade.
In between trades (or checking the chart), these traders can go about living their lives.
A large benefit of this approach is that the trader is still looking at charts often enough to seize opportunities as they exist; and this eliminates one of the down-sides of longer-term trading in which entries are generally placed on the daily chart.
For this approach, the daily chart is often used for determining trends or general market direction; and the four-hour chart is used for entering trades and placing positions.
The Short-Term Approach (Scalping or Day-Trading)
Optimal Time Frames: Hourly, 15 minutes, and 5 minutes
this is probably the most difficult way of finding profitability; and for the new trader, so many factors of complexity are introduced that finding success as a scalper or day-trader can be daunting.
The scalper or day-trader is in the unenviable position of needing the move(s) with which they are speculating to take place very quickly; and trying to ‘force’ a market to make a move isn’t usually going to work out that well. The shorter-term approach also affords a smaller margin of error. Since less profit potential is generally available, tighter stops need to be utilized; meaning failure will generally happen quite a bit more often, or else the trader is opening themselves up to The Number One Mistake that Forex Traders Make.
To trade with a very short-term approach, it’s advisable for a trader to first get comfortable with a longer-term, and swing-trading approach before moving down to the very fast time frames. But, once a trader is comfortable there, it’s time to start building out the strategy.
Scalpers can look to the hourly chart to grade trends, and the 5 or 15 minute charts for entries
AUDUSD Technical Analysis (based on dailyfx article)
Talking Points:
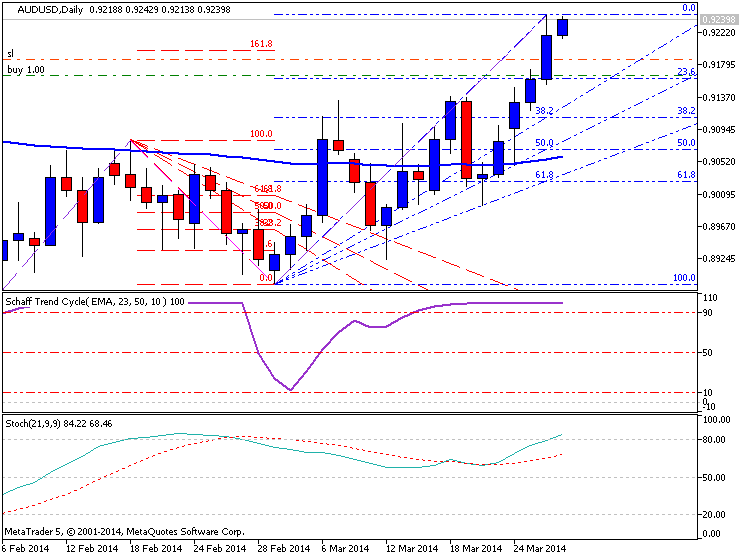
The Australian Dollar continued to push higher against its US counterpart for a fourth consecutive day, taking out resistance at 0.9177 marked by the 38.2% Fibonacci expansion. The bulls are now testing the 50% level at 0.9233, with a break above that eyeing the 61.8% Fib at 0.9290. Alternatively, a reversal back below 0.9177 aims for the March 7 highat 0.9132.Prices are too close to relevant resistance to justify a long position from a risk/reward perspective. On the other hand, entering a short trade looks premature absent a new bearish reversal signal. We will continue to stand aside for now, waiting for a more attractive setup to present itself.
2013-03-27 09:30 GMT (or 10:30 MQ MT5 time) | [GBP - Retail Sales]
if actual > forecast = good for currency (for GBP in our case)
==========
U.K. Retail Sales Growth Tops Expectations
Retail sales volume including automotive fuel rose 1.7 percent in February from January, the Office for National Statistics said. Sales were expected to grow 0.5 percent after falling 2 percent in January.
Excluding auto fuel, retail sales gained 1.8 percent in February, in contrast to a 2 percent fall in the prior month. Economists were looking for a 0.3 percent rise.
5 Software Stocks to Buy Now
Gold Down Again; Lack of Bullish Fundamental News Keeps Bearish Technicals in Focus
Gold prices ended the U.S. day session moderately lower and hit another six-week low Thursday. Prices also fell below psychological support at $1,300. A dearth of fresh, bullish fundamental news is allowing the technically oriented bears to take advantage of the weak chart posture of gold. April gold was last down $10.40 at $1,293.00 an ounce. Spot gold was last quoted down $12.50 at $1,293.75. May Comex silver last traded down $0.07 at $19.71 an ounce.
The Russia-Ukraine tensions have not escalated significantly recently, but the situation remains a concern to the world market place. While the U.S. is leading a worldwide effort to isolate Russia after its annexation of Crimea, reports Thursday said Russian economic growth is set to slow to the weakest rate in years. Foreign capital in Russia has seen a mass exodus since the crisis emerged. Russia’s deteriorating economy and world isolation will very likely only make Russian president Vladimir Putin more defiant on the world stage. Remember that the Russian military is still very powerful and is still bristling with nuclear missiles. Put another way, Russia could become the next North Korea—only supersized. This entire matter is likely to become a longer-term bullish underlying factor for safe-haven gold. Some are now calling the present U.S.-Russia relations “Cold War 2.0.”
Meantime, the IMF has agreed to loan Ukraine up to $18 billion to help out that nation’s struggling economy, after the Russian incursion.
Reports this week say demand for physical gold from Asia continues tepid.
U.S. economic data out Thursday included the weekly jobless claims report, the third-quarter GDP estimate, the Kansas City Fed manufacturing survey, and pending home sales. This data set was generally upbeat, which was a bearish underlying factor for the precious metals Thursday. The data falls into the camp of monetary policy hawks who favor less stimulus from the U.S. Federal Reserve.
The markets paid little attention to news late Wednesday that some U.S. and world banks, including Citi, failed a government stress test due to inadequate capital plans. Those banks will have to resubmit new capital plans to the Federal Reserve.
The London P.M. gold fixing was $1,296.00 versus the previous P.M. fixing of $1,304.00.
Technically, April gold futures prices closed nearer the session low Thursday. Serious near-term chart damage has been inflicted recently. Prices are in a steep two-week-old downtrend on the daily bar chart. The bears have the near-term technical advantage. The gold bulls’ next upside near-term price breakout objective is to produce a close above solid technical resistance at $1,320.00. Bears' next near-term downside breakout price objective is closing prices below solid technical support at $1,250.00. First resistance is seen at $1,300.00 and then at Thursday’s high of $1,307.60. First support is seen at Thursday’s low of $1,291.20 and then at $1,285.00. Wyckoff’s Market Rating: 3.5
May silver futures prices closed near mid-range Thursday and hit a seven-week low. Prices are in a four-week-old downtrend on the daily bar chart. The bears have the near-term technical advantage. Silver bulls’ next upside price breakout objective is closing prices above solid technical resistance at $20.63 an ounce. The next downside price breakout objective for the bears is closing prices below solid technical support at $19.00. First resistance is seen at Thursday’s high of $19.87 and then at $20.00. Next support is seen at Thursday’s low of $19.575 and then at $19.50. Wyckoff's Market Rating: 2.5.
May N.Y. copper closed up 300 points at 299.55 cents Thursday. Prices closed nearer the session high on short covering. Prices are in a three-month-old downtrend on the daily bar chart and bears have the overall near-term technical advantage. Copper bulls' next upside breakout objective is pushing and closing prices above solid technical resistance at 307.75 cents. The next downside price breakout objective for the bears is closing prices below solid technical support at the March low of 287.70 cents. First resistance is seen at this week’s high of 301.90 cents and then at 304.00 cents. First support is seen at Thursday’s low of 296.25 cents and then at 295.00 cents. Wyckoff's Market Rating: 2.5.
Bitcoin Tumbles on Rumors of PBOC’s Order for Accounts Shutdown (based on forexminute article)
Bitcoin prices plummeted nearly 10 percent on Thursday as news filtered in that China’s central bank had issued a directive to the local banks to stop dealing with businesses that transact using the virtual currency.
The Bitcoin was trading at $535.10, a drop of 7.77 percent from the Wednesday’s closing amount, according to CoinDesk.* This was triggered by media reports that the People’s Bank of China had mailed banks directing them to shut down the accounts of 15 Bitcoin traders by April 15. The digital currency hit an intraday low of $514.24 today.
“I’m aware of the rumors circulating on the topic,” Bobby Lee, chief executive of BTC China, a leading bitcoin exchange in China, told Bloomberg. “I haven’t heard of anything else to confirm that. We are still waiting to see what happens.”
BTC China was quoting the Bitcoin at 3,053.98 yuan, down 14.1 percent, reported Wall Street Journal. Yuan is the second most traded currency against the Bitcoin in terms of volumes after the dollar.
While the PBOC circular couldn’t be confirmed independently, some reputable Chinese media such as online business news site Caixin verified the story as a fact.
When asked whether customers will no longer be able to send funds to BTC China from their bank accounts directly, Lee cautiously agreed. However, he said one option for customers would be to make direct deposits with cash.
"If the rumor turns out to be true, that's what's going to happen. At this time it's too early for me to elaborate on what steps we will take," said Mr. Lee. "We will take it one day at time."
Under PBOC rules, the directive may never be disclosed publicly, though banks will enforce it.
NZDUSD Technical Analysis (based on dailyfx article)
- NZD/USD Technical Strategy: Flat
- Support: 0.8649 (23.6% Fib exp.)
- Resistance: 0.8689 (0.0% Fib exp.)
New Zealand Dollar pushed aggressively higher against its US counterpart to test resistance at 0.8675, the April 2013 swing high. A break above this barrier aims for the 38.2% Fibonacci expansion at 0.8725. Alternatively, a reversal below the 23.6% level at 0.8639 targets a rising trend line set from February, now at 0.8570.Negative RSI divergence warns of a possible turn lower ahead but confirmation is lacking, suggesting a short trade is premature. On the other hand, entering long with prices squarely at resistance is unattractive from a risk/reward perspective. We will continue to stand aside for now.