Press review - page 446
You are missing trading opportunities:
- Free trading apps
- Over 8,000 signals for copying
- Economic news for exploring financial markets
Registration
Log in
You agree to website policy and terms of use
If you do not have an account, please register
USD/CAD Intra-Day Fundamentals: Canada's Consumer Price Index and 92 pips range price movement
2016-10-21 12:30 GMT | [CAD - CPI]
if actual > forecast (or previous one) = good for currency (for CAD in our case)
[CAD - CPI] = Change in the price of goods and services purchased by consumers.
==========
From official report:
Seasonally adjusted monthly Consumer Price Index:
==========
USD/CAD M5: 92 pips range price movement by Canada's Consumer Price Index news event
What is the relation to to the Seasonally adjusted monthly Consumer Price Index?
Example: Core Durable Orders are more impacted news event than Dorable Orders, and so on.
The traders are lookibng for core values because those values are moving the price a lot.
I mean: CPI value is just for information only, CPI core is to understand why the price was moved like that to some direction for example. Same with other other news event: core value is more important for us.
Weekly Outlook: 2016, October 23 - October 30 (based on the article)
The US dollar took a break but eventually renewed its strength, with new seven month highs against the euro and the loonie. Mark Carney and Mario Draghi’s speeches, US Durable Goods Orders, and GDP data from the UK and the US. These are the major events on forex calendar.EUR: Weekly Outlook - Morgan Stanley (based on the article)
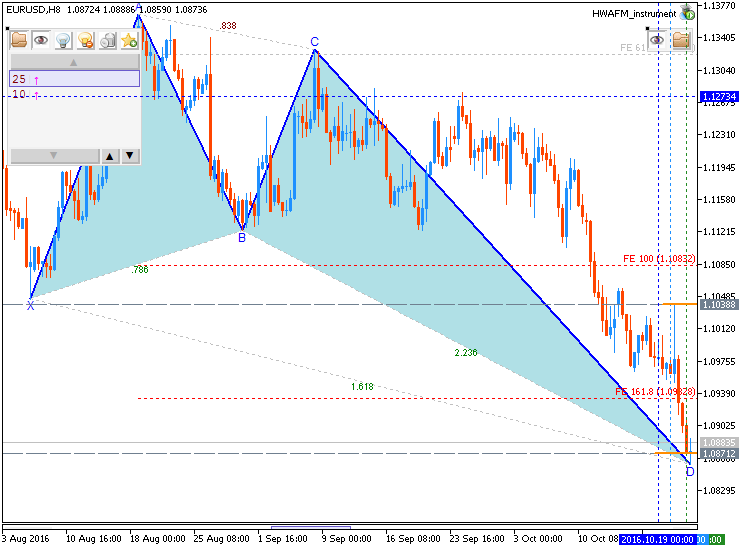
H4 price is continuing with the bearish breakdown by 1.0858 support level to be tested for the bearish trend to be resumed while Morgan Stanley is suggesting for the traders to be in neutral with this pair for the week:
"The latest ECB meeting did not reveal any new information and put all attention on the December meeting instead. EURUSD break below the Jun low of 1.0913 could open downside to the February/March low of around 1.0820. On the crosses, however, EUR is likely to remain supported. Should global and EMU inflation continue rising, ECB tapering talk could come back into focus and the current rate cut priced by the markets may be reduced, supporting the currency. In this scenario, global yield curves may also continue steepening, which could hit risk appetite, providing further support for EUR crosses."
Anyway, if H4 intra-day price breaks 1.0858 support to below on close bar so the bearish trend will be continuing, otherwise the price will be on bearish reanging within narrow s/r levels.
CAD: Weekly Outlook - Morgan Stanley (based on the article)
Daily price is on bullish breakout to be started in the end of the last week: the price is testing 1.3358 resistance level to above for the primary bullish trend to be continuing. For the week, the Morgan Stanley is suggesting for the traders to be in neutral with this pair for a week:
"In the latest meeting, the BoC revised their inflation and growth forecasts down and changed their wording on inflation risks to be "roughly balanced", which was less dovish than markets expected. However, Governor Poloz later said that the bank actively discussed the possibility of adding more stimulus, though it would require a shock or series of shocks for them to ease further. We think this means the Bank is willing to act if the economy takes another dip, but would need shocks such as a significant drop in oil, severe slowdown in the US economy or a US presidential outcome that could change NAFTA for them to deliver more easing. These scenarios look unlikely for now, therefore we turn neutral on CAD."
If D1 price breaks 1.3358 resistance to above on close bar so the bullish trend will be continuing.If D1 price breaks 1.3090 support level to below so the reversal of the price movement from the bullish to the primary bearish market condition will be started.
If not so the price will be on bullish ranging within the levels.
Quick Technical Overview - S&P 500: Recovery Has Been The Strongest In History (based on the article)
Daily price is on ranging market condition located near and below Senkou Span line which is the virtual border between the primary bearish and the primary bullish trend on the chart. Symmetric triangle pattern was formed by the price to be crossed for the direction of the trend, and Absolute Strength indicator is estimating the ranging condition to be continuing in the near future.
Analyst Doug Short is comparring the next recovery with the past ones:
- The Crash of 1929, which eventually ushered in the Great Depression,
- The Oil Embargo of 1973, which was followed by a vicious bout of stagflation,
- The 2000 Tech Bubble bust and,
- The Financial Crisis following the record high in October 2007.
As we see from the daily chart so the recovery is already started by 2,144 resistance level to be testing for the daily bullish reversal.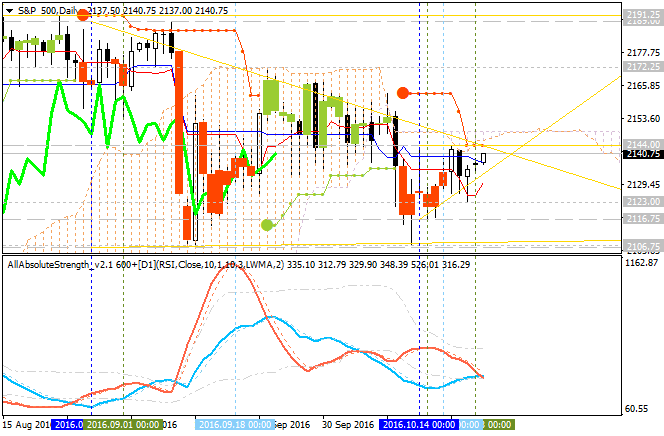
If W1 price will break 2,106 support level so the primary bearish trend will be resumed.If W1 price will break 2,144 resistance level so the reversal to the primary bullish condition will be started.
If not so the price will be ranging within the levels.
GBP/USD Intra-Day Fundamentals: Bank of England Bond-Buying Operation Results and 36 pips price movement
2016-10-24 13:50 GMT | [GBP - Bank of England Bond-Buying Operation Results]
==========
GBP/USD M5: 36 pips price movement by Bank of England Bond-Buying Operation Results news event
Brent Crude Oil Intra-Day Technicals: possible ranging correction (adapted from the article)
H4 price is located above 100 SMA/200 SMA reversal levels in the bullish area of the chart:
Most likely intra-day scenario for the price movement in the near future: secondary correction within the primary bullish market condition.
USD/CAD Intra-Day Fundamentals: BoC Gov Poloz Speaks and 112 pips range price movement
2016-10-24 19:30 GMT | [CAD - BoC Gov Poloz Speaks]
[CAD - BoC Gov Poloz Speaks] = speech before the House of Commons Standing Committee on Finance, in Ottawa.
==========
From official report:
==========
USD/CAD M5: 112 pips range price movement by BoC Gov Poloz Speaks news event
Dax Index: Bullish breakout (adapted from the article)
Daily price is on bullish breakout with 10,815 resistance level to be tested for the bullish trend to be continuing.
If the daily price breaks 10,815 resistance to above on close daily bar so the bullish trend will be continuing.
If the daily price breaks 10,336 support level to below on close bar so the bearish reversal will be started.
If not so the price will be on bullish ranging within the levels.