Last Friday the world’s financial markets closed mixed. In Europe,
the FTSE 100 advanced 1.23 percent up to 6,545.27 points, the DAX 30
fell 0.25 percent closing at 9,778.90 points, and the CAC 40 shed 0.18
percent down to 4,241.65 points.
On the Russian equity market, the MICEX index dropped 1.9 percent
down to 1,449.13 points whereas the RTS index grew 0.41 percent up to
768.06 points.
In the United States, the Dow Jones Industrial Average added 0.15
percent closing at 17,804.80 points, the Standard & Poor’s 500 grew
0.46 percent up to 2,070.65 points, and the NASDAQ Composite gained 0.36
percent going up to 4,765.38 points.
The MYMEX price of WTI oil futures for January rose by $2.41 and made
$56.52 a barrel. On London’s ICE, the price of Brent oil futures for
February went up by $2.11 and finished trading at $61.38 a barrel.
On the Forex market, EURUSD
is going down. Now it’s at the bottom boundary of the weekly triangle.
As the scale is quite large, it’s hard to pinpoint the level at which
the pair may break out of the triangle or rebound from the support.
Thus, it would make sense just to watch the pair’s movements for some
time.
if actual > forecast (or actual data) = good for currency (for NZD in our case)
[NZD - Trade Balance] = Difference in value between imported and exported goods during the reported month. Export demand and currency demand are directly linked because foreigners
must buy the domestic currency to pay for the nation's exports. Export
demand also impacts production and prices at domestic manufacturers
New Zealand posted a merchandise trade deficit of NZ$213 million in
November, Statistics New Zealand said on Tuesday - representing 5.3
percent of exports.
The headline figure beat forecasts for a shortfall of 575 million following the NZ$908 million deficit in October.
Exports dipped 9.5 percent on year to NZ$4.02 billion - missing
forecasts for NZ$4.03 billion, which would have been roughly unchanged
from the previous month.
Dairy exports drove the fall, down 27 percent, with the quantity down
3.1 percent. The fall in dairy reflects the record high levels exported,
mainly to China, in November 2013. A 20 percent rise in meat exports
partially offset the fall, led by a price-driven rise in frozen beef.
"The fall in export values reflects a return from the high values late
last year, led by China," international statistics manager Jason
Attewell said. "The trend for exports to China is 42 percent lower than
the series peak in December 2013, and is now at similar levels to 2012."
Imports fell an annual 1.3 percent to NZ$4.24 billion versus
expectations for NZ$4.58 billion and down from NZ$4.94 billion a month
earlier.
Capital goods (aircraft and helicopters) led the fall.
Year to date, New Zealand has a trade deficit of NZ$453 million -
topping expectations for a deficit of NZ$774 million following the
NZ$107 million annual deficit in the previous month.
This is the smallest November deficit since 2010, the bureau said.
Record high exports late last year resulted in the first trade surplus
for a November month (NZ$153 million) since 1991.
Technical Analysis for USDJPY, GBPUSD and EURUSD(based on dailyfx article)
USDJPY
USD/JPY has moved steadily higher over the past few
days since finding support from just above the 38% retracement of the
October low
Our near-term trend bias is higher in USD/JPY while above 117.40
A confluence of Gann and Fibonacci levels around 120.50 suggests this should be the next important action/reaction area
A close back under 117.40 would turn us negative on the exchange rate
Instrument
Support 2
Support 1
Spot
Resistance 1
Resistance 2
USD/JPY
117.40
118.50
119.75
120.10
120.50
GBPUSD
GBP/USD registered a new low for the year last week, but has since rallied back into the middle of the month-long range
Our near-term trend bias is negative while below 1.5790
A close under 1.5540 is needed to confirm the start of a more important leg lower
A close over 1.5790 would turn us posiitve on Cable
Instrument
Support 2
Support 1
Spot
Resistance 1
Resistance 2
GBP/USD
1.5370
1.5540
1.5610
1.5675
1.5790
EURUSD
EUR/USD has managed to buck the historically positive seasonality of
late December with aggressive weakness over the past few days taking the
exchange rate to new lows for the year. The resumption of the broader
trend has come earlier than we were expecting and has caught us a bit by
surprise. We are now open to the possibility of a cyclical inversion
early next year. Attention now turns to the next major downside pivot
around 1.2135 as this marks the 50% retracement of the all-time low and
the all-time high in the euro. Traction under this level in the weeks
ahead would signal the start of a more important run lower in the
exchange rate. A potential positive for the euro is the sentiment
picture which saw the DSI fall to just 6% bulls on Friday. Extreme
negative sentiment has accompanied every break to new lows over the past
few months and warns too many traders are looking for the same thing.
However, the next cyclical turn window of significance is not seen until
closer to year-end.
if actual > forecast (or actual data) = good for currency (for GDP in our case)
[GBP - GDP] = Change in the inflation-adjusted value of all goods and services produced by the economy. It's the broadest measure of economic activity and the primary gauge of the economy's health
The UK's third-quarter economic growth has been finalised at 0.7 per
cent, year-on-year, confirming the nation's status as one of the most
rapidly growing advanced economies.
But the original year-on-year growth figure of 3 per cent was revised
downward to 2.6 per cent, the Office for National Statistics said in
its final version of the data.
The UK economy is rebounding as unemployment has declined to 6 per
cent while pay rises are nudging ahead of low inflation. A supermarket
price war and low fuel prices are encouraging consumer spending.
Meanwhile, low interest rates have spurred house price rises of 8 per
cent or more, year-on-year, for 12 consecutive months, according to
Nationwide.
Strategy Video: A Lesson for 2015 from Past Financial Crises(based on dailyfx article)
Before financial market crises unfolder there is a steady erosion of the system's structure
In 2008, an appetite for leverage and need for return led to implosion triggered by Bear Stearns
The 1998 failure of Long Term Capital Management offers a similar story to the conditions we face today
Financial crises often explode from periods of exceptional market
performance and their appearance is usually catches the investing
community off guard. Yet, as dramatic as the market reactions may be;
these disruptive periods of rebalancing are not so obscure when the
underlying structural circumstances of the financial system are
accounted for. Back in 2008, the Great Financial Crisis was built upon
an appetite for excessive return and leverage through high finance. It
was, however, subprime and Bear Stearns' collapse that receives the
blame. Further back, 1998 draws a strong corollary to today's market
with an Asian financial crisis and Russian default leading to the
dramatic failure of Long Term Capital Management. Heading into 2015, we
have: excessive leverage; exposure to exceptionally risky assets; low
returns; a dependency on low volatility; and growing investor doubt. We
discuss the importance of appreciating a big-picture structural risk
heading into 2015.
Strategy Video: A Systemic Change in Market Conditions for 2015(based on dailyfx article)
Record highs for US equities and a slump in volatility developed under precarious circumstances
Important changes in the financial system were already starting to take place in 2H 2014
In the New Year, look for volatility to increase, risk aversion to take and trading approaches to change
Record highs in markets founded on record exposure
to leverage and exceptionally low rates of return make for an ill-fated
future. While benchmarks like the S&P 500
have chugged along consistently for nearly six years following the
Great Financial Crisis, the foundation for this performance never fully
set. The higher we reach, the more obvious the instability of the
situation becomes. Market participants were already showing greater
deference for these concerns in the second half of 2014, but the
convergence of all the elements and damaging catalysts will more
dramatically and permanently turn the current. This will result in more
systemic volatility, greater correlations, rising volume, a focus on
'risk aversion' and a change in traders' approach to the market. We
discuss the trading landscape of the New Year in today's Strategy Video.
Price & Time: EUR/USD Rebounds Ahead Of Key Pivot(based on dailyfx article)
Price & Time Analysis: EUR/USD
EUR/USD fell to its lowest level since August of 2012 on Tuesday
Our near-term trend bias is lower in EUR/USD while below 1.2360
The 50% retracement of the all-time low and the all-time high around 1.2135 is the next important pivot for the exchange rate
The next turn window of importance is seen around the end of the month
A close above 1.2360 would turn us positive on the euro
EUR/USD Strategy: Like the short side while below 1.2360
Instrument
Support 2
Support 1
Spot
Resistance 1
Resistance 2
EUR/USD
1.2135
1.2165
1.2190
1.2260
1.2360
Price & Time Analysis: USD/JPY
USD/JPY traded at its highest level in over two weeks
on Tuesday before encountering resistance around the 1st square root
relationship of the year’s high in the 120.70 area
Our near-term trend bias is positive while over 119.50
Traction over 120.70 is needed to prompt a push towards the yearly high
An important turn window is seen this month
A close under 119.50 would turn us negative on the exchange rate
USD/JPY Strategy: Like the long side while over 119.50
Instrument
Support 2
Support 1
Spot
Resistance 1
Resistance 2
USD/JPY
119.65
120.25
120.40
120.70
121.85
Focus Chart of the Day: S&P 500
The S&P 500 finally managed to break convincingly above the key
resistance at 2075/80 (127% extension of the September/October decline
& 6th square root relationship of the October low) on Tuesday. The
end of December is historically one of the strongest seasonal periods of
the year for the US equity market and it is very difficult seeing the
index letting up much before year-end. The first quarter of next year
could be a different story, however, as a slew of important cyclical
relationships during this time suggest the index will probably surprise
and come under a bit of pressure. The first important ‘turn window’ of
the year is seen around the 2nd week of January.
Russia Says Currency Crisis Over, But Economic Challenges Remain(based on rttnews article)
Russian authorities said on Thursday that the country's currency
crisis was over, but its economic problems are yet to be resolved.
The
ruble has recovered sharply in response to the steps taken by Russian
authorities to prevent further declines in the currency and to slow
inflation. The currency slumped to record lows in the backdrop of
falling oil prices.
Last week, the Bank of Russia unexpectedly
raised its key rates sharply to 17 percent from 10.5 percent. The
massive hike was aimed at limiting the slide in the ruble and risks to
inflation.
The state-run news agency TASS on Thursday quoted the
country's Finance Minister Anton Siluanov as saying that there were no
reason for keeping interest rates high for long.
"As soon as we
see that the market situation improves, I believe that the Central Bank
will decide on changing the key rate," the finance minister said. "This
will provide guidance and influence market rates, which will also fall."
In interviews given to Russian media outlets, Economy Minister Alexey
Ulyukayev expressed hope that the country's rating will not be lowered.
A downgrade to 'junk' would be 'irrational' as the situation is under
control, he reportedly said.
Meanwhile, the finance minister told
the upper house of parliament on Thursday that inflation could reach
11.5 percent or higher this year. The budget deficit could be in excess
of 0.6 percent of GDP next year, he reportedly said.
The minister
also said that authorities are also drafting measures to lower interest
rates for systemically important sector, the TASS reported.
We end 2014 with US CB Consumer Confidence and Unemployment Claims
and open 2015 with US ISM Manufacturing PMI. Join our weekly outlook
with the main market movers to impact Forex trading. Happy 2015!
Last week, the final revision to US GDP in Q3 came out better than
expected, crossing the 4% growth rate for the second consecutive
quarter. US economy expanded 5% between July and September, beating the
preliminary estimate of 3.9% and the median forecast of 4.3%. The
strong expansion indicates the US economy will close 2014 on a strong
note. More positive data was released from the US labor market with a
continued decline in the number of initial unemployment claims, noting
the US job market continues to improve with increased hiring and fewer
dismissals. Will the US economy continue to expand in 2015?
US CB Consumer Confidence: Tuesday,
15:00. U.S. consumer confidence declined in November to a five month
low of 88.7 after posting 94.5 in October. Consumer’s confidence
regarding current-business conditions and short-term outlook dropped
considerably. Analysts expected confidence to rise to 95.9. Economists
expect consumer sentiment will reach 94.6 in December.
US Unemployment Claims:
Wednesday, 13:30. The number of new applications for unemployment
benefits declined last week to its lowest level since early November,
indicating the job market continues to demonstrate strength. Initial
jobless claims dropped by 9,000 to a seasonally adjusted 280,000.
Economists expected claims to reach 290,000. The less volatile
four-week moving average fell 8,500 to 290,250 indicating companies
seek to hold on to their workers and hire new ones. The number of
weekly claims is expected to reach 287,000 this week.
US ISM Manufacturing PMI: Friday,
15:00. The U.S. manufacturing sector lost momentum in November,
reaching 58.7 after a 59 points reading in the prior month. Economists
expected a lower figure of 57.9. New Orders Index increased to 66, from
October’s reading of 65.8; the Production Index reached 64.4%, down
from the previous reading of 64.8; and the Employment Index declined to
54.9, compared to the precious reading of 55.5. Lower energy prices
gave a boost to the manufacturing sector, increasing consumer’s demand
and the continued strength of the Us labor market also contributes to
growth. Manufacturing PMI is forested to reach 57.6 this time.
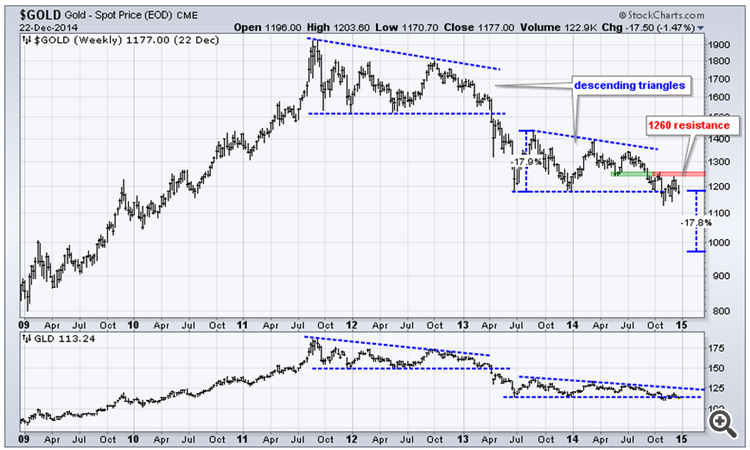
The key theme on the gold price chart are the two trading ranges since
gold’s all time highs. One trading range started end of 2011 and lasted
till early 2013, the second one is still in play. In technical terms,
both trading ranges took the form of a descending triangle.
Earlier this year, gold analyst Ronald-Peter Stoeferle released its gold
price model for 2015 and beyond. Based on weighted probabilities, his
model shows a long-term gold price of USD 1,515 per ounce. The
distribution of gold price expectations remains positively skewed as
evidenced by the following chart. Therefore, should there be a deviation
from the currently widely expected path towards stabilization of the
central banks’ balance sheet, significant upside potential for the gold
price would result.
EUR/USD Moves Down Again (based on finances article)
Last Friday the world’s financial markets closed mixed. In Europe, the FTSE 100 advanced 1.23 percent up to 6,545.27 points, the DAX 30 fell 0.25 percent closing at 9,778.90 points, and the CAC 40 shed 0.18 percent down to 4,241.65 points.
On the Russian equity market, the MICEX index dropped 1.9 percent down to 1,449.13 points whereas the RTS index grew 0.41 percent up to 768.06 points.
In the United States, the Dow Jones Industrial Average added 0.15 percent closing at 17,804.80 points, the Standard & Poor’s 500 grew 0.46 percent up to 2,070.65 points, and the NASDAQ Composite gained 0.36 percent going up to 4,765.38 points.
The MYMEX price of WTI oil futures for January rose by $2.41 and made $56.52 a barrel. On London’s ICE, the price of Brent oil futures for February went up by $2.11 and finished trading at $61.38 a barrel.
On the Forex market, EURUSD is going down. Now it’s at the bottom boundary of the weekly triangle. As the scale is quite large, it’s hard to pinpoint the level at which the pair may break out of the triangle or rebound from the support. Thus, it would make sense just to watch the pair’s movements for some time.
if actual > forecast (or actual data) = good for currency (for NZD in our case)
[NZD - Trade Balance] = Difference in value between imported and exported goods during the reported month. Export demand and currency demand are directly linked because foreigners must buy the domestic currency to pay for the nation's exports. Export demand also impacts production and prices at domestic manufacturers
==========
New Zealand November Trade Deficit NZ$213 Million
New Zealand posted a merchandise trade deficit of NZ$213 million in November, Statistics New Zealand said on Tuesday - representing 5.3 percent of exports.
The headline figure beat forecasts for a shortfall of 575 million following the NZ$908 million deficit in October.
Exports dipped 9.5 percent on year to NZ$4.02 billion - missing forecasts for NZ$4.03 billion, which would have been roughly unchanged from the previous month.
Dairy exports drove the fall, down 27 percent, with the quantity down 3.1 percent. The fall in dairy reflects the record high levels exported, mainly to China, in November 2013. A 20 percent rise in meat exports partially offset the fall, led by a price-driven rise in frozen beef.
"The fall in export values reflects a return from the high values late last year, led by China," international statistics manager Jason Attewell said. "The trend for exports to China is 42 percent lower than the series peak in December 2013, and is now at similar levels to 2012."
Imports fell an annual 1.3 percent to NZ$4.24 billion versus expectations for NZ$4.58 billion and down from NZ$4.94 billion a month earlier.
Capital goods (aircraft and helicopters) led the fall.
Year to date, New Zealand has a trade deficit of NZ$453 million - topping expectations for a deficit of NZ$774 million following the NZ$107 million annual deficit in the previous month.
This is the smallest November deficit since 2010, the bureau said. Record high exports late last year resulted in the first trade surplus for a November month (NZ$153 million) since 1991.
Technical Analysis for USDJPY, GBPUSD and EURUSD (based on dailyfx article)
USDJPY
GBPUSD
EURUSD
EUR/USD has managed to buck the historically positive seasonality of late December with aggressive weakness over the past few days taking the exchange rate to new lows for the year. The resumption of the broader trend has come earlier than we were expecting and has caught us a bit by surprise. We are now open to the possibility of a cyclical inversion early next year. Attention now turns to the next major downside pivot around 1.2135 as this marks the 50% retracement of the all-time low and the all-time high in the euro. Traction under this level in the weeks ahead would signal the start of a more important run lower in the exchange rate. A potential positive for the euro is the sentiment picture which saw the DSI fall to just 6% bulls on Friday. Extreme negative sentiment has accompanied every break to new lows over the past few months and warns too many traders are looking for the same thing. However, the next cyclical turn window of significance is not seen until closer to year-end.
if actual > forecast (or actual data) = good for currency (for GDP in our case)
[GBP - GDP] = Change in the inflation-adjusted value of all goods and services produced by the economy. It's the broadest measure of economic activity and the primary gauge of the economy's health
==========
UK third quarter GDP growth confirmed at 0.7%
The UK's third-quarter economic growth has been finalised at 0.7 per cent, year-on-year, confirming the nation's status as one of the most rapidly growing advanced economies.
But the original year-on-year growth figure of 3 per cent was revised downward to 2.6 per cent, the Office for National Statistics said in its final version of the data.
The UK economy is rebounding as unemployment has declined to 6 per cent while pay rises are nudging ahead of low inflation. A supermarket price war and low fuel prices are encouraging consumer spending.
Meanwhile, low interest rates have spurred house price rises of 8 per cent or more, year-on-year, for 12 consecutive months, according to Nationwide.
Forum on trading, automated trading systems and testing trading strategies
Something Interesting in Financial Video December 2014
newdigital, 2014.12.24 15:18
Strategy Video: A Lesson for 2015 from Past Financial Crises (based on dailyfx article)
Financial crises often explode from periods of exceptional market performance and their appearance is usually catches the investing community off guard. Yet, as dramatic as the market reactions may be; these disruptive periods of rebalancing are not so obscure when the underlying structural circumstances of the financial system are accounted for. Back in 2008, the Great Financial Crisis was built upon an appetite for excessive return and leverage through high finance. It was, however, subprime and Bear Stearns' collapse that receives the blame. Further back, 1998 draws a strong corollary to today's market with an Asian financial crisis and Russian default leading to the dramatic failure of Long Term Capital Management. Heading into 2015, we have: excessive leverage; exposure to exceptionally risky assets; low returns; a dependency on low volatility; and growing investor doubt. We discuss the importance of appreciating a big-picture structural risk heading into 2015.
Forum on trading, automated trading systems and testing trading strategies
Something Interesting in Financial Video December 2014
newdigital, 2014.12.25 04:58
Strategy Video: A Systemic Change in Market Conditions for 2015 (based on dailyfx article)
Record highs in markets founded on record exposure to leverage and exceptionally low rates of return make for an ill-fated future. While benchmarks like the S&P 500 have chugged along consistently for nearly six years following the Great Financial Crisis, the foundation for this performance never fully set. The higher we reach, the more obvious the instability of the situation becomes. Market participants were already showing greater deference for these concerns in the second half of 2014, but the convergence of all the elements and damaging catalysts will more dramatically and permanently turn the current. This will result in more systemic volatility, greater correlations, rising volume, a focus on 'risk aversion' and a change in traders' approach to the market. We discuss the trading landscape of the New Year in today's Strategy Video.
Price & Time: EUR/USD Rebounds Ahead Of Key Pivot (based on dailyfx article)
Price & Time Analysis: EUR/USD
- EUR/USD fell to its lowest level since August of 2012 on Tuesday
- Our near-term trend bias is lower in EUR/USD while below 1.2360
- The 50% retracement of the all-time low and the all-time high around 1.2135 is the next important pivot for the exchange rate
- The next turn window of importance is seen around the end of the month
- A close above 1.2360 would turn us positive on the euro
EUR/USD Strategy: Like the short side while below 1.2360Price & Time Analysis: USD/JPY
- USD/JPY traded at its highest level in over two weeks
on Tuesday before encountering resistance around the 1st square root
relationship of the year’s high in the 120.70 area
- Our near-term trend bias is positive while over 119.50
- Traction over 120.70 is needed to prompt a push towards the yearly high
- An important turn window is seen this month
- A close under 119.50 would turn us negative on the exchange rate
USD/JPY Strategy: Like the long side while over 119.50Focus Chart of the Day: S&P 500
The S&P 500 finally managed to break convincingly above the key resistance at 2075/80 (127% extension of the September/October decline & 6th square root relationship of the October low) on Tuesday. The end of December is historically one of the strongest seasonal periods of the year for the US equity market and it is very difficult seeing the index letting up much before year-end. The first quarter of next year could be a different story, however, as a slew of important cyclical relationships during this time suggest the index will probably surprise and come under a bit of pressure. The first important ‘turn window’ of the year is seen around the 2nd week of January.
Russia Says Currency Crisis Over, But Economic Challenges Remain (based on rttnews article)
Russian authorities said on Thursday that the country's currency crisis was over, but its economic problems are yet to be resolved.
The ruble has recovered sharply in response to the steps taken by Russian authorities to prevent further declines in the currency and to slow inflation. The currency slumped to record lows in the backdrop of falling oil prices.
Last week, the Bank of Russia unexpectedly raised its key rates sharply to 17 percent from 10.5 percent. The massive hike was aimed at limiting the slide in the ruble and risks to inflation.
The state-run news agency TASS on Thursday quoted the country's Finance Minister Anton Siluanov as saying that there were no reason for keeping interest rates high for long.
"As soon as we see that the market situation improves, I believe that the Central Bank will decide on changing the key rate," the finance minister said. "This will provide guidance and influence market rates, which will also fall."
In interviews given to Russian media outlets, Economy Minister Alexey Ulyukayev expressed hope that the country's rating will not be lowered. A downgrade to 'junk' would be 'irrational' as the situation is under control, he reportedly said.
Meanwhile, the finance minister told the upper house of parliament on Thursday that inflation could reach 11.5 percent or higher this year. The budget deficit could be in excess of 0.6 percent of GDP next year, he reportedly said.
The minister also said that authorities are also drafting measures to lower interest rates for systemically important sector, the TASS reported.
We end 2014 with US CB Consumer Confidence and Unemployment Claims and open 2015 with US ISM Manufacturing PMI. Join our weekly outlook with the main market movers to impact Forex trading. Happy 2015!
Last week, the final revision to US GDP in Q3 came out better than expected, crossing the 4% growth rate for the second consecutive quarter. US economy expanded 5% between July and September, beating the preliminary estimate of 3.9% and the median forecast of 4.3%. The strong expansion indicates the US economy will close 2014 on a strong note. More positive data was released from the US labor market with a continued decline in the number of initial unemployment claims, noting the US job market continues to improve with increased hiring and fewer dismissals. Will the US economy continue to expand in 2015?
Gold Price 2015: Forecasts And Predictions
The key theme on the gold price chart are the two trading ranges since gold’s all time highs. One trading range started end of 2011 and lasted till early 2013, the second one is still in play. In technical terms, both trading ranges took the form of a descending triangle.
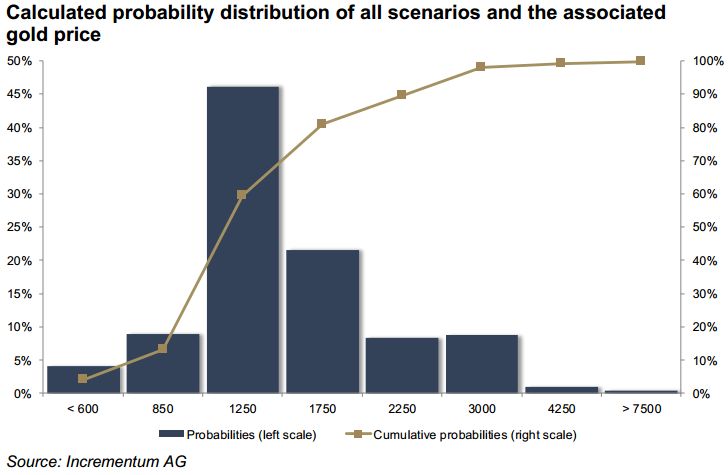
Earlier this year, gold analyst Ronald-Peter Stoeferle released its gold price model for 2015 and beyond. Based on weighted probabilities, his model shows a long-term gold price of USD 1,515 per ounce. The distribution of gold price expectations remains positively skewed as evidenced by the following chart. Therefore, should there be a deviation from the currently widely expected path towards stabilization of the central banks’ balance sheet, significant upside potential for the gold price would result.