Join our fan page
- Views:
- 5821
- Rating:
- Published:
-
 You are missing trading opportunities:
- Free trading apps
- Over 8,000 signals for copying
- Economic news for exploring financial markets
Registration Log inYou agree to website policy and terms of use
If you do not have an account, please register -
 Need a robot or indicator based on this code? Order it on Freelance
Go to Freelance
Need a robot or indicator based on this code? Order it on Freelance
Go to Freelance
1. Definition:
The MACD Histogram (MACD-H) is the bar chart component of the MACD indicator, representing the difference between the MACD line and the Signal line. Formula: MACD Histogram = MACD Line - Signal Line .
2. Core Meaning:
It measures the momentum of a trend, indicating whether the trend is accelerating or decelerating.
-
Bars lengthening & above the zero line: Buying momentum is strengthening.
-
Bars lengthening & below the zero line: Selling momentum is strengthening.
-
Bars shortening: Momentum is weakening, warning of a potential trend reversal or consolidation.
-
Bars crossing the zero line: Signals the crossover point between the MACD line and the Signal line.
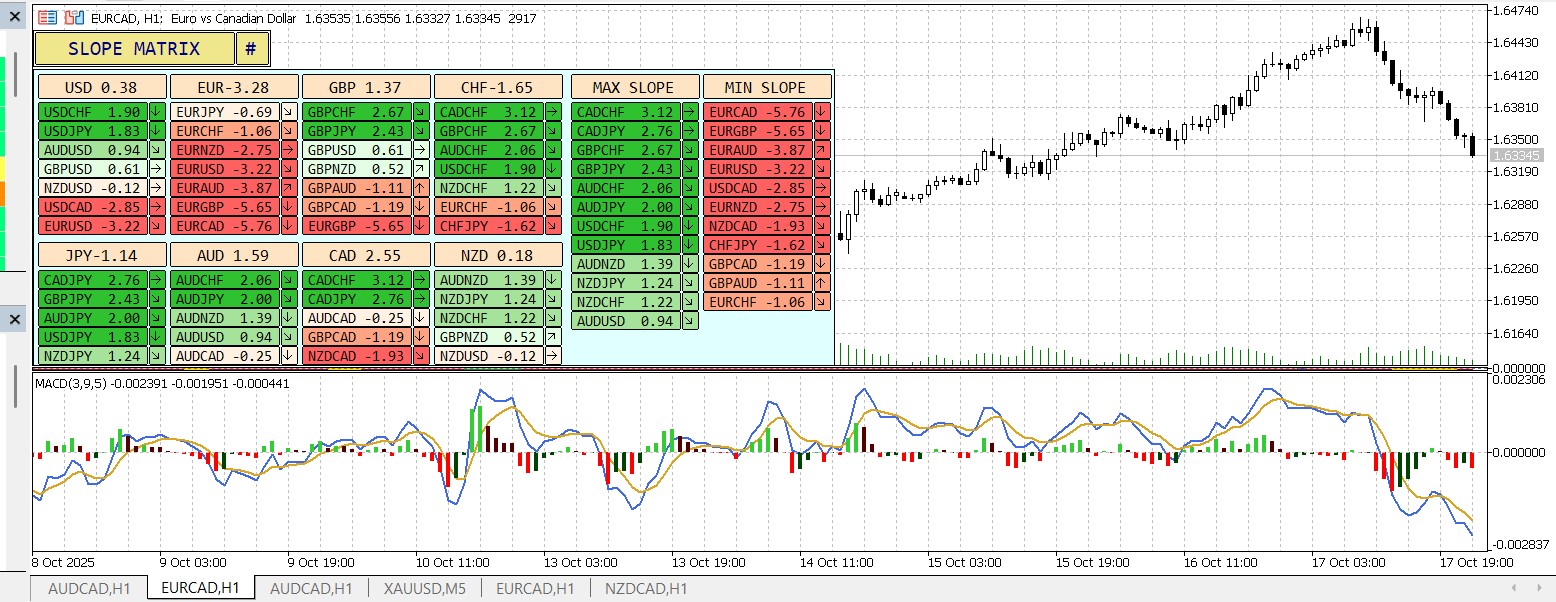
Note: The MACD Histogram is a powerful signal filter, but it should be combined with other indicators and trend analysis for optimal results.
 ZZVolatility
Another ZigZag. ZigZag
 Indicator loader for strategy testing
A system to test up to four indicators concurrently in the strategy tester
 StopLoss trailing classes library for MQL5
A set of classes for automatic moving of StopLoss of open positions by fixed indentation or by values of Parabolic SAR and moving averages indicators, or by specified position stop level.
ConvertServerTime
Function to convert server time from one broker's time zone to another.