Join our fan page

ATR Percent - indicator for MetaTrader 5

- Views:
- 4558
- Rating:
- Published:
-
 You are missing trading opportunities:
- Free trading apps
- Over 8,000 signals for copying
- Economic news for exploring financial markets
Registration Log inYou agree to website policy and terms of use
If you do not have an account, please register -
 Need a robot or indicator based on this code? Order it on Freelance
Go to Freelance
Need a robot or indicator based on this code? Order it on Freelance
Go to Freelance
ATR% is an ATR volatility indicator expressed as a percentage. It measures the average true price range for a certain period, taking into account not only daily highs and lows, but also possible price gaps.
100% in this indicator is the maximum possible volatility of the asset. On the junior timeframes ATR% in most cases takes values up to 3%, on the senior timeframes the values can be higher.
To calculate ATR%, the formula is used: ATRP = ATR / close * 100, where ATR is the average value of the largest price spread for a certain period, and close is the current price of the asset.
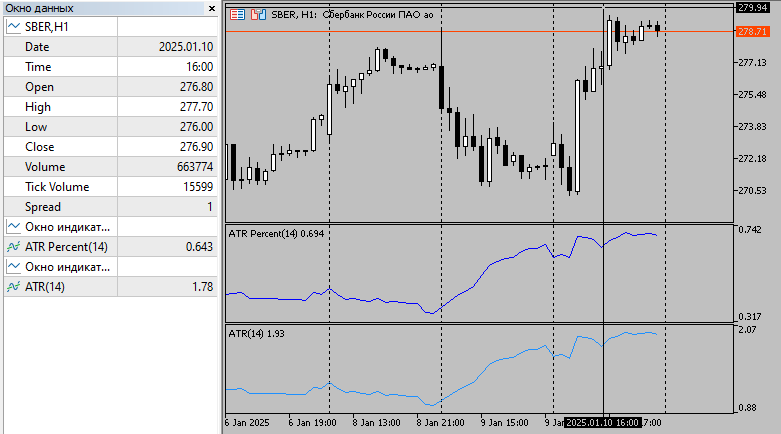
SZY. ATR vs ATR Percent. The same yuzh, but in the left hand.
Translated from Russian by MetaQuotes Ltd.
Original code: https://www.mql5.com/ru/code/54824
 MT5-BuildYourGridEA
This expert is a system to help any trader to make a grid of orders.
Value Area Retracement Volume Indicator
The Value Area Retracement indicator, is a powerful volume profile-based tool designed to identify key trading levels—Point of Control (POC), Value Area High (VAH), Value Area Low (VAL), and Profile High/Low—across different timeframes. It helps traders spot potential retracement opportunities to the POC, breakout zones, and value areas, making it useful for intraday, swing, and position trading.
Custom Fractals
The Standard fractals are 2 candles to the right and 2 candles to the left. With this Custom Fractals you can choose as many candles as you like, both to the left and to the right.
 Ascending Sort A Struct Array By A Field Example
This is an example of ascending sort a struct list by a field. You can find out and customize the above algorithm depending on the purpose of use, this is the most basic example is also a direction to resolve the arrangement in an array of structure. The algorithm used in this example is Quick Sort and Merge Sort.