Join our fan page
- Views:
- 27526
- Rating:
- Published:
- Updated:
-
Need a robot or indicator based on this code? Order it on Freelance Go to Freelance
All markets are characterized by the fact that on the most part the prices do not change too much, and only short periods of time (15-30%) for trend changes. Most lucrative periods are usually the case when market prices change according to a certain trend.
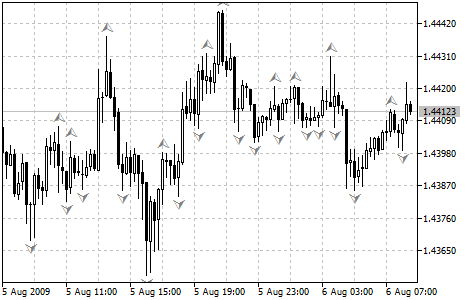
A Fractal is one of five indicators of Bill Williams’ trading system, which allows to detect the bottom or the top. Technical definition of the upwards fractal is a series of at least five successive bars, with the highest HIGH in the middle, and two lower HIGHs on both sides. The reversing set is a series of at least five successive bars, with the lowest LOW in the middle, and two higher LOWs on both sides, which correlates to the sell fractal. The fractals have High and Low values and are indicated with the up and down arrows in a chart.
The Fractal signals need to be filtrated with the use of Alligator. In other words, you should not close a buy transaction, if the fractal is lower than the Alligator’s Teeth, and you should not close a sell transaction, if the fractal is higher than the Alligator’s Teeth. After the fractal signal has been created and is in force, which is determined by its position beyond the Alligator’s Mouth, it remains a signal until it gets attacked, or until a more recent fractal signal emerges.

Fractals indicator
Translated from Russian by MetaQuotes Ltd.
Original code: https://www.mql5.com/ru/code/30
 Force Index (FRC)
The Force Index Indicator was developed by Alexander Elder. This index measures the Bulls Power at each increase, and the Bears Power at each decrease.
 Envelopes
The Envelopes Indicator is formed by two Moving Averages, one of them is shifted upward and another one is shifted downward. The selection of optimum relative number of band margins shifting is determined with the market volatility: the higher the latter is, the stronger the shift is.
 Gator Oscillator
The Gator Oscillator is based on the Alligator and shows the degree of convergence/divergence of the Balance Lines (Smoothed Moving Average).
 Heiken-Ashi
The Heiken-Ashi indicator is looks like the candlestick chart, but it has some difference.The advantage of the Heiken-Ashi charts is a simple trend determination, the upward trend candles are blue,the downward trend candles are red.