
1. What it is
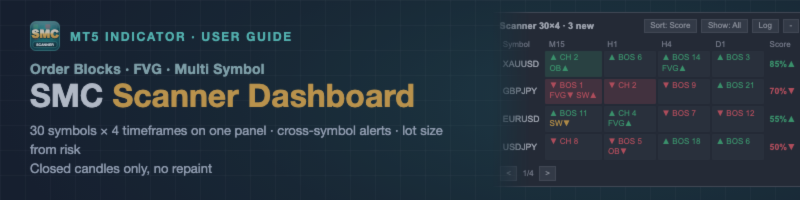
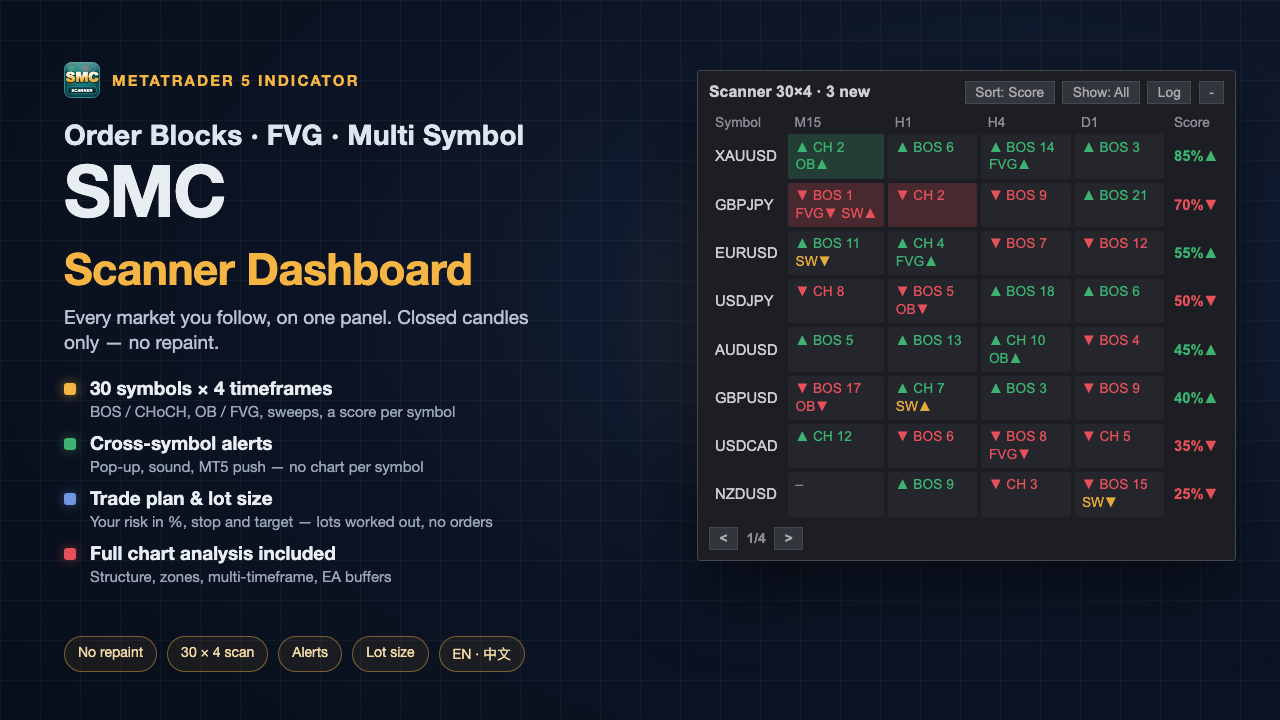
SMC Scanner Dashboard watches many markets at once. From a single chart it scans up to 30 symbols on 4 timeframes and shows, in one table:
- the structure direction and the latest BOS / CHoCH of every symbol and timeframe;
- whether price closed inside an active order block (OB) or fair value gap (FVG);
- recent liquidity sweeps;
- one confluence score per symbol.
It can alert you when something new happens on any of those symbols, and it has a trade plan tool: click a zone, get entry, stop and target lines with the lot size worked out from your risk.
It also contains every chart feature of the free SMC Structure Map indicator, with the same rules, so you only need this one indicator on the chart.
Everything comes from closed candles only. Nothing is drawn early and nothing is redrawn later.
It is an analysis and planning tool. It does not trade, does not tell you when to buy or sell and promises no profit.
2. Installation and first look
- Buy or rent it on the Market page, then drag it from Navigator → Indicators → Market onto any chart. M15 or H1 is a good start.
- Leave the inputs at their defaults the first time.
- You will see two panels:
- top left: the chart panel, the same as in SMC Structure Map;
- top right: the scanner ( Scanner 30×4 ).
- By default the scanner takes the first 30 symbols of Market Watch and the timeframes M15, H1, H4 and D1. Put the symbols you care about at the top of Market Watch, or type your own list in the input Symbols .
The first time a symbol is used, the terminal may need a few minutes to download its history. Those cells show … until the data is ready. After that, the scanner is ready within seconds every time.
Several charts. You can attach the indicator to as many charts as you like. Only one of them does the scanning; the others show one line, Scanner runs on the EURUSD M15 chart . If you close that chart, another one takes over within a few seconds. This keeps the terminal light.
3. The scanner
3.1 Reading a cell
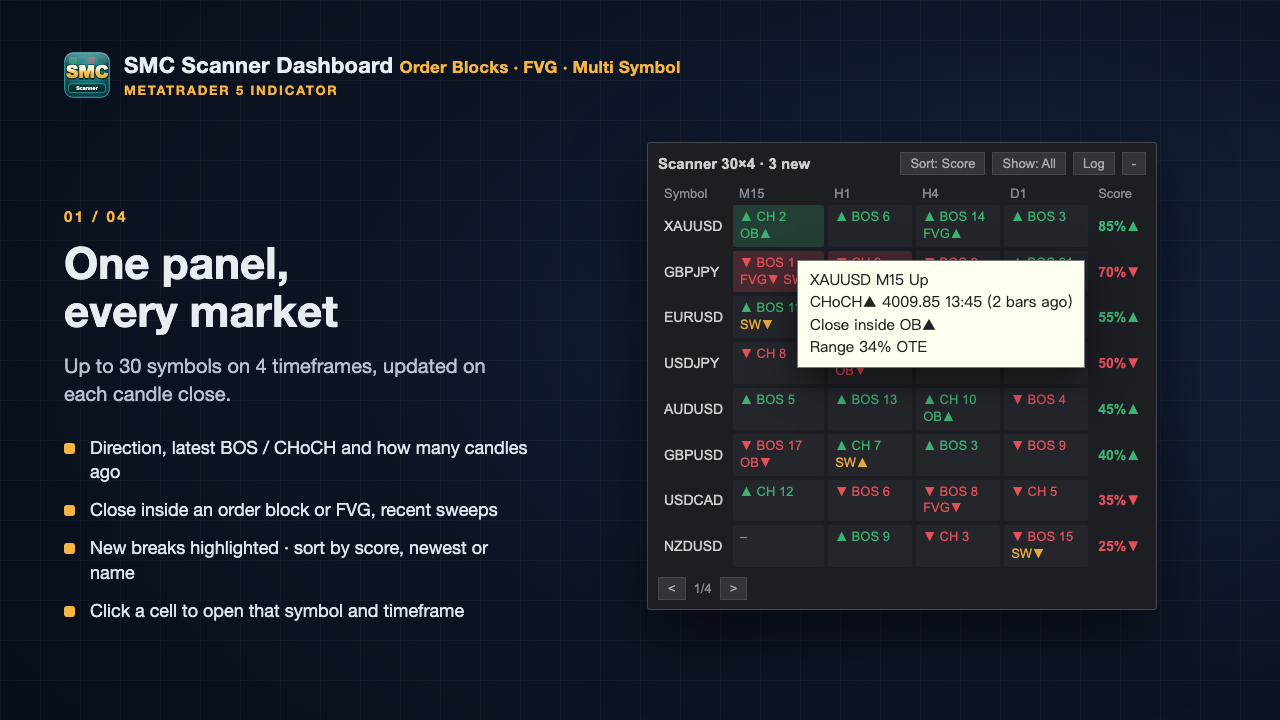
One row per symbol, one column per timeframe. Each cell has two short lines.
| Example | Meaning |
|---|---|
| ▲ CH 2 | Structure up; the latest event is a bullish CHoCH, confirmed 2 closed candles ago |
| ▼ BOS 9 | Structure down; the latest event is a bearish BOS, 9 closed candles ago |
| OB▲ | The last close is inside an active bullish order block |
| FVG▼ | The last close is inside an unfilled bearish FVG |
| SW▲ / SW▼ | A liquidity sweep of a high / low within the last 20 closed candles |
| – | No confirmed structure yet |
| … | Loading history (the terminal is downloading data) |
| - | Not enough history yet; still retrying |
| × | Symbol not found (check the spelling in Symbols ) |
- Green = bullish, red = bearish, orange = a sweep.
- A cell with a coloured background had a BOS or CHoCH within the last 3 closed candles (input "New" event ). Sweeps are shown but not highlighted, because they happen often.
- Hover a cell to see the details: the break level, the candle time, the zone, the sweep level and where price sits in the range (with OTE when it is inside 61.8–78.6%).
The rules are exactly those of SMC Structure Map: swing length 5, breaks on the close, the order block is the last opposite candle before the break, the FVG is a three-candle gap. See its user guide for the details: SMC Structure Map.
3.2 The score column
85%▲ is the confluence score of that symbol, 0–100%. It uses the same six conditions and fixed weights as the chart panel (main structure 25, higher timeframes 20, internal structure 15, discount / premium or OTE 15, inside an OB / FVG 15, recent sweep 10).
- The base is the lowest scanned timeframe (M15 by default). The "higher timeframes" item uses the other scanned timeframes of that symbol.
- The arrow shows which side is higher. Hover for both sides, for example bull 85% / bear 20% (base M15) .
- It is not a win rate and not a trade signal. It only tells you how many confirmed conditions point the same way.
3.3 Buttons
| Button | What it does |
|---|---|
| Sort: Score / Newest / Name | Highest score first; most recent break first; alphabetical |
| Show: All / New / In zone | All rows; only rows with a new break; only rows where price closed inside a zone |
| Log / Matrix | Switch between the table and the event log |
| - / + | Collapse the scanner to its title line ( Scanner 30×4 · 3 new ) and back |
| < > | Previous / next page when the rows do not fit on the chart |
Drag the scanner by any empty spot (or by a cell) to move it. It remembers its place, sort, filter and page per chart.
3.4 Click to open
Click a cell (or a line of the event log) to switch this chart to that symbol and timeframe. With the input Click on a scanner cell = Open a new chart , a new chart is opened instead. The scanner keeps running and keeps its settings.
3.5 Event log
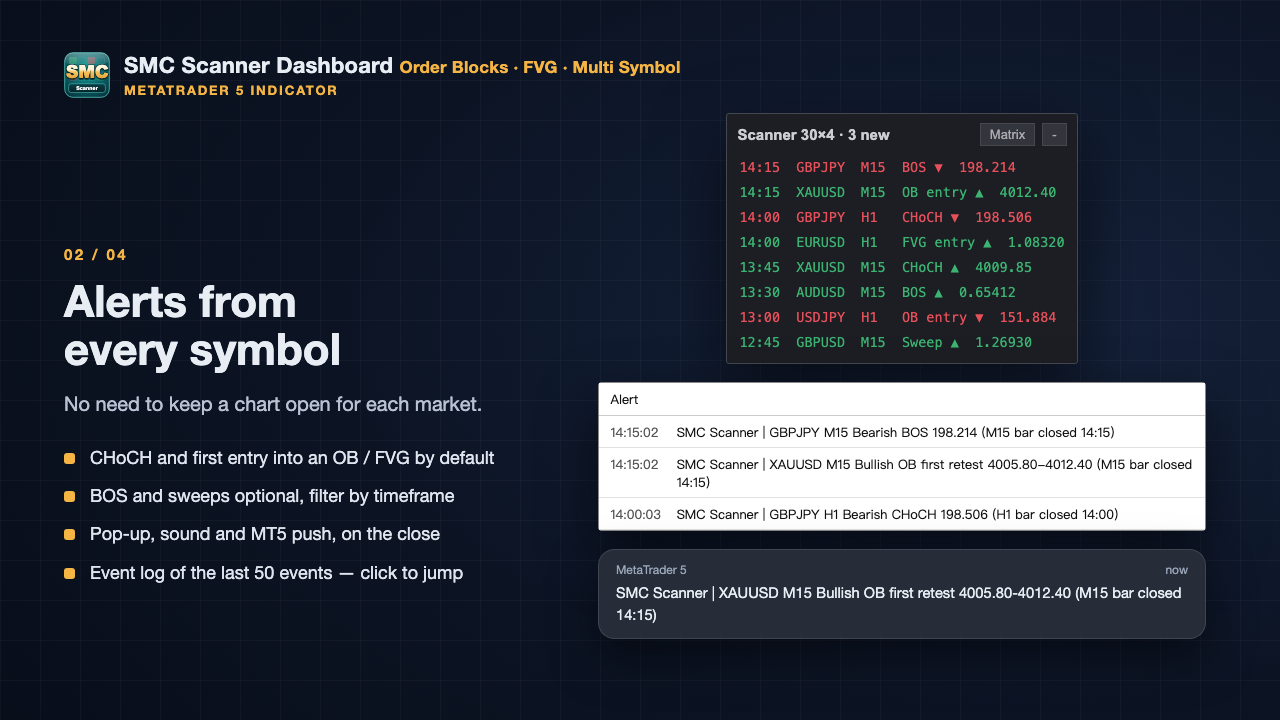
The log lists the last 50 events confirmed after the scanner started, newest first:
14:15 GBPJPY M15 BOS ▼ 198.214
Events: BOS, CHoCH, first entry into an OB / FVG, sweeps. Click a line to open that symbol and timeframe. The log is kept when you switch charts or restart the terminal (entries older than 7 days are dropped).
4. Cross-symbol alerts
Alerts for the scanned symbols — you do not need a chart open for each of them.
- Set the input Cross-symbol alerts (master switch) = true (off by default).
- Choose the events: CHoCH and First entry into an OB / FVG are on by default; BOS and Sweeps are optional.
- Optional: Timeframes limits alerts to some of the scanned timeframes (empty = all), for example H1,H4 .
The channels are the ones of the chart alerts, in the group Alerts: Pop-up alert (on by default), Sound , Push notification . The cross-symbol switch works on its own; you do not need to turn on the chart alerts.
Example:
SMC Scanner | GBPJPY H1 Bearish CHoCH 198.506 (H1 bar closed 14:00)
- Sent once the candle has closed. Nothing is replayed after a reload or a restart.
- An event that is also shown on one of your charts alerts only once.
- More than 3 events at the same time are merged into one message ( 5 new events: … ). Push messages are rate-limited.
- For push notifications, enter your MetaQuotes ID in MT5: Tools → Options → Notifications.
5. Trade plan (lot size from risk)
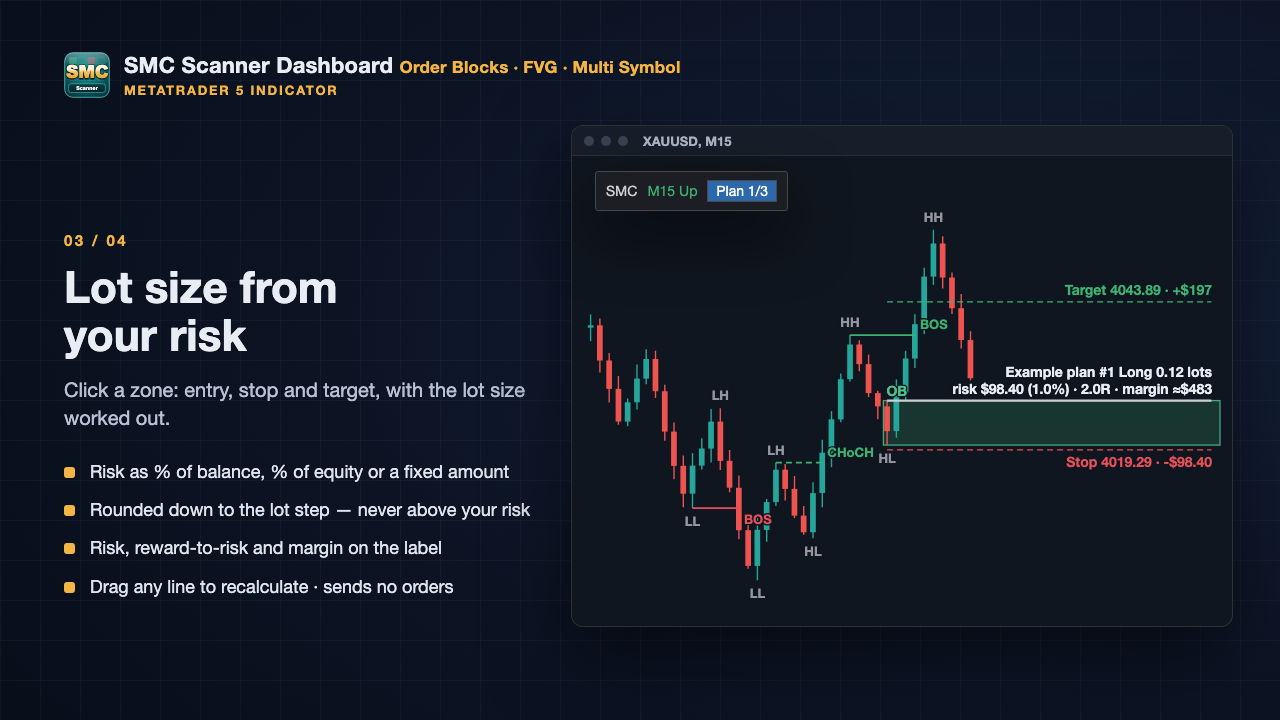
5.1 Making a plan
- Click Plan on the chart panel (4th row). The button changes to Click a zone… .
- Click any active order block or FVG on the chart — of this timeframe or of the higher timeframe drawn on the chart.
- Three lines appear:
| Line | Default |
|---|---|
| Entry (solid) | Near edge of the zone (input Entry line : near / middle / far edge) |
| Stop (dashed, red) | Beyond the far edge by 0.1 × ATR (input Stop beyond the zone ) |
| Target (dashed, green) | 2 × the stop distance from the entry (input Target ) |
A bullish zone gives a long plan, a bearish zone a short plan. Press Esc or click the button again to cancel.
These lines are a geometric example, not advice: the stop is simply placed beyond the zone, and the target is a multiple of the stop distance, not a forecast.
5.2 How the lot size is calculated
- Risk amount: Risk = % of balance (default 1%), % of equity, or a fixed amount in account currency.
- Loss of 1 lot at the stop: from the contract specification of the symbol (contract size, profit currency, calculation mode), converted to your account currency. The terminal's tick value is used only as a cross-check, because for some symbols (often gold and indices) it is wrong on some servers.
- Lots = risk amount ÷ loss of 1 lot, rounded down to the lot step and kept between the minimum and maximum lot.
Because of the rounding down, the actual risk is never above your setting (unless even the minimum lot is too large — see the warnings).
Example (USD account, balance 10,000,risk1820 → 100÷820 = 0.1219 → 0.12 lots, actual risk $98.40 (1.0%).
5.3 The label
Example plan #1 Long 0.12 lots · risk $98.40 (1.0%) · 2.0R · margin ≈$483
- lots, actual risk in account currency and in %, reward-to-risk, approximate margin;
- the stop and target lines show their price and the amount: Stop 4019.29 · -$98.40 , Target 4043.89 · +$197 .
Warnings (in red on the label):
- minimum lot exceeds the risk — even the smallest lot risks more than your setting; the actual % is shown;
- not enough free margin ;
- spread above 20% of the stop — the stop is very tight for this symbol;
- cannot convert to the account currency (no … quote) — a conversion symbol is missing; no lot size is shown rather than a wrong one.
5.4 Adjusting, saving, deleting
- Drag any of the three lines; everything is recalculated.
- Up to 3 plans per symbol (input Plans per symbol , 1–10). The button shows Plan 2/3 .
- Plans are saved per symbol: they come back after a timeframe change, on another chart of the same symbol and after a restart.
- If the zone is later invalidated or filled, the plan turns grey and says Zone no longer valid . It is not deleted automatically.
- Delete one plan with the ✕ on its label, or all plans of the symbol with Clear on the panel.
It sends no orders. Place the order yourself, in your usual trading tool, with these numbers.
6. Chart features (same as SMC Structure Map)
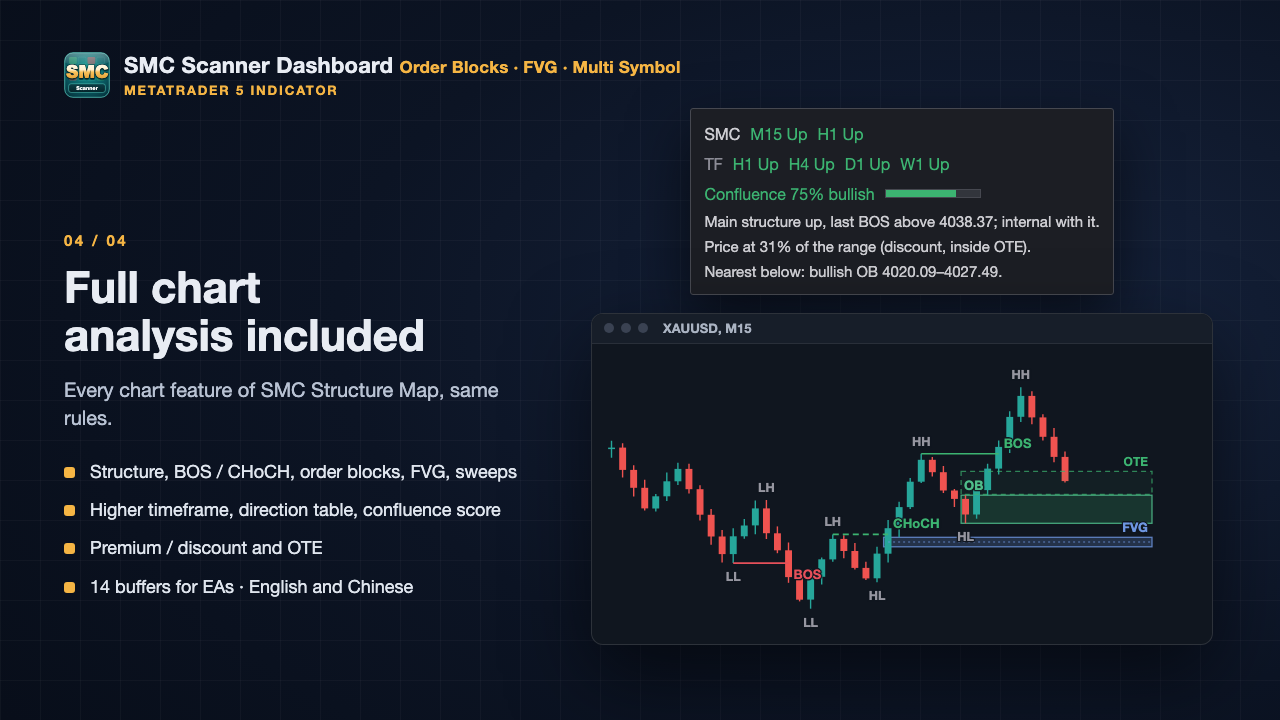
Everything of the free indicator is included and works the same way:
- market structure (HH / HL / LH / LL, EQH / EQL, BOS, CHoCH, optional internal structure);
- order blocks and FVG with their states, liquidity sweeps of swing points and of the previous day's high / low;
- one higher timeframe on the chart, multi-timeframe direction table, confluence score, plain-language notes, premium / discount and OTE;
- chart alerts, presets and toggles, English / Chinese, dark / light charts, high-DPI screens;
- the same 14 calculation buffers for EA developers. The first input Draw on the chart = false gives a data-only copy (no drawing, no scanning).
Full description of these features and their rules: SMC Structure Map.
7. Inputs
The inputs of SMC Structure Map come first and are unchanged. New groups:
Scanner
| Input | Default | Notes |
|---|---|---|
| Scanner (multi-symbol, multi-timeframe) | true | Off: no scanning and no scanner panel |
| Symbols, comma separated | empty | Empty = Market Watch. Example: XAUUSD,EURUSD,GBPJPY |
| Max symbols | 30 | 1–30 |
| Timeframes, comma separated | M15,H1,H4,D1 | Up to 4; wrong names are ignored (see the Experts log) |
| Closed bars analysed per symbol / timeframe | 1000 | More = longer first scan |
| "New" event: within this many closed bars | 3 | Highlighted cells |
| Recent sweep: within this many closed bars | 20 | SW in a cell |
| Scanner work per timer call (ms) | 30 | Lower = lighter but slower first scan |
| Click on a scanner cell | Switch this chart | Or: Open a new chart |
Scanner alerts (channels: Pop-up / Sound / Push in the group Alerts)
| Input | Default |
|---|---|
| Cross-symbol alerts (master switch) | false |
| BOS / CHoCH / First entry into an OB / FVG / Sweeps | false / true / true / false |
| Timeframes | empty = all scanned |
Trade plan (lot size from risk; sends no orders)
| Input | Default | Notes |
|---|---|---|
| Risk | % of balance | Or % of equity, Fixed amount (account currency) |
| Risk value (% or amount) | 1.0 | |
| Entry line | Near edge of the zone | Or middle, far edge |
| Stop beyond the zone (x ATR) | 0.1 | |
| Target (x stop distance) | 2.0 | |
| Plans per symbol | 3 | 1–10 |
If a scanner input is wrong (a misspelled timeframe, five timeframes …), the scanner still runs with what it can use and writes a note in the Experts tab of the Toolbox.
8. FAQ
Some cells show … for a long time.
The terminal is downloading history for that symbol. This happens once per symbol; on a slow connection it can take a few minutes.
The scanner shows only one line: "Scanner runs on the … chart".
Another chart already does the scanning, which keeps the CPU load low. Look at that chart, or close it and this one takes over.
Can I scan more than 30 symbols or more than 4 timeframes?
Not in version 1.0. The limit keeps the terminal responsive.
Is the score a probability or a win rate?
No. It is a count of confirmed conditions with fixed weights.
Why are there no buy / sell arrows?
We tested order block retests and similar entry models on years of tick data and found no edge in them on their own. So this tool shows structure and helps you size a position; the decision stays yours.
Does the trade plan place orders?
No. It only draws lines and calculates.
I use SMC Structure Map in an EA. Can I switch to this one?
Yes. The buffers have the same numbers and meaning; only the indicator name in iCustom changes.
Do I still need the free indicator?
No. Everything it does is included here.
9. Limitations
- Structure needs confirmation: a swing point needs 5 candles on its right (default) and a break needs the candle to close. Events therefore appear some candles after the turning point.
- The scanner covers symbols in your terminal only. Data quality and history depth depend on your broker.
- The score and all labels describe the chart; they do not predict it.
- Lot size depends on the symbol specification your broker provides. Check the first plan on a new symbol against your platform before trading it.
- The scanner is built for live charts, where it reads the data of other symbols in your terminal. In the strategy tester (the free demo) it shows only the tested symbol, on its 4 timeframes.
10. Version history
1.0 — first release: scanner (30 symbols × 4 timeframes), event log, cross-symbol alerts, trade plan with lot size from risk, all chart features of SMC Structure Map 1.0.
Questions or ideas? Leave a comment on the product page: https://www.mql5.com/en/market/product/209933.



