Liquidity sweeps in MT5 - how to spot them without repainting

Most liquidity sweep markings I see shared on charts look convincing because they were drawn after the fact. The problem starts when you try to find the same thing while it is happening. Half of those "sweeps" were never visible in real time, and some of them only existed because an indicator redrew its levels a few bars later.
This article is about the boring part: a definition that you can check bar by bar, using closed candles only, so that what you mark on Monday still looks the same on Friday.
1. First the pool, then the sweep
A sweep needs something to sweep. That something is a liquidity pool: a price level where many traders have a reason to place stops or entry orders. The classic example is a pair of equal highs. Two highs at nearly the same price invite breakout buy-stops above them and protective stops of short sellers in the same area.
What counts as "equal" is the first decision you have to make. On EURUSD M15 two highs 0.3 pips apart are equal; on gold the same idea needs a few tenths of a dollar. I prefer a tolerance as a fraction of the ATR (for example 0.1 x ATR(14)), because it adapts to the instrument and to the current volatility instead of a fixed number of points.
Other pools that work the same way:
- previous day high and low,
- previous week high and low,
- session highs and lows (Asia, London, New York).
Day and week levels are known the moment the period closes. Equal highs are different: a swing high is only confirmed after a number of candles on its right side have stayed lower. With a swing strength of 3, the high is confirmed three candles later. Keep that delay in mind, it comes back below.
2. What a sweep is, and what it is not
My working definition has two parts, and both must be true on the same closed candle:
- The wick trades beyond the pool (above equal highs, below equal lows).
- The candle closes back on the original side of the level.
If the candle closes beyond the level, it is not a sweep. It is a break, and price has accepted the new area, at least for that candle. Mixing these two up is the most common error I see. A candle that is still open can look like a perfect sweep at minute 12 and close as a clean breakout at minute 15.
The depth of the wick matters as well. One tick through the level and a spike of half an ATR are not the same event. I note two numbers for each sweep: how far the wick went past the level in ATR terms, and how much of the candle range is wick. A shallow poke with a small wick is weak information. A deep wick that leaves most of the candle on the original side says more, but it still says nothing about what happens next.
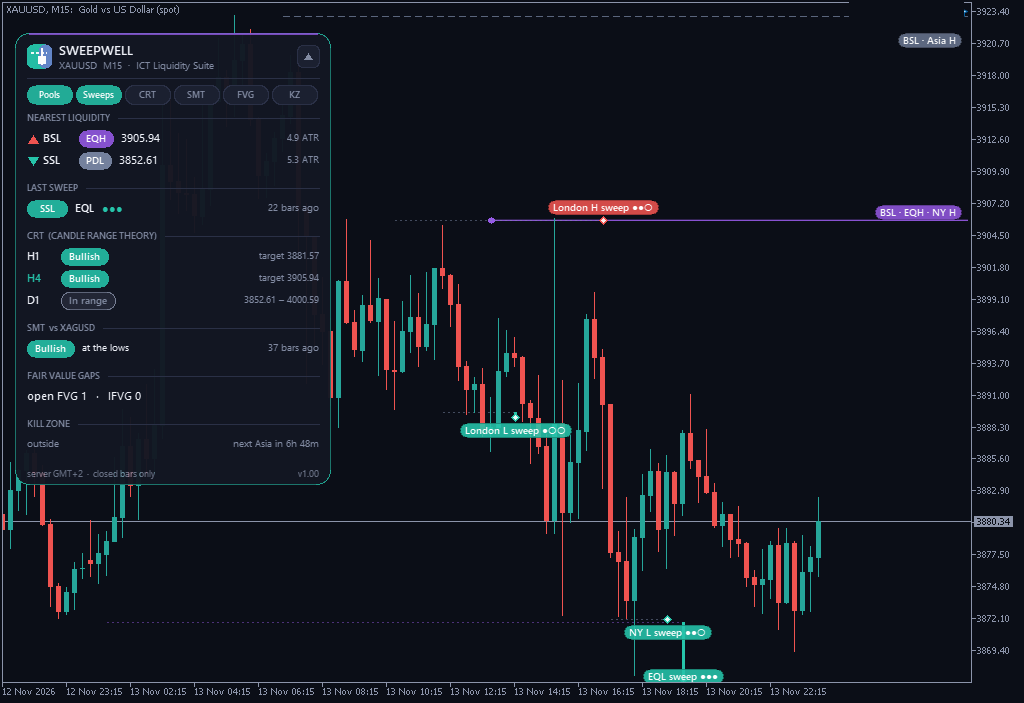
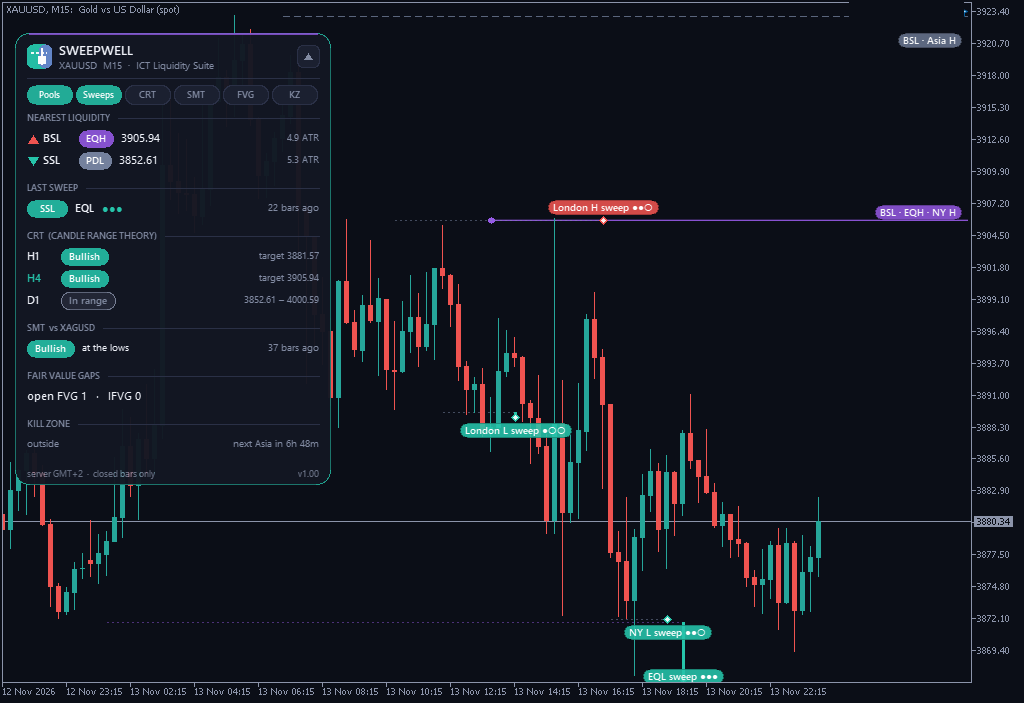
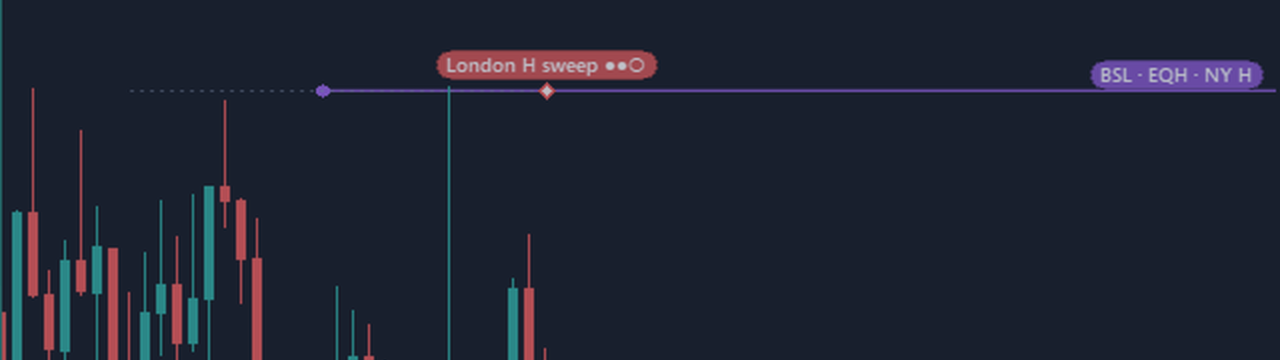
XAUUSD M15, 13 November. The two marked highs near 3905, which were also the London session high, form the pool. One candle spiked through that level and closed back below it. Later in the day the equal lows below were taken the same way. Note that nothing here was marked until the candle had closed.
3. Why "no repainting" is mostly about timing
Repainting is not only a problem of badly written code. It follows directly from the definitions above if you are not careful about when something is allowed to appear.
- Open candle: If a tool evaluates the current bar, it will show a sweep and remove it again when the close changes. Only evaluate bar 1 and older.
- Swing delay: Equal highs exist only after the second high is confirmed. If the tool draws them at the moment of the second high, it has to know the future. A correct tool draws the pool N bars late, and a sweep can only count if it happens after the pool was visible.
- Higher timeframe levels: The previous day high is fixed. "Today's high" is not. Using a level of a period that is still running is another quiet way to repaint.
A simple test for any indicator you use: note the marks on a chart, wait a day, then compare. Even better, run it in the Strategy Tester in visual mode and watch the marks appear bar by bar. If a mark shows up earlier in history than it did in the visual test, the tool looks into the future.
4. Time windows matter more than people think
Sweeps happen all day, but many of them are noise. The ones that people pay attention to tend to cluster around the open of London and the open of New York, the so-called kill zones. The usual reference is New York clock time: roughly 02:00 to 05:00 for London and 07:00 to 10:00 for New York. Your broker's server time is probably different, and it shifts twice a year with daylight saving in Europe and the US on different dates. Check the conversion before you trust any session box on your chart.
A second point: session highs and lows are pools in their own right. The Asian range is often taken during London, and the London extremes during New York. When a sweep lines up with a session level and happens inside one of these windows, it is at least worth a closer look. Outside them, I treat it as background.
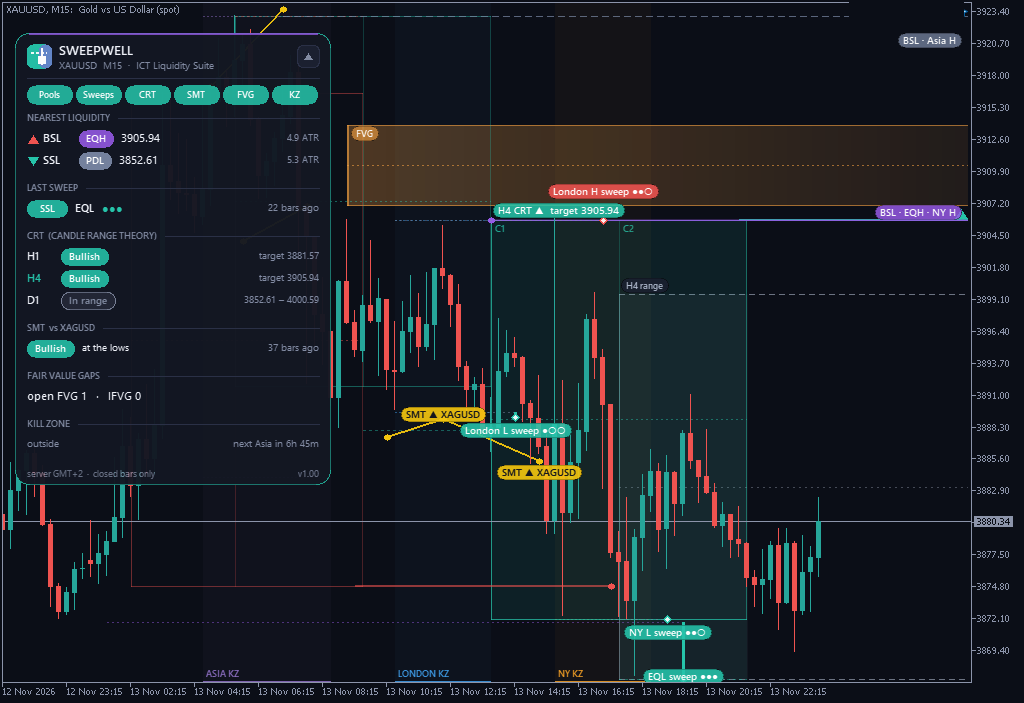
Same chart with the Asia, London and New York windows shaded along the bottom (server time GMT+2). Ignore the other layers; the point is where each sweep sits in the day.
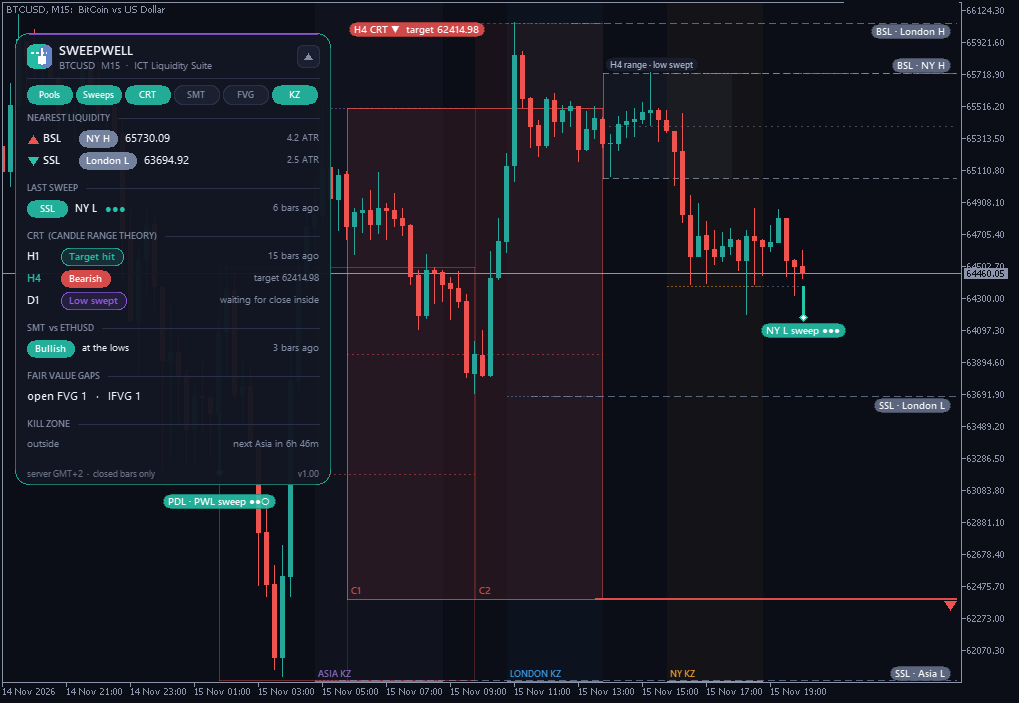
BTCUSD M15, 15 November. Here the pools are session levels (Asia, London, New York highs and lows). The New York low was swept and the candle closed back above it.
5. Typical mistakes
- Calling every wick a sweep. Without a defined pool it is just a wick.
- Acting before the close. The definition needs the close. If you trade the wick, you are trading a guess about the close, which is a different strategy and should be tested separately.
- Ignoring the swing delay. Backtesting with pools that only became visible later inflates every result.
- Treating the sweep as a signal on its own. A sweep describes what happened at a level. Direction of the higher timeframe, where the opposite pool sits, and the time of day decide whether it is relevant for you.
- Wrong time zone. A kill zone that is shifted by one hour is a different filter.
6. A short checklist
- Is the pool defined and was it visible before the sweep candle?
- Did the wick go through and did the same candle close back?
- How deep was the wick in ATR terms?
- Which session, and does the level belong to that session or the previous one?
- Where is the next pool on the other side?
If you write these five answers down for every sweep you mark, after a month you have your own statistics, and that is worth more than any rule from a video, including this article.
About the charts
Disclosure: the charts were made on a demo account with an indicator I developed. A free version (Sweepwell One) and a full version (Sweepwell ICT Liquidity Suite) are available in the MQL5 Market for anyone who wants to compare the marks with their own manual markup.
Risk warning: This article is educational and describes ways of reading past price data. It is not trading advice and no result is promised. Trading leveraged products such as forex, CFDs and crypto carries a high risk of losing more money than you can afford.