XAUUSD Analysis: Liquidity Sweep at 4199 — Is Gold Preparing for Another Bearish Move?

Market Analysis | XAUUSD | M15 | Smart Money Concepts (SMC)
Gold continues to show an interesting battle between buyers and sellers after a strong bearish reaction from the 4199 price area. While buyers have successfully defended the support zone near 4153–4155, the broader intraday structure suggests that a bullish recovery is not yet sufficient to confirm a trend reversal.
Using the Smart Money Concepts approach behind Quantum Naked SMC Prime, let's examine the current market structure, liquidity distribution, and potential trading opportunities.
1. Market Structure: Buyers Are Recovering, but Sellers Still Hold an Important Advantage
On the M15 chart, XAUUSD previously pushed toward the 4199.033 Buy-Side Liquidity (BSL) level before experiencing an aggressive bearish reaction.
This movement highlights an important SMC principle: a breakout above previous highs does not always indicate sustainable bullish continuation. Sometimes, price moves into a liquidity pool before reversing sharply.
After the rejection from 4199, gold declined toward the 4154 support area, where buyers began to respond.
The latest chart snapshot shows a recovery toward approximately 4174.962, suggesting that buyers are attempting to regain short-term control.
However, one important question remains:
Can buyers reclaim the equilibrium level and sustain price above it, or is this recovery simply a retracement before another bearish expansion?
2. Liquidity Map: Important Levels to Monitor
The current M15 dealing range provides several important reference points:
| Price Level | Market Significance |
|---|---|
| 4199.033 | Major Buy-Side Liquidity |
| 4185–4192 | Potential premium sell zone |
| 4176.863 | M15 Equilibrium (50%) |
| 4174.962 | Latest chart reference price |
| 4154.692 | Near-term Sell-Side Liquidity |
| 4130.388 | Lower liquidity target |
Price is currently positioned near the M15 equilibrium, where the risk-to-reward profile is less attractive for initiating a new short position.
From an SMC perspective, location matters just as much as direction.
Selling directly into support can be dangerous, even when the broader structure appears bearish.
The objective is not to predict every movement, but to wait for price to reach a location where liquidity, structure, and confirmation align.
3. Momentum: A Recovery Without Strong Trend Confirmation
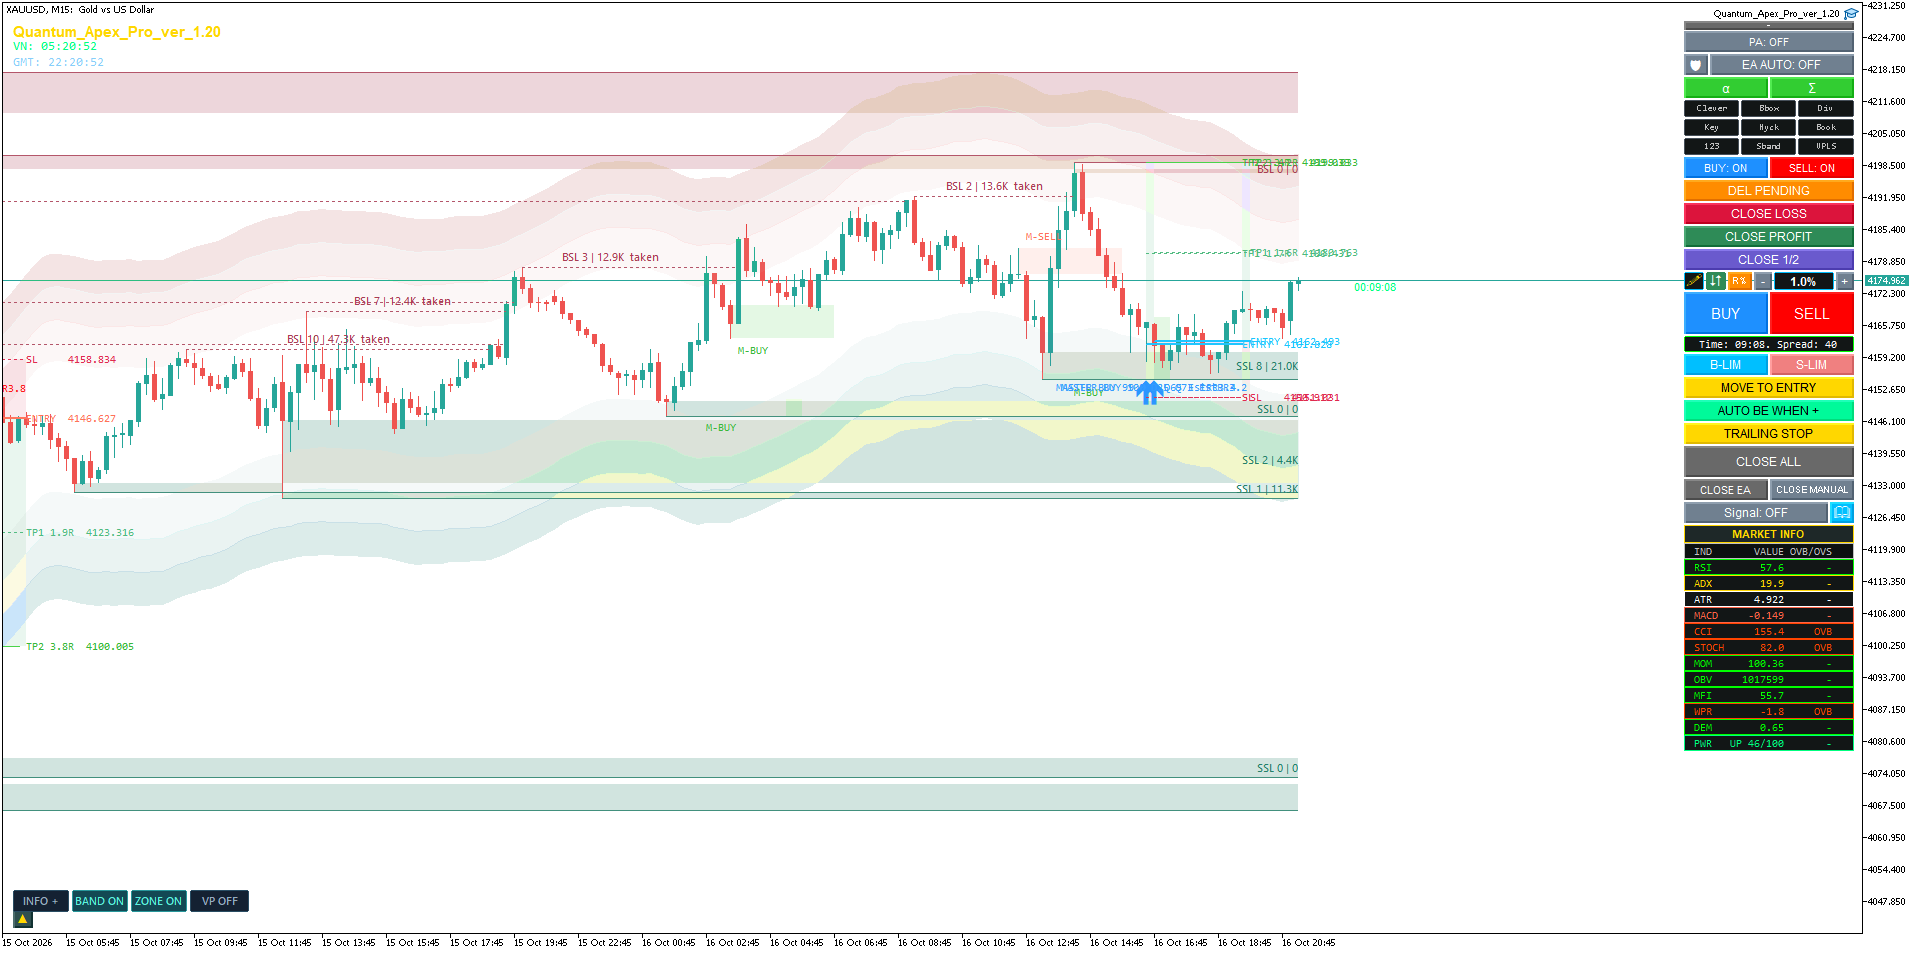
The chart's market information panel provides additional context:
-
RSI: 57.6 — Short-term bullish momentum is recovering.
-
ADX: 19.9 — Trend strength remains relatively weak.
-
Stochastic: 82.0 — Momentum is approaching an overbought condition.
-
MACD: -0.149 — Momentum remains close to neutral.
These readings suggest a recovering market rather than a fully confirmed bullish reversal.
Importantly, an overbought Stochastic reading alone is not a reason to sell.
For a higher-quality bearish setup, price action must confirm that buyers are losing control at a meaningful liquidity level.
4. Primary Trading Scenario: Waiting for a Premium Rejection
Primary Bias: BEARISH — Conditional
The preferred scenario is a recovery toward the 4185–4199 area, followed by evidence of bearish rejection.
A potential setup would require the following sequence:
-
Price approaches the premium zone or raids nearby Buy-Side Liquidity.
-
Buyers fail to establish sustained acceptance above resistance.
-
Bearish displacement appears on M5/M15.
-
A Market Structure Shift (MSS/CHoCH) confirms the change in short-term order flow.
-
A controlled retest offers an entry location with an acceptable risk-to-reward ratio.
If these conditions develop, the first downside liquidity objective would be 4154.692, followed by 4130.388.
However, if H1/H4 establishes sustained acceptance above 4217.430, the current bearish thesis should be abandoned and market structure reassessed.
No confirmation means no trade.
5. Why I Use Quantum Naked SMC Prime in My Market Analysis
Successful SMC analysis requires more than identifying support and resistance.
Traders need to understand where liquidity may be concentrated, how price reacts around important zones, and whether market structure confirms the intended direction.
That is the analytical philosophy behind Quantum Naked SMC Prime for MetaTrader 5.
Rather than relying on isolated indicator signals, I focus on combining liquidity behavior, market structure, price location, and disciplined execution.
An indicator should support the decision-making process, not replace it.
Whether you are trading XAUUSD manually or studying Smart Money Concepts, learning to distinguish a genuine structural shift from a temporary liquidity reaction can make your analysis more consistent.
Explore Quantum Naked SMC Prime on MQL5 Market:
https://www.mql5.com/en/market/product/198058
Final Outlook
XAUUSD Bias: BEARISH, but WAIT for confirmation.
The 4199 liquidity area remains a significant resistance reference, while the 4154–4130 region represents important downside liquidity.
For now, patience is more valuable than chasing price.
The next meaningful opportunity may develop when gold returns to a premium location and confirms whether sellers are still in control.
Note: This analysis is based on the supplied historical chart snapshot from October 16, 2026, not verified live prices for October 19. The market structure and levels must be reassessed as new trading data becomes available. For educational and research purposes only, not financial advice.
#XAUUSD #GoldTrading #SmartMoneyConcepts #SMC #LiquiditySweep #PriceAction #MarketStructure #MetaTrader5 #MQL5 #QuantumNakedSMCPrime