

Pre-Asia Institutional Gold (XAU/USD) Market Analysis
Session Context: Pre-Asian Liquidity Window / Early Wednesday APAC Transition
Current Spot Price: $4,640 – $4,655 / oz
Market Stance: Short-term consolidation / high-level digestion following Tuesday's pullback from fresh multi-month highs near $4,696.
1. Market Snapshot & Price Action
-
Spot XAU/USD: Trading around $4,642 following a slight intraday pullback (-0.2% to -0.8% range across sessions) from its $4,696 peak.
-
Session Structure: Price action overnight displayed a healthy profit-taking pause. Trend-following macro algorithms are defending the $4,620 – $4,630 demand floor into the Asian open.
2. Core Macro Drivers Ahead of APAC Open
-
Yield & Dollar Stabilization: The U.S. Dollar Index (DXY) saw mild safe-haven flows during the U.S. afternoon, checking gold's immediate momentum. Institutional desks are managing exposure ahead of U.S. PCE Inflation data and Federal Reserve speeches.
-
Physical & Sovereign Flow: Central bank buying and geopolitical risk premiums continue to maintain an elevated structural floor above $4,600. Minor sell-offs are being absorbed by passive institutional bid blocks rather than aggressive liquidation.
3. Key Technical Levels for the Asian Session
| Technical Level | Price Zone (USD) | Institutional Significance |
| Major Resistance 2 | $4,700 – $4,710 | Major options strike barrier and psychological breakout expansion level. |
| Immediate Resistance 1 | $4,680 – $4,696 | Tuesday intraday peak; primary liquidity hunt target for bulls. |
| Session Pivot | $4,645 – $4,655 | Balance zone for early Sydney/Tokyo desks. |
| Key Support 1 | $4,618 – $4,625 | Asian session demand shelf & 20-period H4 SMA confluence. |
| Major Support 2 | $4,595 – $4,600 | Major structural swing low and line in the sand for short-term bullish momentum. |
4. Asian Session Tactical Playbook
-
The Expected Range: Expect a tight $4,620 – $4,675 range during early APAC hours as regional desks digest overnight U.S. moves. Volume is typically thin before European open, making sudden spikes around the $4,620 floor prime candidates for mean-reversion retests.
-
Bullish Execution: Look for long re-entries on confirmed rejection wicks at $4,620–$4,630 targeting a retest of $4,680+.
-
Bearish Execution: Structural invalidation of the bullish bias occurs only on an H4 close below $4,595, which would trigger systematic stop-loss runs down to $4,550.
An overbought oscillator (RSI above 70, Stochastic above 80) does not mean "sell immediately". In spot gold (XAU/USD), strong macro trends cause momentum indicators to stay pegged in overbought territory for hours or days while price continues to surge.
To trade gold successfully across timeframes, an oscillator overbought signal must be interpreted through the lens of that specific chart's market noise and liquidity profile.
The 4-Hour (4H) Chart: Macro Trend & Reversal Zone
-
Role: Context & Structural Trend Identification.
-
Noise Level: Low. Signal frequency is scarce, but reliability is very high.
How Overbought Behaves on 4H:
When the 4H oscillator reaches overbought territory (e.g., RSI > 70), it indicates extreme institutional strength. In a established uptrend, counter-trend shorting here is dangerous because price frequently consolidation-flats or grinds higher.
Trading Execution:
-
Trend Market (Avoid Shorts): Do not short an overbought 4H reading during an active bull trend. Instead, note that momentum is strong and wait for a 4H pullback to cool the oscillator down to neutral (40–50) to enter a long position.
-
Range Market (Reversal Setup): If 4H price is at key structural resistance and the oscillator forms a bearish divergence (higher price high, lower oscillator high), prepare for a multi-day swing short.
The 1-Hour (1H) Chart: Session Bias & Swing Execution
-
Role: Intraday Trend Direction & Swing Entries.
-
Noise Level: Moderate. Excellent balance between signal frequency and trend reliability.
How Overbought Behaves on 1H:
The 1H chart reflects session liquidity (London and New York runs). An overbought signal here usually marks the temporary high of a single trading session rather than a multi-week peak.
Trading Execution:
-
Trend Alignment: If the 4H chart is bullish, ignore 1H overbought signals as short triggers. Instead, wait for the 1H oscillator to pull back to oversold (<30/20) to buy in the direction of the 4H trend.
-
Intraday Counter-Trend: If 4H is neutral/ranging and 1H hits overbought at a daily high or key Fibonacci extension level, look for a bearish candlestick confirmation (e.g., bearish engulfing or pin bar) to short a pullback toward the 20-period EMA.
The 15-Minute (15M) Chart: Precision Scalping & Liquidity Sweeps
-
Role: Entry Timing, Liquidity Sweeps, and Scalping.
-
Noise Level: High. Frequent false overbought signals due to intraday volatility spikes.
How Overbought Behaves on 15M:
On a 15M chart, gold can spike into overbought conditions instantly on economic releases or session opens. Using an overbought reading in isolation on 15M leads to constant "whipsaws."
Trading Execution:
-
Liquidity Sweep & Divergence: Wait for price to sweep previous session highs (stop-hunting). If 15M price makes a quick high while the 15M oscillator makes a noticeably lower high (bearish divergence), execute a fast mean-reversion short.
-
Quick Take-Profit Target: Target the nearest 15M structural low or 15M 20 EMA. Keep stop-losses tight (just above the sweep wick).
Key Comparison
| Feature | 4-Hour (4H) Chart | 1-Hour (1H) Chart | 15-Minute (15M) Chart |
| Primary Purpose | Macro Trend / Major Reversals | Session Bias & Swing Setup | Trigger Execution & Scalping |
| Overbought Meaning | Powerful institutional momentum | Session-level overextension | Intraday exhaustion / liquidity sweep |
| Action on Trend Overbought | Do not short; wait for cooling | Wait for pullback to buy | Scalp short only on divergence |
| Average Hold Time | Days to Weeks | Hours to 1-2 Days | 15 Minutes to 4 Hours |
The Golden Rule of Oscillator Confluence
Always use a top-down alignment:
-
Identify 4H structure: Is gold trending up, down, or ranging?
-
Consult 1H momentum: Is 1H pulling back to confirm the 4H direction?
-
Execute on 15M: Use 15M overbought/oversold extreme signals only when they align with higher-timeframe key levels and trend structure.
Coming Soon our EA Based on This:
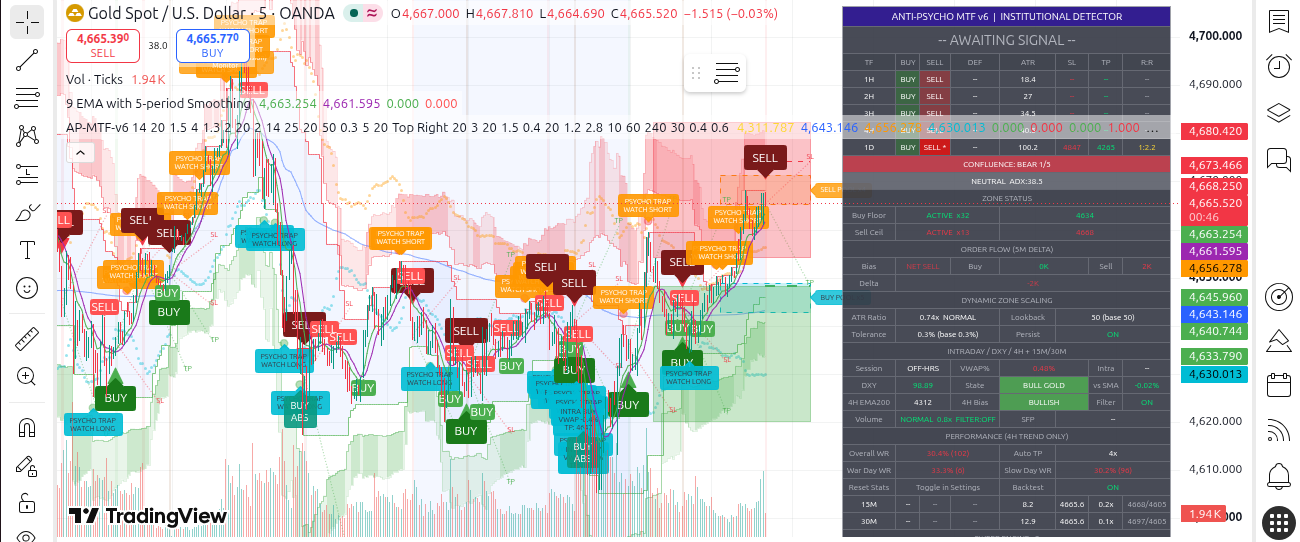
How Our EAs enter TRades:





![[EURUSD]: Weekly Liquidity Activation Points (LAP), October 12-16, 2026](https://c.mql5.com/6/1035/splash-preview-777305.png "[EURUSD]: Weekly Liquidity Activation Points (LAP), October 12-16, 2026")
![[Nasdaq]: Weekly Liquidity Activation Points (LAP), October 12-16, 2026](https://c.mql5.com/6/1035/splash-preview-777311.png "[Nasdaq]: Weekly Liquidity Activation Points (LAP), October 12-16, 2026")
![[XAUUSD]: Weekly Liquidity Activation Points (LAP), October 12-16, 2026](https://c.mql5.com/6/1035/splash-preview-777299.png "[XAUUSD]: Weekly Liquidity Activation Points (LAP), October 12-16, 2026")