THIS IS A BASIC OVERVIEW OF THE BENEFITS, FEATURES AND PARAMETERS OF THIS INDICATOR.
BUT PLEASE BE SURE TO CONTACT US AFTER YOUR PURCHASE. AND WE WOULD BE HAPPY
TO SEND YOU MANY MORE DETAILS REGARDING THIS INDICATOR AND THE BEST
WAYS TO USE IT. INCLUDING ADVICE ON THE BEST PAIRS TO MONITOR,
BEST TIME FRAMES, BEST SETTINGS ETC.
AS WELL AS SOME VERY, VERY IMPORTANT TRADING INFORMATION.
FOR ACHIEVEING THE BEST RESULTS IN YOUR LONG TERM TRADING CAREER.
STRONG VS WEAK
(ULTIMATE STRENGTH METER)
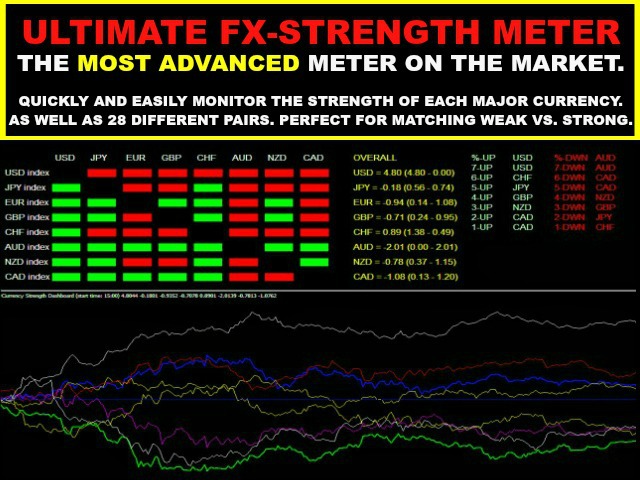
This indicator has been specifically designed for measuring the strength of the 8 major currencies (USD, EUR, GBP, JPY, CHF, AUD, NZD and CAD). Allowing you to quickly select the best pairs to trade (Strong VS Weak).
This indicator provides an EXCELLENT way to trade particular trading sessions. And a great way to trade the news events.
As it represents current (real time) conditions. And you can select at which time you would like for it to begin monitoring.
For example:
You can choose to begin monitoring at the beginning of the European session. Or the beginning of the New York session etc.
Or you can choose a specific time to begin monitoring. Such as after the release of economic data.
Features:
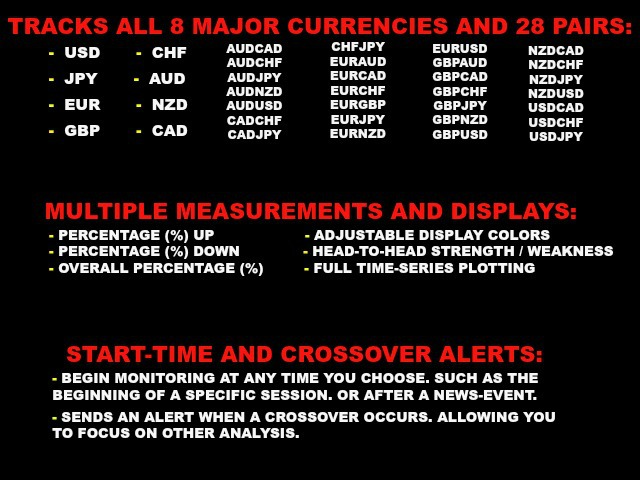
- Easily monitor the strength of the 8 major currencies and all 28 pairs. USD, EUR, JPY, GBP, CHF, AUD, NZD and CAD
- Unlike most strength meters, this meter measures each currency against a weighted basket of its peers.
- You can select the precise time to begin calculating values.
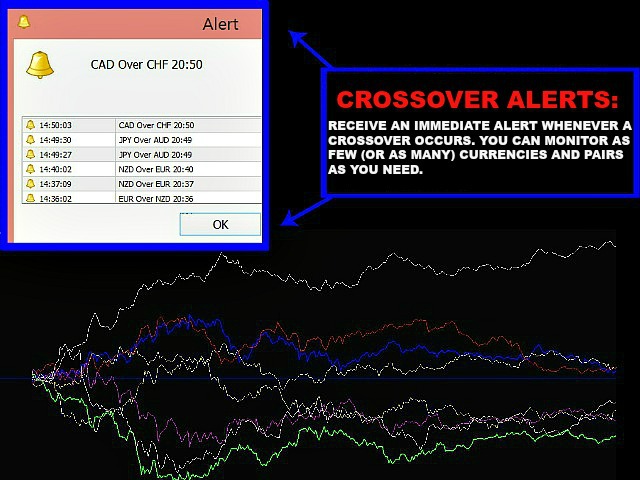
- The indicator can trigger real time crossovers alerts.
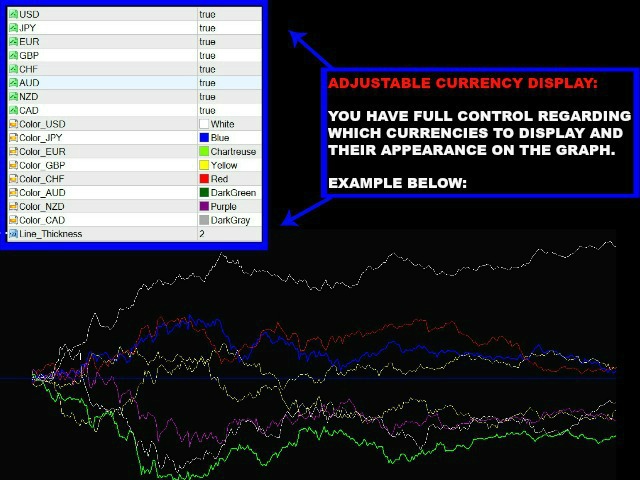
- You have full control of the colors and currencies to be displayed.
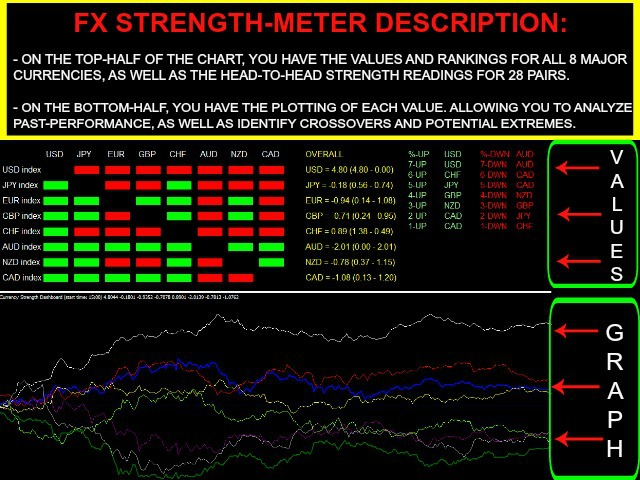
- Plotted graph allows you to analyze when crossovers occurred, as well as anticipate any potential extremes.
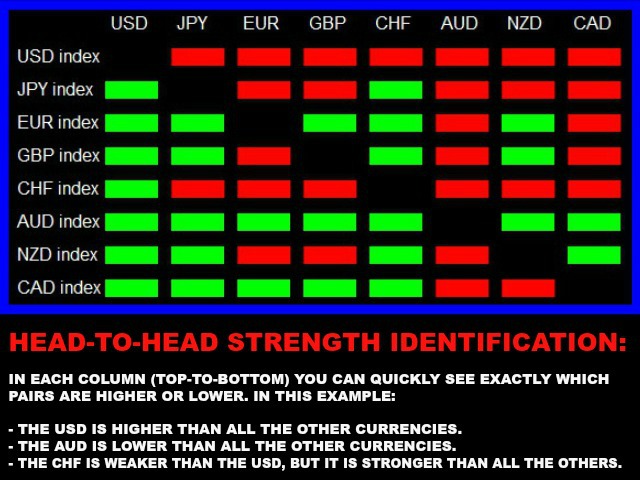
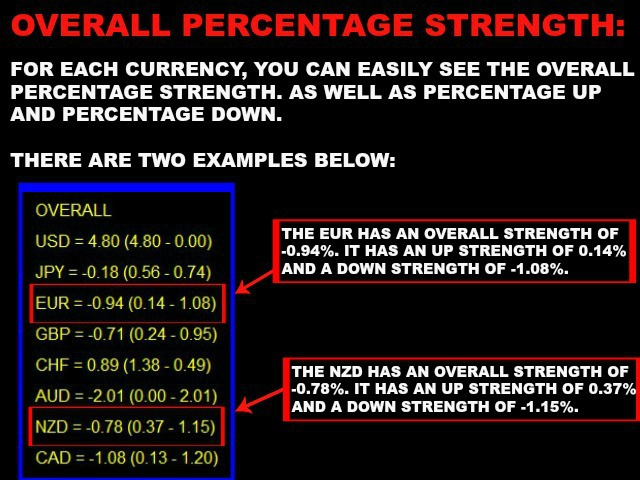
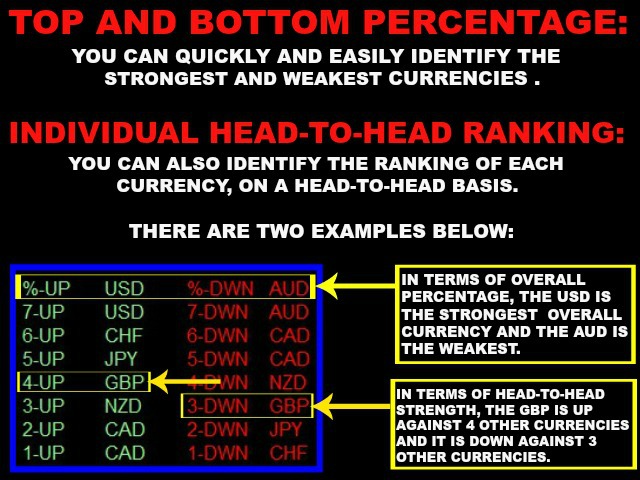
- Full analysis of up / down percentage values, as well as head to head comparisons between currencies.
- This indicator only needs to be placed on one chart and it will simultaneously monitor the entire market, all on one screen.
This will save you an enormous amount of time and effort. As you won't have to flip through dozens of charts for analysis.
And this will allow you to focus on other aspects of your trading. Such as further technical (or fundamental analysis).
This will also give you more time to find other trading opportunities.
Indicator Parameters:
- Use Alert: True = Alerts On, False = Alerts Off
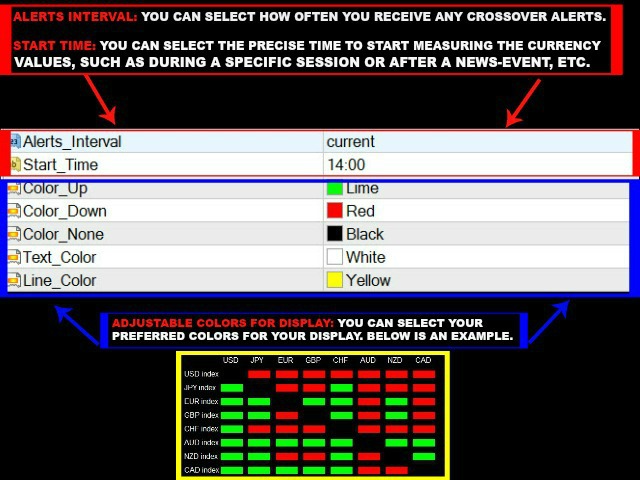
- Alerts Interval: Choose interval for receiving crossover alerts.
- Start Time: Select the time to begin calculating the values.
- Color Up: The color for a currency that is higher in value.
- Color Down: The color for a currency that is lower in value.
- Color None: The color for the empty rows.
- Text Color: The color for the text in the head-to-head display area.
- Line Color: The color for the text in the overall percentage area.
- Text Size: The font size for the overall text.
- Xspace: The horizontal spacing in the head-to-head display area.
- Yspace: The vertical spacing in the head-to-head display area.
- Xoverall: The location for the overall percentage area.
- Xconclusion: The location for the ranking area.
- Space_y: The vertical spacing in the ranking area.
- Space_x: The horizontal spacing in the ranking area.
- Currency Selection: True = Display, False = Do not display
- Currency colors: Color to assign to each currency.
- Line Thickness: Thickness of the lines in the graph.
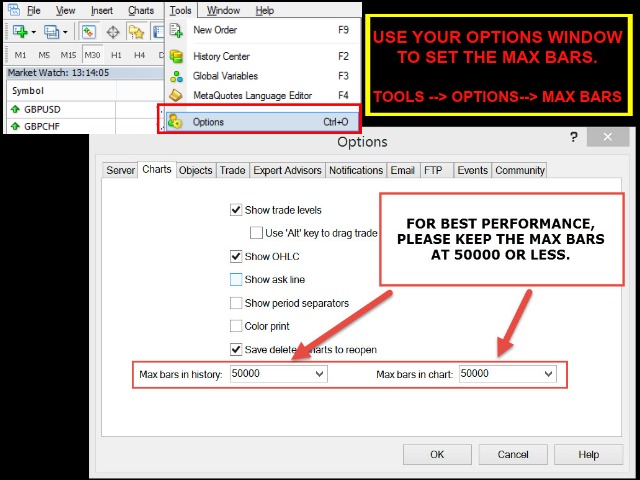
For best performance, make sure to set your 'max bars' to 50000 or less.
And apply the indicator to your 1 minute chart.
See the images below for further details and contact us if you have any questions.
We reply to all questions within 24 hours. And depending on the total volume
of inquiries that we have, we can sometimes answer in less than 1 hour.
Even on weekends and holidays.
We are always here to help. =)

