
Separate optimization of a strategy on trend and flat conditions

Contents
- Introduction
- Concept of separate optimization
- Selecting a trend-following trading strategy
- Testing the trading strategy
- Selecting a flat-based strategy
- Testing the flat-based strategy
- Combined strategy
- Summary
- Conclusion
Introduction
When developing trading strategies, the first task is setting market entry conditions, position tracking method and exit point. Various mathematical, statistical and other analytical methods are applied for that. They are often reinforced with ready-made autonomous systems used to assess market characteristics in the form of indicators. One of the main issues when developing any trading strategy is the lack of versatility. A trading system is not able to work in all possible market conditions with equal efficiency. Therefore, traders usually select conditions for detecting certain (potentially profitable) market conditions when developing Expert Advisors.
Besides, each trading system has its drawbacks. Trend-following strategies fail during prolonged flat movements, while flat-based ones provide false entries during strong directional movements. To reduce the effect of false signals and improve profitability, the systems are made flexible, meaning they have some specific set of settings or input data, which is justified because the market behavior is constantly changing.
Over time, any trading system becomes less efficient and therefore, there is a need to adapt its parameters to new conditions. The built-in MetaTrader 5 Strategy Tester is meant to tackle this issue. This tool helps analyzing the performance of any trading EA on history and define optimal settings for their further use as a basis in real trading.
Concept of separate optimization
In this article, we will consider applying the Strategy Tester in a broader sense. Obviously, the majority of trading systems trade in two directions (buying and selling under certain conditions). The Fig. 1 shows a simple example of a trading strategy in action under perfect conditions. Its idea is simple — buy at a low price and sell at a high one.
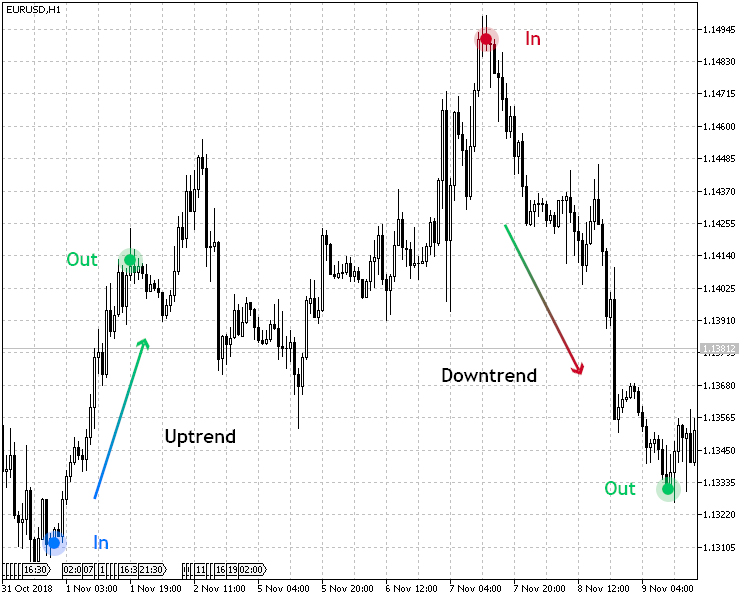
Fig.1. Trend-following strategy in action
Usually, one set of settings is used to determine the uptrend and downtrend in such a system, and the entry conditions are mirrored. But the point is that the specifics of the market growth and fall can be very different in many characteristics, such as speed and duration. In this regard, I propose considering a system that determines market entries separately for uptrend and downtrend conditions.
To achieve this, we will need two sets of parameters defining market entry and exit conditions. At this point, we come to the very concept of "separate optimization".
Separate optimization means defining trading system's optimal parameters using the Strategy Tester for an uptrend and downtrend separately.
To test the separate optimization, I decided to choose two trading systems: trend-following and flat-based ones. In the trend-following strategy, we will optimize up and downtrend separately, while in the flat-based one, we will assess separate optimization of trading in a channel.
Selecting a trend-following trading strategy
I am going to use J. F. Ehlers' Center of Gravity indicator represented by a colored OSMA histogram (CenterOfGravityOSMA) to test a separate optimization. Its signal is confirmed by the indicator that calculates the Average Speed of the price.
| Parameter | Description |
|---|---|
| Applied indicator | CenterOfGravityOSMA |
| Applied indicator | Average Speed |
| Timeframe | H1 |
| Buy conditions | The histogram of the Gravity Center shows growth (the indicator value is less than zero), and the Average Speed value is above the threshold (pre-set in the parameters) |
| Sell conditions | The histogram of the Gravity Center shows drop (the indicator value is greater than zero), and the Average Speed value is above the threshold (pre-set in the parameters) |
| Exit conditions | Take Profit/Stop Loss |
The strategy is presented visually in Fig. 2. As can be seen from the table above, the trading strategy has clearly defined conditions for entering the market when buying and selling. Since this is a trend-following strategy, the buy conditions correspond to an uptrend, while the sell conditions correspond to a downtrend.
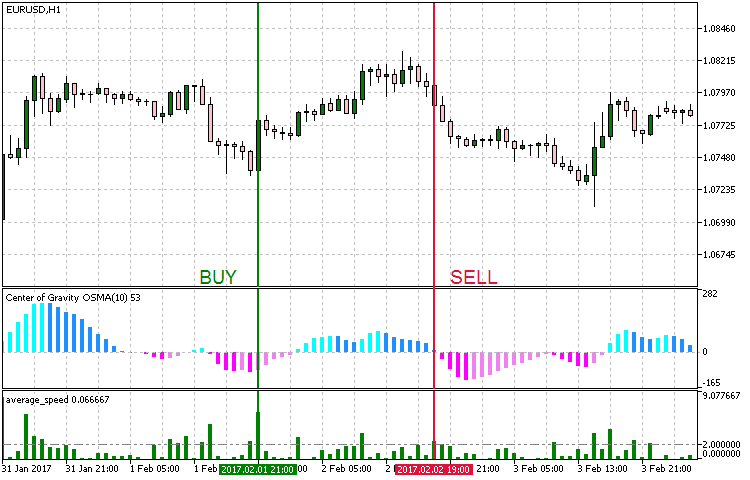
Fig. 2. Entry conditions for the trend-following strategy
When implementing the strategy in MetaEditor, we should set the EA working conditions so that it can be used only during an uptrend, only during a downtrend or in both cases.
We should also take into account the following:
- Ability to manage test modes for upward and downward trends, as well as for both cases.
- For a separate optimization, it is necessary to use the EA separately for an uptrend, a downtrend and a joint operation;
- Uptrend and downtrend should feature their own separate parameters. This is necessary in order to use them in joint trading;
To fulfill these EA development conditions, enter the following code:
//+------------------------------------------------------------------+
//| Operation modes enumeration                                      |
//+------------------------------------------------------------------+
enum Trend_type
  {
   UPTREND = 1,            //Uptrend
   DOWNTREND,              //Downtrend
   BOTH                    //Both trends
  };
The input set looks as follows:
//+------------------------------------------------------------------+
//| EA inputs                                                        |
//+------------------------------------------------------------------+
input string               Inp_EaComment="Trend Strategy";              //EA Comment
input double               Inp_Lot=0.01;                                //Lot
input MarginMode           Inp_MMode=LOT;                               //MM

input Trend_type           Inp_Trend_type=3;                            //Trend type
//--- Uptrend parameters
input string               Inp_Str_label1="===Uptrend parameters===";   //Label
input int                  Inp_MagicNum1=1111;                          //Magic number
input int                  Inp_StopLoss1=40;                            //Stop Loss(points)
input int                  Inp_TakeProfit1=60;                          //Take Profit(points)

//--- CenterOfGravityOSMA indicator parameters
input uint                 Period_1=9;                                  //Averaging period
input uint                 SmoothPeriod1_1=3;                           //Smoothing period1
input ENUM_MA_METHOD       MA_Method_1_1=MODE_SMA;                      //Averaging method1
input uint                 SmoothPeriod2_1=3;                           //Smoothing period2
input ENUM_MA_METHOD       MA_Method_2_1=MODE_SMA;                      //Averaging method2
input Applied_price_       AppliedPrice1=PRICE_OPEN_;                   //Applied price

//--- Average Speed indicator parameters
input int                  Inp_Bars1=1;                                 //Days
input ENUM_APPLIED_PRICE   Price1=PRICE_CLOSE;                          //Applied price
input double               Trend_lev1=2;                                //Trend Level

//--- Downtrend parameters
input string               Inp_Str_label2="===Downtrend parameters==="; //Label
input int                  Inp_MagicNum2=2222;                          //Magic number
input int                  Inp_StopLoss2=40;                            //Stop Loss(points)
input int                  Inp_TakeProfit2=60;                          //Take Profit(points)

//--- CenterOfGravityOSMA indicator parameters
input uint                 Period_2=9;                                  //Averaging period
input uint                 SmoothPeriod1_2=3;                           //Smoothing period1
input ENUM_MA_METHOD       MA_Method_1_2=MODE_SMA;                      //Averaging method1
input uint                 SmoothPeriod2_2=3;                           //Smoothing period2
input ENUM_MA_METHOD       MA_Method_2_2=MODE_SMA;                      //Averaging method2
input Applied_price_       AppliedPrice2=PRICE_OPEN_;                   //Applied price

//--- Average Speed indicator parameters
input int                  Inp_Bars2=1;                                 //Days
input ENUM_APPLIED_PRICE   Price2=PRICE_CLOSE;                          //Applied price
input double               Trend_lev2=2;                                //Trend Level
As we can see in the code, the Inp_Trend_type variable is responsible for selecting the EA operation mode, while inputs for the Uptrend and Downtrend modes are separated to 'Uptrend parameters' and 'Downtrend parameters' accordingly. When choosing the Both mode, the inputs from both sections are used, while the main logic implementation code is provided in the following listing:
//+------------------------------------------------------------------+
//| Expert tick function                                             |
//+------------------------------------------------------------------+
void OnTick()
  {
//--- Get data for calculation

   if(!GetIndValue())
      return;

   if(Inp_Trend_type==1 && !Trade.IsOpenedByMagic(Inp_MagicNum1))
     {
      //--- Open order if there is a buy signal
      if(BuySignal())
         Trade.BuyPositionOpen(Symbol(),Inp_Lot,Inp_StopLoss1,Inp_TakeProfit1,Inp_MagicNum1,Inp_EaComment);
     }
   else if(Inp_Trend_type==2 && !Trade.IsOpenedByMagic(Inp_MagicNum2))
     {
      //--- Open order if there is a sell signal
      if(SellSignal())
         Trade.SellPositionOpen(Symbol(),Inp_Lot,Inp_StopLoss2,Inp_TakeProfit2,Inp_MagicNum2,Inp_EaComment);
     }
   else if(Inp_Trend_type==3)
     {
      //--- Open order if there is a buy signal
      if(BuySignal() && !Trade.IsOpenedByMagic(Inp_MagicNum1))
         Trade.BuyPositionOpen(Symbol(),Inp_Lot,Inp_StopLoss1,Inp_TakeProfit1,Inp_MagicNum1,Inp_EaComment);
      //--- Open order if there is a sell signal
      if(SellSignal() && !Trade.IsOpenedByMagic(Inp_MagicNum2))
         Trade.SellPositionOpen(Symbol(),Inp_Lot,Inp_StopLoss2,Inp_TakeProfit2,Inp_MagicNum2,Inp_EaComment);
     }
  }
//+------------------------------------------------------------------+
//| Buy conditions                                                   |
//+------------------------------------------------------------------+
bool BuySignal()
  {
   return(avr_speed1[0]>Trend_lev1 && cog1[1]<cog1[0] &&(cog1[1]<0 && cog1[0]<0))?true:false;
  }
//+------------------------------------------------------------------+
//| Sell conditions                                                  |
//+------------------------------------------------------------------+
bool SellSignal()
  {
   return(avr_speed2[0]>Trend_lev2 && cog2[1]>cog2[0] &&(cog2[1]>0 && cog2[0]>0))?true:false;
  }
//+------------------------------------------------------------------+
//| Get the current indicator values                                 |
//+------------------------------------------------------------------+
bool GetIndValue()
  {
   return(CopyBuffer(InpInd_Handle1,0,0,2,cog1)<=0 ||
          CopyBuffer(InpInd_Handle2,0,0,2,cog2)<=0 ||
          CopyBuffer(InpInd_Handle3,0,0,2,avr_speed1)<=0 ||
          CopyBuffer(InpInd_Handle4,0,0,2,avr_speed2)<=0
          )?false:true;
  }
//+------------------------------------------------------------------+
The trading rules are simple for the Uptrend and Downtrend modes: buy during an uptrend and sell during a downtrend, i.e. follow the trend. In the Both mode, these systems work together and independently from each other with their unique input parameters — Uptrend+Downtrend.
Testing the trading strategy
For testing and separate optimization of a selected strategy, it would be reasonable to select crystal-clear uptrend periods for the Uptrend mode and downtrend periods for the Downtrend one. Therefore, I have decided to select the following time periods displayed in Fig. 3.
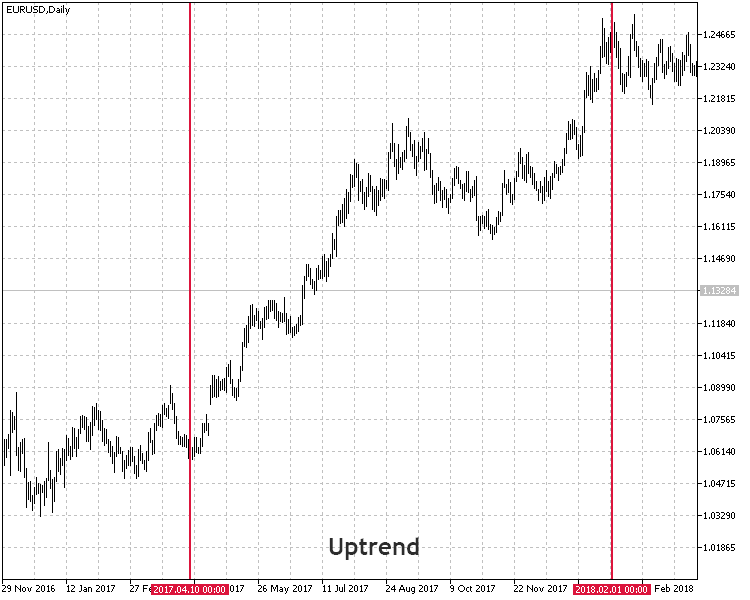
Fig. 3. Time periods selected for a test
So, let's summarize the test settings.
- Interval: For Uptrend mode: 10.04.2017 — 01.02.2018. For Downtrend mode: 08.05.2014 — 13.03.2015.
- Symbol: EURUSD.
- Trading mode: No delay. These are not high-frequency trading strategies, so the effect of delays would be very small.
- Testing: М1 OHLC. Pre-testing on real ticks shows nearly the same results.
- Initial deposit: 1000 USD.
- Leverage: 1:500.
- Server: MetaQuotes-Demo.
- Quotes: 5-digit.
The objectives of testing and optimization are the parameters of indicators used in the strategy, as well as take profit and stop loss values.
The optimization results for an uptrend are as follows:
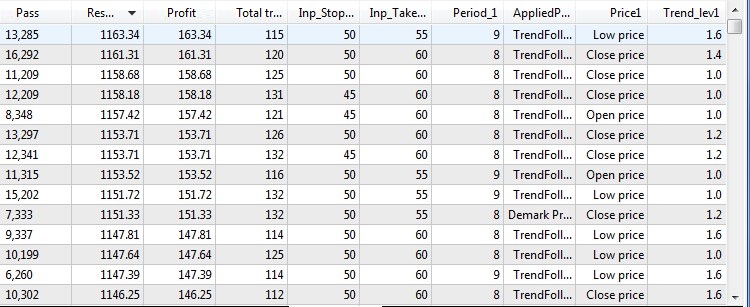
Fig. 4. Test and optimization results on the uptrend
The optimization results for a downtrend are as follows:
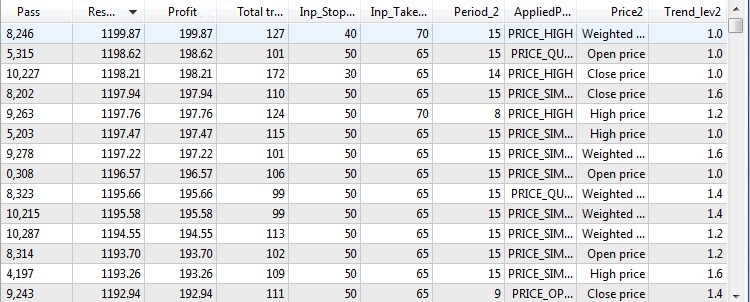
Fig. 5. Test and optimization results on the downtrend
After defining the best parameters using optimization on the time intervals favorable for the selected modes, it is time to try these parameters on a mixed interval having both upward and downward trends. This will allow us to test the trading strategy versatility.
I have decided to choose the following time interval, which is quite suitable for the requests mentioned above.
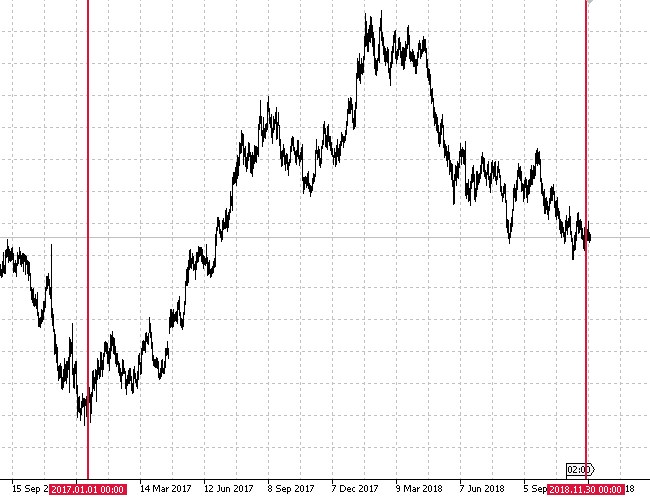
Fig. 6. Selected time period for mixed testing
As we can see on Fig. 6, this time interval features both upward and downward trends with roll-backs and flat movements. Now let's see how the EA will behave on an unfamiliar period of history.
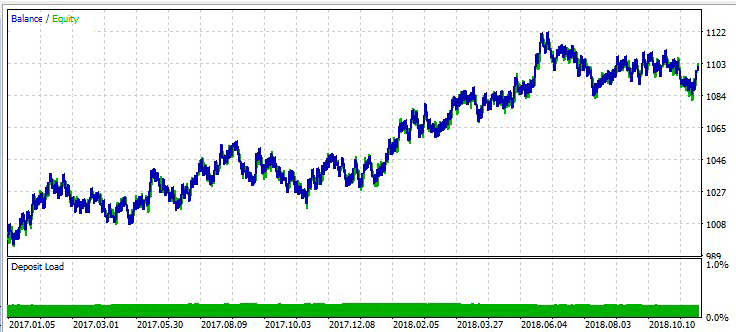
Fig. 7. Test results of the optimized trend-following strategy on the unfavorable interval
Considering test results of this trend-following strategies, we can make the following observations:
- The strategy has demonstrated a positive result on an unfavorable interval.
- The percentage of successful long trades has turned out to be of higher quality than the percentage of short ones.
- Also, such parameters as Profitability and Expected payoffs have shown that the strategy generally demonstrated a positive dynamics on this test interval.
Selecting a flat-based strategy
To perform a separate optimization on a flat market, I have selected Williams's Percent Range determining the overbought/oversold state. This tool is to be used as the main indicator to search for entries. ADX trend-following indicator will be used as trend absence confirmation.
| Parameter | Description |
|---|---|
| Applied indicator | Williams Percent Range |
| Applied indicator | ADX |
| Timeframe | H1 |
| Buy conditions | The WPR indicator is in the oversold zone (below -80) and the ADX value is below the threshold. |
| Sell conditions | The WPR indicator is in the overbought zone (above -20) and the ADX value is below the threshold. |
| Exit conditions | Take Profit/Stop Loss |
Fig. 8 provides a visual example of entering the market according to that strategy.
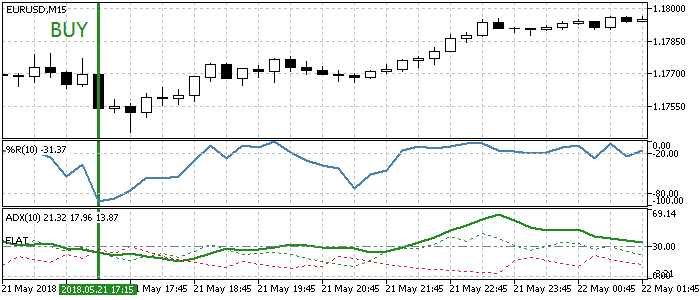
Fig. 8. Entry conditions according to the flat strategy
Based on the chosen strategy, separate optimization will be carried out by transaction types: in Buy and Sell modes.
//+------------------------------------------------------------------+
//| Operation modes enumeration                                      |
//+------------------------------------------------------------------+
enum Trend_type
  {
   UPTREND = 1,            //Buy
   DOWNTREND,              //Sell
   BOTH                    //Both
  };
This way, it is possible to determine how the chosen strategy behaves in flat conditions. The EA code listing is provided below:
//+------------------------------------------------------------------+
//| Expert tick function                                             |
//+------------------------------------------------------------------+
void OnTick()
  {
//--- Get data for calculation

   if(!GetIndValue())
      return;

   if(Inp_Trend_type==1 && !Trade.IsOpenedByMagic(Inp_MagicNum1))
     {
      //--- Open order if there is a buy signal
      if(BuySignal())
         Trade.BuyPositionOpen(Symbol(),Inp_Lot,Inp_StopLoss1,Inp_TakeProfit1,Inp_MagicNum1,Inp_EaComment);
     }
   else if(Inp_Trend_type==2 && !Trade.IsOpenedByMagic(Inp_MagicNum2))
     {
      //--- Open order if there is a sell signal
      if(SellSignal())
         Trade.SellPositionOpen(Symbol(),Inp_Lot,Inp_StopLoss2,Inp_TakeProfit2,Inp_MagicNum2,Inp_EaComment);
     }
   else if(Inp_Trend_type==3)
     {
      //--- Open order if there is a buy signal
      if(BuySignal() && !Trade.IsOpenedByMagic(Inp_MagicNum1))
         Trade.BuyPositionOpen(Symbol(),Inp_Lot,Inp_StopLoss1,Inp_TakeProfit1,Inp_MagicNum1,Inp_EaComment);
      //--- Open order if there is a sell signal
      if(SellSignal() && !Trade.IsOpenedByMagic(Inp_MagicNum2))
         Trade.SellPositionOpen(Symbol(),Inp_Lot,Inp_StopLoss2,Inp_TakeProfit2,Inp_MagicNum2,Inp_EaComment);
     }
  }
//+------------------------------------------------------------------+
//| Buy conditions                                                   |
//+------------------------------------------------------------------+
bool BuySignal()
  {
   return(wpr1[0]<-80 && adx1[0]<Inp_FlatLevel1)?true:false;
  }
//+------------------------------------------------------------------+
//| Sell conditions                                                  |
//+------------------------------------------------------------------+
bool SellSignal()
  {
   return(wpr2[0]>=-20 && adx2[0]<Inp_FlatLevel2)?true:false;
  }
//+------------------------------------------------------------------+
//| Get the indicator current values                                 |
//+------------------------------------------------------------------+
bool GetIndValue()
  {
   return(CopyBuffer(InpInd_Handle1,0,0,2,wpr1)<=0  ||
          CopyBuffer(InpInd_Handle2,0,0,2,wpr2)<=0 ||
          CopyBuffer(InpInd_Handle3,0,0,2,adx1)<=0  ||
          CopyBuffer(InpInd_Handle4,0,0,2,adx2)<=0
          )?false:true;
  }
//+------------------------------------------------------------------+
Testing the flat-based strategy
Similar to testing the trend-following strategy, we should first select a history segment for training and optimizing the selected flat-based strategy. The figure below shows the test interval:
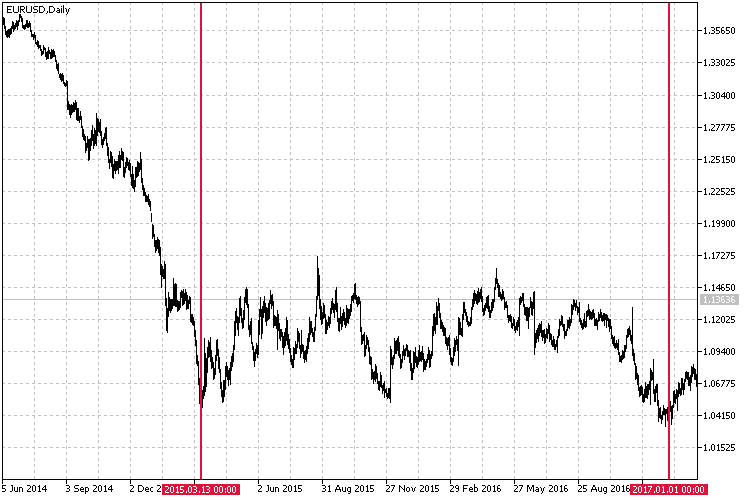
Fig. 9. Selected test interval for the flat strategy
General test conditions look as follows:
- Interval: 13.03.2015 — 01.01.2017.
- Symbol: EURUSD.
- Trading mode: No delay. These are not high-frequency trading strategies, so the effect of delays would be very small.
- Testing: М1 OHLC. Pre-testing on real ticks shows nearly the same results.
- Initial deposit: 1000 USD.
- Leverage: 1:500.
- Server: MetaQuotes-Demo.
- Quotes: 5-digit.
Indicator parameters, as well as take profit and stop loss values will be used in testing and optimization. Separate optimization results in the Buy mode are displayed in the table below.
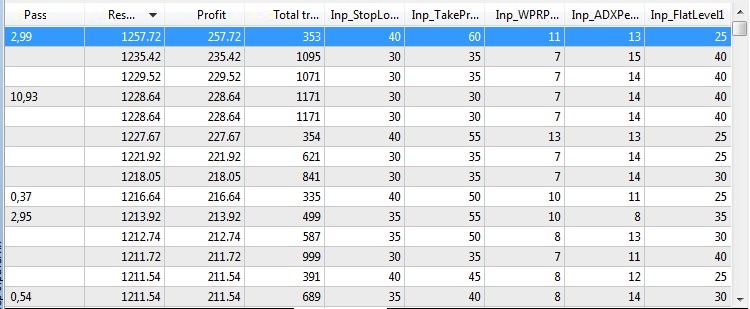
Fig. 10. Flat-based strategy optimization results in the Buy mode
Separate optimization results in the Sell mode are as follows:
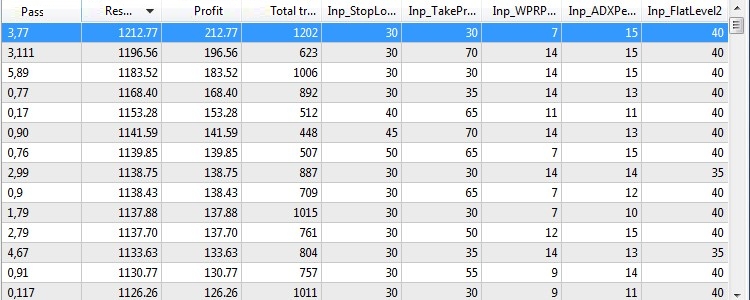
Fig. 11. Flat-based strategy optimization results in the Sell mode
After defining the best parameters for both modes using separate optimization, it is time to check the strategy on an unfavorable interval and find out how it behaves in new conditions. As an experiment, we will choose the non-flat market interval that has already been chosen to test the trend-following strategy (the one displayed in Fig. 6). We have used it for a mixed test of the trend-following strategy in the Both mode (Uptrend+Downtrend).
The result is as follows:
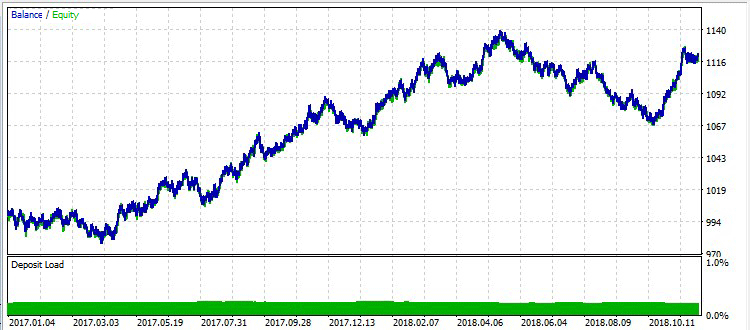
Fig. 12. Test results of the optimized flat-based strategy on the unfavorable interval
Considering the strategy is flat-based, while the test interval features prolonged trend movements, it achieved good results and showed profit.
Combined strategy
We have considered the trend-following and flat-based strategies as examples for separate optimization. Both strategies were divided into two components, trained on favorable markets and optimized. Further on, their viability was tested in the unknown market interval, and the results were quite promising. Now let's check out the strategy combining the two strategies described above on a broader time interval. But first, we should combine both strategies into one.
Immediately after implementing the strategy into the code, the optimized parameters of the two modes of the trend-following and the two modes of the flat-based strategies were set:
//+------------------------------------------------------------------+
//| EA inputs                                                        |
//+------------------------------------------------------------------+
input string               Inp_EaComment="Universe Strategy";           //EA Comment
input double               Inp_Lot=0.01;                                //Lot
input MarginMode           Inp_MMode=LOT;                               //MM

//--- Uptrend parameters
input string               Inp_Str_label1="===Uptrend parameters===";   //Label
input int                  Inp_MagicNum1=1111;                          //Magic number
input int                  Inp_StopLoss1=50;                            //Stop Loss(points)
input int                  Inp_TakeProfit1=55;                          //Take Profit(points)

//--- CenterOfGravityOSMA indicator parameters
input uint                 Period_1=9;                                  //Averaging period
input uint                 SmoothPeriod1_1=3;                           //Smoothing period1
input ENUM_MA_METHOD       MA_Method_1_1=MODE_SMA;                      //Averaging method1
input uint                 SmoothPeriod2_1=3;                           //Smoothing period2
input ENUM_MA_METHOD       MA_Method_2_1=MODE_SMA;                      //Averaging method2
input Applied_price_       AppliedPrice1=PRICE_TRENDFOLLOW1_;           //Applied price

//--- Average Speed indicator parameters
input int                  Inp_Bars1=1;                                 //Days
input ENUM_APPLIED_PRICE   Price1=PRICE_LOW;                            //Applied price
input double               Trend_lev1=1.6;                              //Trend Level

//--- Downtrend parameters
input string               Inp_Str_label2="===Downtrend parameters==="; //Label
input int                  Inp_MagicNum2=2222;                          //Magic number
input int                  Inp_StopLoss2=40;                            //Stop Loss(points)
input int                  Inp_TakeProfit2=70;                          //Take Profit(points)

//--- CenterOfGravityOSMA indicator parameters
input uint                 Period_2=15;                                 //Averaging period
input uint                 SmoothPeriod1_2=3;                           //Smoothing period1
input ENUM_MA_METHOD       MA_Method_1_2=MODE_SMA;                      //Averaging method1
input uint                 SmoothPeriod2_2=3;                           //Smoothing period2
input ENUM_MA_METHOD       MA_Method_2_2=MODE_SMA;                      //Averaging method2
input Applied_price_       AppliedPrice2=PRICE_HIGH_;                   //Applied price

//--- Average Speed indicator parameters
input int                  Inp_Bars2=1;                                 //Days
input ENUM_APPLIED_PRICE   Price2=PRICE_WEIGHTED;                       //Applied price
input double               Trend_lev2=1.0;                              //Trend Level


//--- Buy parameters
input string               Inp_Str_label3="===Buy parameters===";       //Label
input int                  Inp_MagicNum3=3333;                          //Magic number
input int                  Inp_StopLoss3=40;                            //Stop Loss(points)
input int                  Inp_TakeProfit3=60;                          //Take Profit(points)

//--- WPR indicator parameters
input int                  Inp_WPRPeriod1=11;                           //Period WPR
//--- ADX indicator parameters
input int                  Inp_ADXPeriod1=13;                           //Period ADX
input int                  Inp_FlatLevel1=25;                           //Flat Level ADX

//--- Sell parameters
input string               Inp_Str_label4="===Sell parameters===";      //Label
input int                  Inp_MagicNum4=4444;                          //Magic number
input int                  Inp_StopLoss4=30;                            //Stop Loss(points)
input int                  Inp_TakeProfit4=30;                          //Take Profit(points)

//--- WPR indicator parameters
input int                  Inp_WPRPeriod2=7;                            //Period WPR
//--- ADX indicator parameters
input int                  Inp_ADXPeriod2=15;                           //Period ADX
input int                  Inp_FlatLevel2=40;                           //Flat Level ADX
Also, the option of setting the modes has been removed, since the combined EA is not subject to training or optimization. The strategy itself is implemented as follows:
//+------------------------------------------------------------------+
//| Expert tick function                                             |
//+------------------------------------------------------------------+
void OnTick()
  {
//--- Get data for calculation

   if(!GetIndValue())
      return;

//--- Open order if there is a buy signal (trend-following strategy)
   if(BuySignal_1() && !Trade.IsOpenedByMagic(Inp_MagicNum1))
      Trade.BuyPositionOpen(Symbol(),Inp_Lot,Inp_StopLoss1,Inp_TakeProfit1,Inp_MagicNum1,Inp_EaComment);
//--- Open order if there is a sell signal (trend-following strategy)
   if(SellSignal_1() && !Trade.IsOpenedByMagic(Inp_MagicNum2))
      Trade.SellPositionOpen(Symbol(),Inp_Lot,Inp_StopLoss2,Inp_TakeProfit2,Inp_MagicNum2,Inp_EaComment);

//--- Open order if there is a buy signal (flat-based strategy)
   if(BuySignal_2() && !Trade.IsOpenedByMagic(Inp_MagicNum3))
      Trade.BuyPositionOpen(Symbol(),Inp_Lot,Inp_StopLoss3,Inp_TakeProfit3,Inp_MagicNum3,Inp_EaComment);
//--- Open order if there is a sell signal (flat-based strategy)
   if(SellSignal_2() && !Trade.IsOpenedByMagic(Inp_MagicNum4))
      Trade.SellPositionOpen(Symbol(),Inp_Lot,Inp_StopLoss4,Inp_TakeProfit4,Inp_MagicNum4,Inp_EaComment);
  }
//+------------------------------------------------------------------+
//| Buy conditions (trend-following strategy)                        |
//+------------------------------------------------------------------+
bool BuySignal_1()
  {
   return(avr_speed1[0]>Trend_lev1 && cog1[1]<cog1[0] &&(cog1[1]<0 && cog1[0]<0))?true:false;
  }
//+------------------------------------------------------------------+
//| Sell conditions (trend-following strategy)                       |
//+------------------------------------------------------------------+
bool SellSignal_1()
  {
   return(avr_speed2[0]>Trend_lev2 && cog2[1]>cog2[0] &&(cog2[1]>0 && cog2[0]>0))?true:false;
  }
//+------------------------------------------------------------------+
//| Buy conditions (flat-based strategy)                             |
//+------------------------------------------------------------------+
bool BuySignal_2()
  {
   return(wpr1[0]<-80 && adx1[0]<Inp_FlatLevel1)?true:false;
  }
//+------------------------------------------------------------------+
//| Sell conditions (flat-based strategy)                            |
//+------------------------------------------------------------------+
bool SellSignal_2()
  {
   return(wpr2[0]>=-20 && adx2[0]<Inp_FlatLevel2)?true:false;
  }
//+------------------------------------------------------------------+
//| Get the current indicator values                                 |
//+------------------------------------------------------------------+
bool GetIndValue()
  {
   return(CopyBuffer(InpInd_Handle1,0,0,2,cog1)<=0       ||
          CopyBuffer(InpInd_Handle2,0,0,2,cog2)<=0       ||
          CopyBuffer(InpInd_Handle3,0,0,2,avr_speed1)<=0 ||
          CopyBuffer(InpInd_Handle4,0,0,2,avr_speed2)<=0 ||
          CopyBuffer(InpInd_Handle5,0,0,2,wpr1)<=0       ||
          CopyBuffer(InpInd_Handle6,0,0,2,wpr2)<=0       ||
          CopyBuffer(InpInd_Handle7,0,0,2,adx1)<=0       ||
          CopyBuffer(InpInd_Handle8,0,0,2,adx2)<=0
          )?false:true;
  }
//+------------------------------------------------------------------+
All four modes of the two strategies work independently from each other, have their own set of parameters established after training and do not intersect each other in any way. For a test, I have decided to use a wider range — the last three years. The full list of test conditions is as follows:
- Interval: 01.01.2015 — 30.11.2018.
- Symbol: EURUSD.
- Trading mode: No delay. These are not high-frequency trading strategies, so the effect of delays would be very small.
- Testing: М1 OHLC. Pre-testing on real ticks shows nearly the same results.
- Initial deposit: 1000 USD.
- Leverage: 1:500.
- Server: MetaQuotes-Demo.
- Quotes: 5-digit.
The test results are as follows:
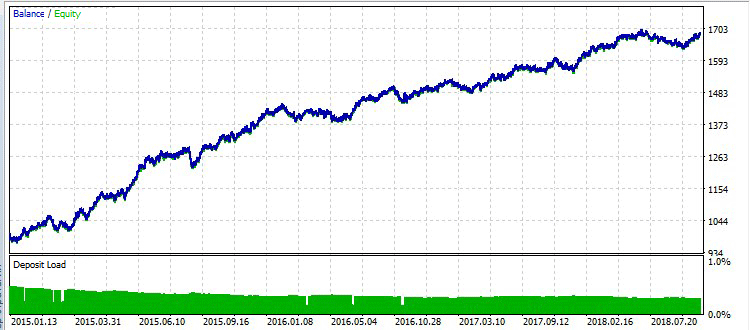
Fig. 13. Combined strategy test results
No new optimizations of the parameters were carried out. The parameters were taken 'as is' from the optimal values defined during the separate optimization on the favorable intervals. Considering that the four independent strategies worked in common unfavorable conditions, the result is positive.
Summary
After comparing the test results of the two strategies in uptrend, downtrend and flat conditions, we can make the following conclusions:
- For the tested strategies, the separate optimization method demonstrates a positive dynamics.
- According to the obtained results, the method of separate optimization (or rather separate training) proved to be quite efficient on the favorable market intervals.
- Even testing on time intervals unsuitable for the strategy (testing the trained flat-based strategy on the trend-following intervals) shows a positive dynamics.
- The test of the combined strategy consisting of the two trained strategies serves as a double check of the viability of both systems. Both strategies worked on a large time interval with no corrections, no optimizations and no fitting. Moreover, they were not selected as modules of a single trading system from the very beginning.
Considering that I have selected random trading systems for testing and improving them through separate optimization, and the final check has been performed on the most unfavorable history interval, the result of this study is positive. The results show that the method of separate optimization is quite efficient and deserves to be used in the development and configuration of trading systems.
Conclusion
The attached archive contains all the listed files, which are located in the appropriate folders. For a correct operation, you should save the MQL5 folder to the terminal's root directory.
Programs used in the article:
| # |
Name |
Type |
Description |
|---|---|---|---|
| 1 |
TrendStrategy.mq5 | EA |
EA based on the trend-following strategy. |
| 2 |
FlatStrategy.mq5 | EA | EA based on the flat-based strategy. |
| 3 | UniverseStrategy.mql5 | EA | EA based on the combined strategy. |
| 4 | Trade.mqh | Library | Class of trading functions. |
| 5 |
average_speed.mq5 | Indicator | Average price speed indicator used in the trend-following strategy. |
| 6 | centerofgravityosma.mq5 | Indicator | Ehlers Center of Gravity indicator used in the trend-following strategy. |
Translated from Russian by MetaQuotes Ltd.
Original article: https://www.mql5.com/ru/articles/5427
 Practical Use of Kohonen Neural Networks in Algorithmic Trading. Part I. Tools
 Selection and navigation utility in MQL5 and MQL4: Adding "homework" tabs and saving graphical objects
 Selection and navigation utility in MQL5 and MQL4: Adding auto search for patterns and displaying detected symbols
 How to create and test custom MOEX symbols in MetaTrader 5
- Free trading apps
- Over 8,000 signals for copying
- Economic news for exploring financial markets
You agree to website policy and terms of use
Hello Alexander,
I am looking for a function to identify a flat market to integrate in my MT5 EA. The function should prevent the EA trading an instrument in a flat market resp. a narrow price range.
Could you help me with that?
Best regards
Reinhard