How to create Requirements Specification for ordering an indicator
MetaQuotes | 6 April, 2018
Table of Contents
- How can algo trading make a trader's live easier?
- Supplement text with images and videos
- Useful programs for creating Requirements Specification
- Formulating the Requirements Specification as an algorithm
- Requirements Specification Examples
- What can I specify in the Requirements Specification?
- Indicator drawing type
- Colors
- Where the indicator is drawn
- Timeframes and symbols for calculation and display
- Prices, volumes and indicators used in calculation
- The list of input parameters
- Calculations on every tick
- Redrawing of the indicator
- Sending of alerts, push notifications, emails, reports and screenshots
- Graphical control panel
- Explanatory screenshots
- Logs for debugging
- Indicator acceptance and testing
- Think, describe, order!
How can algo trading make a trader's live easier?
All traders want to find market behavior patterns, which could help identify favorable moments for performing trading operations. They also want to eliminate randomness and influence of external factors, such as rumors, news releases, fatigue, and so on.
Traders monitor charts and may formulate some formal rules, which enable objective analysis of price or tick charts. Technical indicators can facilitate such analysis.
The next step is to develop rules, which would enable a trader to trade mechanically strictly following the system, without omitting entries, even if the system signals seem inappropriate for the current situation. If signals of a trading system can be formally described, it is better to entrust trading to an automated Expert Advisor.
A trading robot can work non-stop for 24 hours a day without fatigue or doubt. However, not every trader can develop trading robots. A solution in this case is to order an application from an algo trading programmer. When ordering an application, you need to provide to a programmer a Requirements Specification, which contains the description of requirements for the indicator or trading robot you are ordering. In this article, we will consider creation of Requirements Specification. The article will first of all be interesting for customers applying to the Freelance service.
Supplement text with images and videos
The Requirements Specification should be exact and well-structured, and should contain everything needed for a programmer to understand the task: formulas, logical conditions, pieces of code, description of the algorithm.
Many problems in our society stem from misunderstanding. Misunderstanding may also cause problems when ordering an application from a freelance developer. Many developers think that the most difficult part of the order is finding out What Customers Want. Even if both parties speak the same language, they often cannot understand each other. The worst case is to find it out at the stage of ready program acceptance. Both the Customer and the Developer are disappointed in this case. Sometimes it leads to Arbitration.
When the order is in Arbitration, parties often begin to understand each other. Do we think and express our ideas in words? No, we think in images. Therefore, if you want your Requirements Specification to be clear both to you and the developer, do add images to it.
The rule is simple: add an explanatory picture for each market situation and each desired pattern. The image or diagram should contain the most necessary information and should not contradict the text. Remove unnecessary details, add notes for important parts, highlight levels with arrows, mark patterns and so on.
Some customers create a huge text, trying to provide a detailed and clear description. However, it might be difficult to understand the essence from a lengthy text. The Customer and the Developer may treat some terms differently, while an image is unambiguous - an arrow or a circle is perceived exactly as an arrow or a circle. By spending 5-10 minutes preparing images that a developer can understand, you can deliver your ideas better and receive a properly running program faster.
Note! Images should be inserted straight into the text, not attached as a file. Developers may choose not to download such attachments.
Please use the text editor to prepare your description:
Often the customers write, "I'll explain the details on Skype, it is a clearer and faster way". No, it is not! A clearer way is to create a video. Try to prepare a professional clear and smooth video description. Before starting to record the video, make up a plan using a scenario of what to show and to say. Try to record a video with the first take—most probably you will fail to. The same will happen on Skype. That is why you should prepare for the video and record it as many times as you need to get a satisfactory result. Then publish it on YouTube and insert it to the Requirements Specification of your order.
Now let's get to the point: first we'll analyze a couple of examples of Requirements Specification for the development of indicators.
Useful programs for creating Requirements Specification
We recommend using ScreenPresso for preparing and publishing screenshots. It allows to easily add to a screenshot text, arrows, shapes and visual effects. The program has a large set of parameters, and it also allows recording videos. Sreenshots can be added to the Freelance order chat using the drag and drop or copy and paste method.
If you need more screenshot editing options, choose another graphic editor PicPick. These two programs are free for private use. You can use both, since they perfectly complement each other. You can find on the Internet other screenshot tools with editing options.
For creating prototypes of graphical panels, use the Pencil software. It allows preparing a sketch of any desired interface in 5-10 minutes. The software also features options for creating flowcharts, using which you can visually explain complex algorithms. You may additionally read reviews on the web, such as 7 Best Free Flowchart Tools for Windows.
A flow chart is a convenient form for visualizing the program logic, allowing to demonstrate actions on conditions, cycles, etc. If you are good at math, you can describe formulas and calculations using Microsoft Excel. Microsoft's SmartArt enables the creation of charts, diagrams, panels and flow charts.
Let's sum up. No matter what program you choose for describing the idea of your indicator. What's important is that your presentation should be understandable for the developer. Use images, flow charts, and diagrams in addition to the text description. Such a comprehensive description will help the developer to better understand the idea of your order.
Formulating the Requirements Specification as an algorithm
Every indicator reflects an idea. Therefore, first you need to describe the idea, in words and pictures, if possible. If the idea is not explained, it will be much more difficult for the developer to understand what the customer wants.
Now you can proceed with the description of the indicator operation/calculation/display algorithm. Describe the algorithm as a sequence of operations. The developer will be able to write an appropriate code based on the described algorithm. If the description of the idea and the algorithm contains terms, you should explicitly define them to make sure both parties equally understand their meaning.
Divide the algorithm into stages and arrange them in the same sequence as you want them to work. Do not jump between different parts of the Requirements Specification, make sure to properly describe one block, module or step before switching to the next one.
Use lists to describe terms, as follows:
- Daily range — the distance between the High and Low price during the day
- Average range — the average value of the daily range for N days
- Flat — a narrow price channel, inside which bodies of candlesticks are formed in the same range
- ...
To define stages, use numbers, lists and bold font.
Try to present the Requirements Specification as a series of actions that occur one after another, in the same order they should be performed in the final program. Some examples of Requirements Specifications are shown below.
Requirements Specification Examples
Example 1
ZigZag based on oscillators is needed
The idea of the indicator
Create a ZigZag indicator, which is constructed based on extreme values determined using oscillators. It can use any classical normalized oscillator, which has overbought and oversold zones. The algorithm should first be executed with the WPR indicator, then similarly add the possibility to draw a zigzag using the following indicators:
- CCI
- Chaikin
- RSI
- Stochastic Oscillator
Algorithm and Terms
The first stage is the construction of the Zigzag:
- The overbought zone is determined as candlesticks, at which the indicator value Value > Lmax (Lmax=-20).
- The oversold zone is determined as candlesticks, at which the indicator value Value < Lmin (Lmin=-80).
- The values of Lmax and Lmin should be included in indicator parameters.
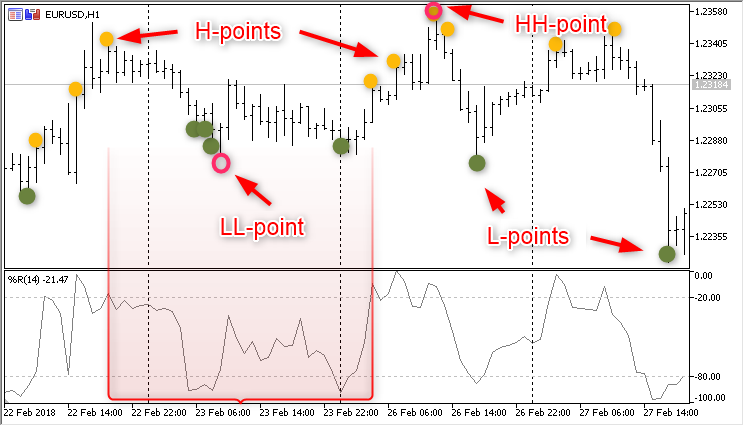
- A yellow point should be added at the High point of candlesticks in the overbought zone—it is the H point.
- A green point should be added at the Low point of candlesticks in the oversold zone—it is the L point.
- If there is at least one L point between two H points, search for a LL point in the interval between two H points. The candlestick with the lowest Low price will be the LL point. Generally, the LL point is not necessarily an L point. Search for candlesticks with the lowest Low price.
- If there is at least one H point between two L points, search for a HH point in the interval between two L points. The candlestick with the highest High price will be the HH point. Generally, the HH point is not necessarily a H point. Search for candlesticks with the highest High price.
- Connect LL and HH points to draw a ZigZag. The default color is yellow. The first step is finished.
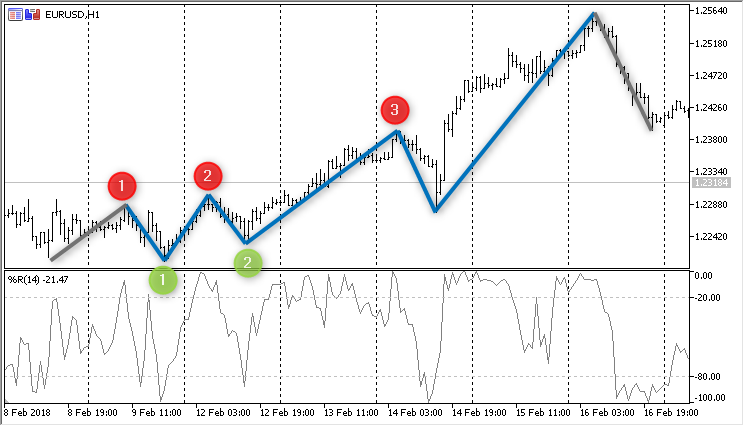
The second step is the color of the Zigzag:
- Search for three consecutive HH points, which meet the following condition: each found HH point should be higher than the previous one.
- If the same condition is fulfilled for the two LL points found between HH points, i.e. if the second LL is higher than the first one, paint all ZigZag legs between these five points in red.
- If another HH and another LL points are found after these five ZigZag extremums, and they are located higher than previous HHs and LLs respectively, additionally color 2 ZigZag legs in blue.
- Continue as long as the condition preserves. This marks an uptrend.
- Similarly, search for decreasing LL points and repeat operations described in pp 1-4. These legs should be colored in red to mark the downtrend.
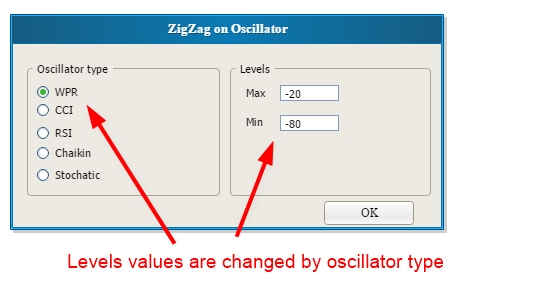
The third step is to add an option for specifying the type of the oscillator, based on which Zigzag will be constructed: CCI, Chaikin, RSI, Stochastic Oscillator.
- So, the first parameter is the oscillator type, which should be set by an enumeration. The default value is WPR.
- Add Lmax and Lmin parameters for each type. These parameters should have default values.
- The names of the maximum and minimum parameters should contain the indicator name, such as WPRmax, CCImax, STOmax, etc.
Step 4 is to add a graphical panel for managing indicator parameters.
- The panel should have check boxes with all types of oscillators, allowing to quickly switch between oscillators.
- The panel should be minimizable and maximizable by a click.
- We also need the possibility to move the panel on the chart
- and to remove the indicator from the chart using options on the panel.
Calculations: the indicator will be used for working with charts and for optimization. Therefore, the algorithm should be fast and should not be time consuming.
The work will be accepted in stages, so every step must be completed in the right order.
Example 2
Need an NRTR indicator, which sends notifications by email and to the mobile terminal
1. First, NRTR should be re-written from MQL4 to MQL5. The code is available here: https://www.mql5.com/en/code/7760
2. When the indicator color changes, it should send a push notification and an email, to notify of trend change.
3. Add to parameters working hours, during which the indicator is allowed to send notifications, it should not send notifications at night. There should be two parameters:
- StartHour — the hour to start operation in the morning;
- EndHour — the hour to end operation in the evening.
4. Add parameters for enabling notifications:
- SendPush — allow sending Push-notifications
- SendEmail — allow sending emails
5. The text of the message should be as follows:
NRTR on EURUSD H1 has turned upwards. Up=1.23560, Down=1.23300, Brick=260 pips
where:
- information on the name and timeframe is added based on the chart the indicator is running on
- Up is the upper level of the channel
- Down is the lower level of the channel
- Brick is the width of the channel in points (the size of stop when opening a position)
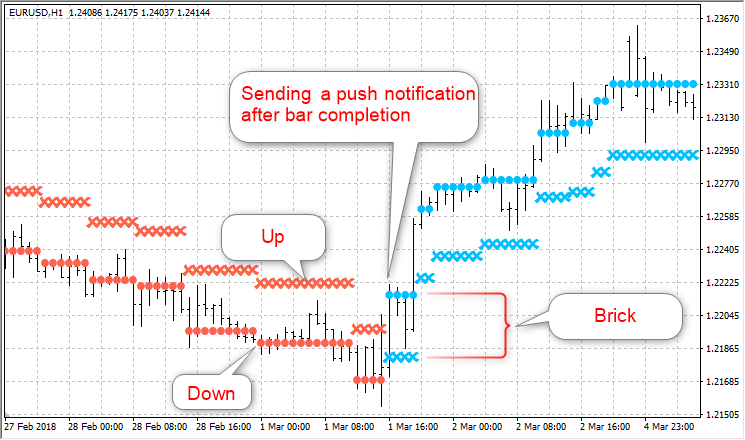
6. Email and push notifications should only be sent after the completion of the candlestick, which has broken through the channel.
7. Only one signal per bar can be sent.
8. To monitor the indicator operation on VPS, all sent messages should also be written to logs.
9. Values of three indicator buffers should be obtainable:
- Up — the upper border
- Down — the lower border
- Trend — trend direction, -1 or 1
10. The indicator must be optimal in terms of performance.
Example 3
Develop an indicator
- The first currency pair
- The second currency pair
- The calculation pair
- Price used for calculation is Bid/Ask
Point 3 is not an input parameter, it is only the result of division of rates from points 1 and 2. It is displayed on the chart for reference.
Operating principle:
The idea is as follows: take two currency pairs with the same denominator (preferably popular pairs), for example EUR/USD and GBP/USD, and divide their rates. As a result we obtain the rate of EUR/GBP.
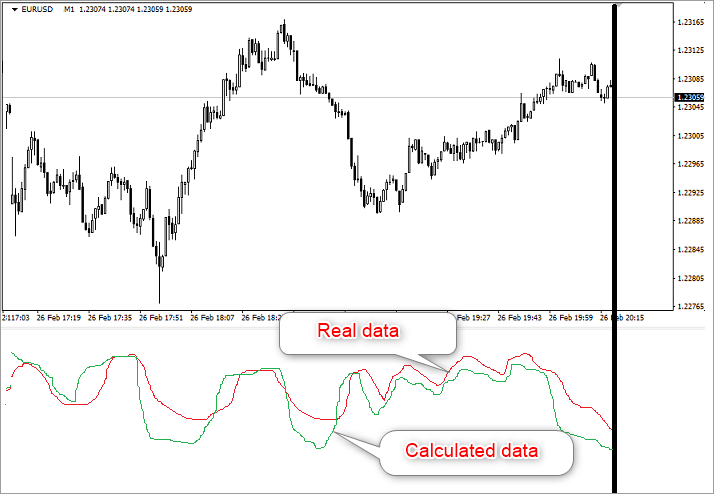
The indicator is drawn in a separate window. The black vertical line is the current time. Two curves are drawn to the left starting from this line:
- one curve shows the calculated data, it is green
- the second one shows the real data, it is red
Calculations are performed on every tick. Since one horizontal time interval of the indicator takes much more space than the same interval on the chart, time intervals must be marked. For example, if the chart period is M1, vertical lines should be drawn at the indicator chart with a step of one minute.
What can I specify in the Requirements Specification?
Indicators are based on processing of price charts or tick sequences. The result and purpose of such processing is to have a visual technical analysis tool. Therefore, when ordering an indicator, you need to provide answers to some questions, which will help the programmer to understand your idea better.
Indicator drawing type
- Lines are the most simple and clear chart type.
- Histogram is most often used in oscillators.
- Arrows and symbols are convenient for marking entry/exit points. Sometimes channels (NRTR) or Trailing Stop systems are based on arrows and symbols.
- Areas and channels, such as Envelopes.
- Segments can be used for drawing lines as part of complex indicators.
- Zigzag style, such as a colored Zigzag.
- Bars and candlesticks are used for drawing charts of other symbols or custom candlesticks based on calculations. For example, Heiken-Ashi.
- A combination of mentioned styles.
Some types of indicators require multiple data series for drawing. These data series are called indicator buffers. A meaningful name needs to be set for each buffer, so that the user could easily understand indicator values in the Data Window.
Colors
Indicator can be drawn in one or several colors. This part is usually clear. However, if you want the indicator color to change dynamically depending on the current situation, you should provide a clear algorithm describing corresponding conditions.
Where the indicator is drawn
- In the main chart window
- In the indicator subwindow
Timeframes and symbols for calculation and display
- Will the indicator use its own symbol/timeframe for calculations or will it access data of other symbols and timeframes?
- Do you want to disable indicator drawing on any symbols/timeframes?
- What should the indicator do, if there are not enough bars of another symbol/timeframe?
Prices, volumes and indicators used in calculation
Classical indicators always used for calculations Open, High, Low and Close prices of their own timeframe. Now, wide opportunities of modern technical analysis and advanced MQL5/MQL4 programming languages allow using different time series, including volumes and values of other indicators.
- Do you need an input parameter for specifying the price used in calculations?
- Should the indicator be able to work using data of another indicator? For example, a moving Average can be applied to an RSI chart. Not all traders know about this possibility.
- Do you need additional levels for indicators, drawn in a separate subwindow? For example, the levels of 30 and 70 for Stochastic Oscillator.
If data of other indicators are used for calculations, try to provide the source code of such indicators. Of course, the developer can find out how to access data of the auxiliary indicator. But the availability of the source code can make this task much easier.
The list of input parameters
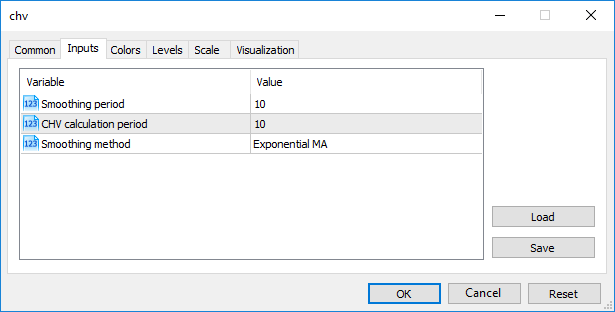
Prepare a list of parameters with proper names to be displayed in the terminal. Programmers often use names, which are convenient for code reading. But the user of this program, i.e. the trader, needs to have meaningful names. For example, the Chaikin Volatility (CHV) indicator has the following parameters, which are easy to understand:
- Smoothing period: how many values are used for averaging the auxiliary array.
- CHV period: how many bars are used for obtaining the auxiliary array by Chaikin's method.
- Smoothing types used for the oscillator.
Based on this information, the developer adds the following to the code:
//--- Enumeration of smoothing types
enum SmoothMethod
  {
   SMA=0,// Simple MA
   EMA=1 // Exponential MA
  };
//--- input parameters
input int          InpSmoothPeriod=10;  // Smoothing period
input int          InpCHVPeriod=10;     // CHV calculation period
input SmoothMethod InpSmoothType=EMA;   // Smoothing method
Comments after the values will be shown for the trader as names in the window of parameters:
Calculations on every tick
Each price change leads to the execution of a special event handler function Calculate, in which all required calculations are performed. Perhaps, your indicator does not need handling of every tick, and calculations on each new bar are enough.
If calculations are only performed on new bars, the testing of the Expert Advisor using this indicator can be executed mush faster. Therefore you should decide on the calculation method and add it to your Requirements Specification.
An inefficient calculation algorithm can also increase the testing time. Request from the developer to perform code profiling to detect slow functions and to improve the code. Also, do not forget about the analytic code optimization, when the number of calculations can be significantly reduced by mathematical transformations. Such optimization can be applied to many indicators, which are based on time series averaging methods.
Redrawing of the indicator
Redrawing of the indicator on history is one of the most disappointing mistakes in a trading system. Redrawing occurs when indicator calculations depend on the time of its launch. For example, if you launch such an indicator on the EURUSD M5 chart and leave the terminal on for a day, and the next day you run this indicator with exactly the same input parameters on another EURUSD M5 chart, you will find out that the values and appearance of the indicators are different.
Most often, the reason for this effect stems from the algorithm. An experienced developer can recognize this behavior and warn the customer about potential problems when using such an indicator in trading.
Sending of alerts, push notifications, emails, reports and screenshots
If you want your indicator to inform you about the current market situation, ask the developer to add options for sending Push notifications and emails. Other alerting functions include PlaySound(), Alert() and MessageBox(). If you have a website or blog page, you may use SendFTP() for sending reports.
More possibilities for automating manual trading are described in the article How to create bots for Telegram in MQL5 by Andrey Voytenko. Some of the ideas described are interesting.
Graphical control panel
If you want flexible indicator control options, add a graphical control panel. The article Event handling in MQL5: Changing MA period on-the-fly describing the basic idea was published many years ago. Since then, the capabilities of the MQL5 language have become almost limitless. See examples in articles Universal Oscillator with a GUI and Adding a control panel to an indicator or an Expert Advisor in no time. We also recommend reading the series of articles Graphical Interfaces by Anatoli Kazharski.
If you need more than just an indicator drawing several lines, for example a complete ready-made analytical complex, then a graphic panel will make the use of such an indicator much more convenient. You need to define the actions and functionality implemented in the panel in advance:
- maximizing/minimizing the panel by a mouse click
- dragging the panel on the chart
- resizing the panel
- mouse events: left click/right click, scroll
- keyboard events: pressing, holding keys, key combinations
- timer events
- custom events, which programs may send to other programs
All available options are described in section Types of Chart Events.
Explanatory screenshots
Seeing once is better than hearing twice. Therefore, if your indicator should draw/visualize specific situations in a completely specific way, prepare explanatory illustrations. Show the most important details on such images. Do not make large screenshots, use reasonable image size. Article Tips for an Effective Product Presentation on the Market also provides some useful tips.
If you publish a program for pattern recognition, show a few recognized patterns on the chart. Make clear screenshots and provide sufficient explanatory comments.
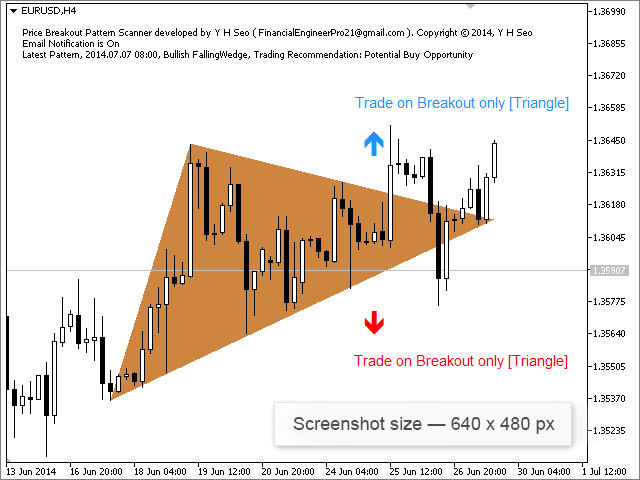
Fitting a lot of tiny details in one screenshot is not going to help either. Here is an example of what should be avoided:
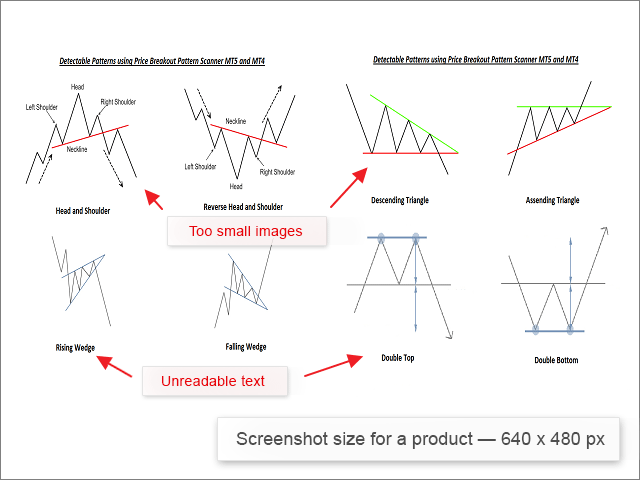
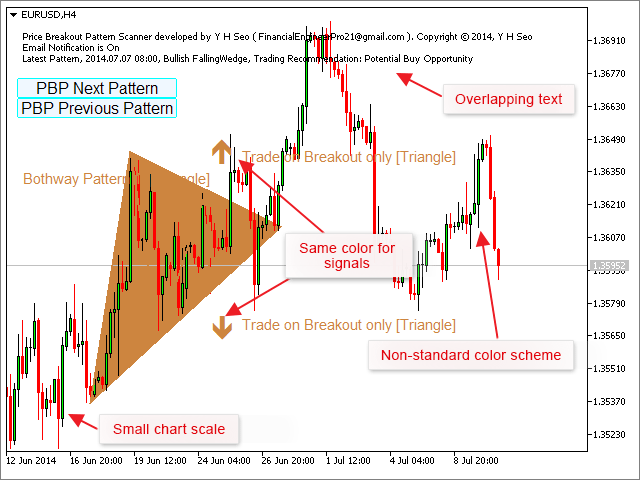
The product description would have gained if instead of one screenshot the customer had provided two or three ones with larger pictures of recognized patterns and a readable text. It concerns price charts too. Choose larger scales and show details. We do not recommend you to use unusual color schemes without any particular need. Please make sure that the text of the comment (message from the comment function) does not overlap a part of the chart. Using standard colors such as blue and red for highlighting signals to buy and sell is what we would recommend. Data on the screenshot below is not presented efficiently.
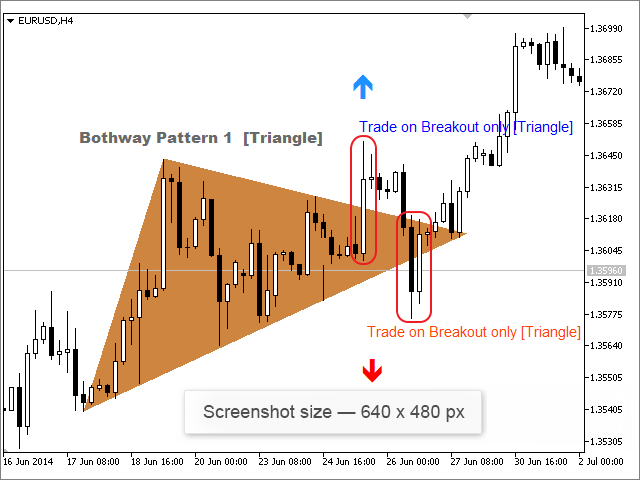
Below is an improved version.
Logs for debugging
It is almost impossible to immediately write a program, which is free of errors. The higher the program complexity, the more unforeseen situations can arise. Therefore, the behavior of the finished indicator may differ from what you expected. This can be caused by different reasons, and some of them are described below.
- The programmer's error: the code was written incorrectly or some point from the Requirements Specification was missed.
- An abnormal situation on the chart, for which your Requirements Specification does not provide any desired action. It means that the program works correctly, but you did not provide for some specific situation in the algorithm. That is why you received an unexpected result. In this case, consult the programmer on how to solve the situation.
- Your mistake: you might have specified invalid parameters, have not provided for the required history depth, have not included required files, etc.
-
If an error occurs, you need to understand the reason. It means you need to obtain all details for further analysis. In this case, in addition to describing the situation using screenshots and videos, provide the developer logs of the program and of the terminal. So, you should know where the Platform Journal is located, as well as indicate in the Requirements Specification what information the program should output.
If any unforeseen situation occurs, provide the developer additional information as is shown in the article How to Order an Expert Advisor and Obtain the Desired Result:
- Attach a set file with the program parameters (the "Save" button in the Expert Advisor parameters window)
- Specify the used currency pair and chart timeframe
- Specify the address of the server to which your terminal was connected, and the type of your account (demo, real, contest, etc.)
- Specify the version of the terminal (menu "Help" - "About")
- If the indicator was executed in the Strategy Tester, additionally provide the tester settings (dates, modeling mode, trading mode, initial deposit, leverage)
These details can also be specified in the Requirements Specification.
Indicator acceptance and testing
The indicator operation can be checked on online charts, as well as in the Strategy Tester in the visual testing mode. This will significantly save time and help you evaluate the indicator behavior in different phases of the market. Ask the developer to perform code profiling and to study those program parts, in which the indicator wastes most time. For the most frequently called or time-critical functions, time counters can be added to the code: such counters calculate the number of calls and time spent.
Should you detect an error, inform the developer providing the required description and details, allowing the developer to reproduce the situation: screenshots, logs, information on symbol/timeframe and trading account. These details will help you to solve the problem faster.
If other indicators or files are required for the indicator operation, make sure they are available in the right folders of the data directory of your terminal.
Think, describe, order!
We hope that this article has helped you to better understand how to create a clear and understandable Requirements Specification. We also tried to briefly show the possibilities of the MQL language, in which experienced freelance developers can create indicators of any complexity level for you.
If you have never ordered a program in the Freelance service because you did not know where to start, use the above tips. And, of course, communicate with developers. Experienced programmers will help you to formulate your order properly and to get the desired result.