Aleksey Ivanov / Profil
- Information
|
8+ Jahre
Erfahrung
|
32
Produkte
|
146
Demoversionen
|
|
0
Jobs
|
0
Signale
|
0
Abonnenten
|
------------------------------------------------------------------------------------------
💰 Präsentierte Produkte:
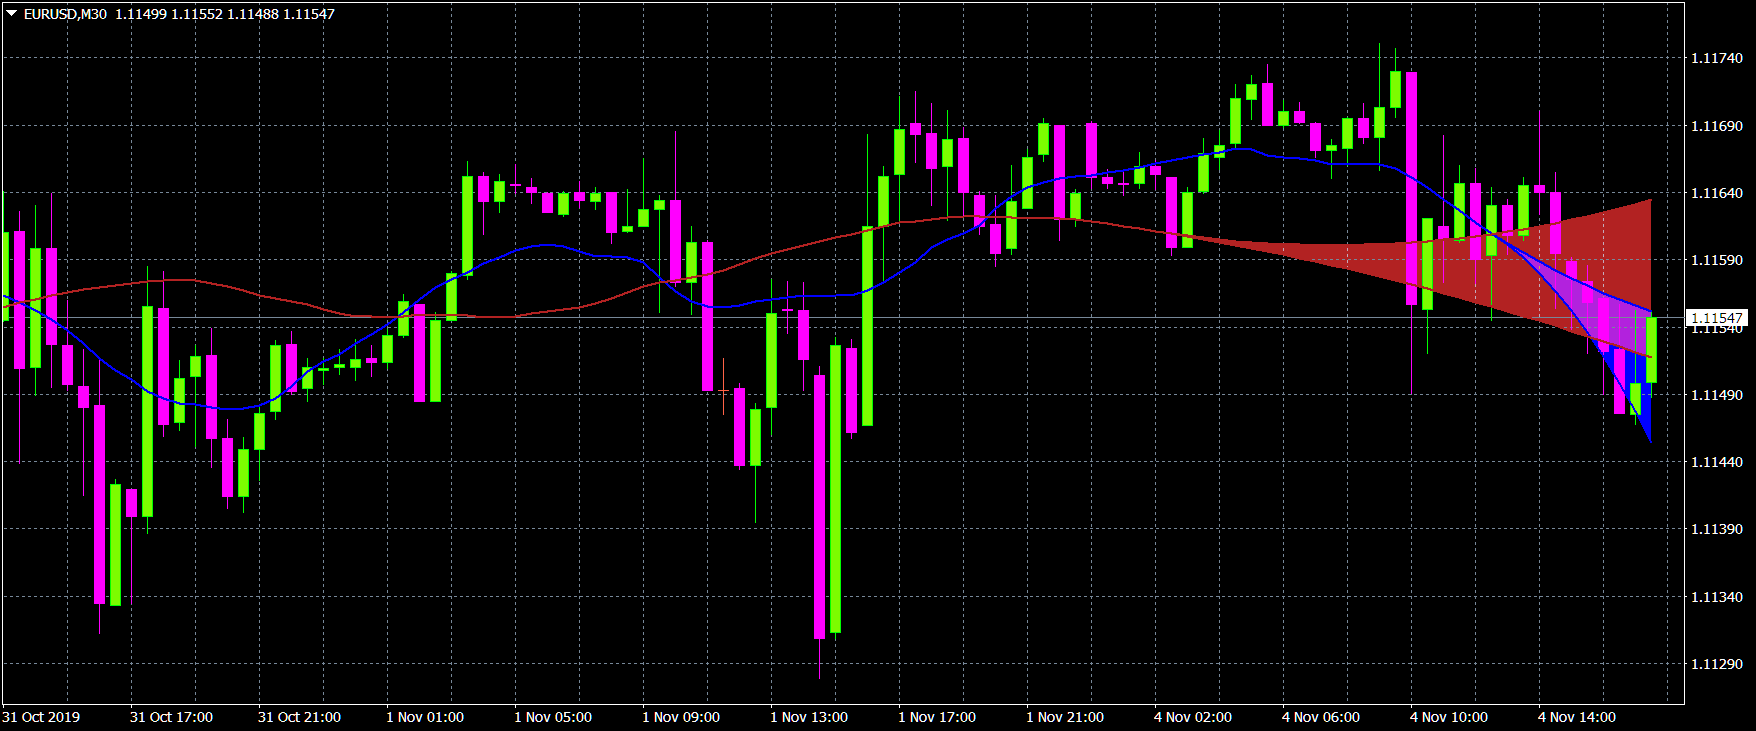
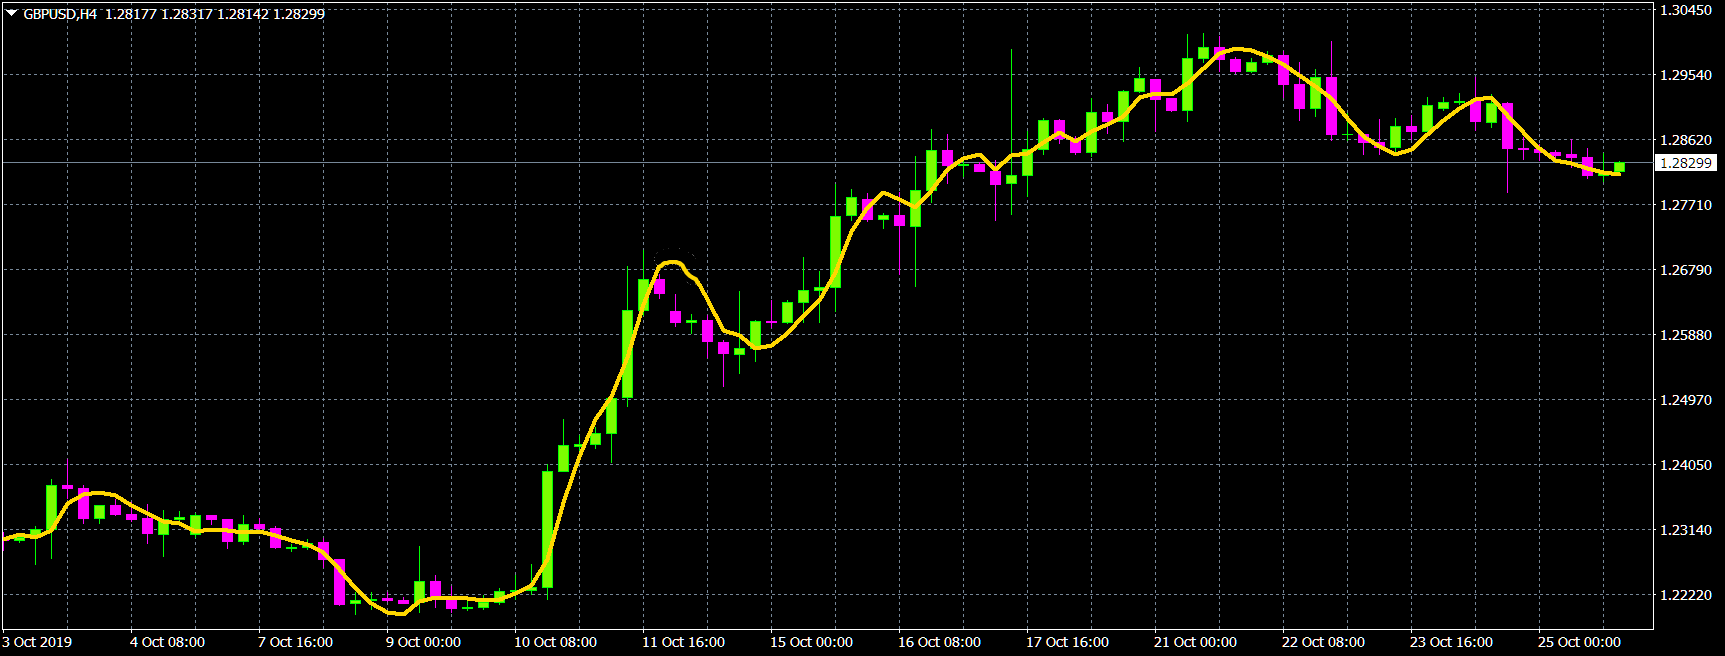
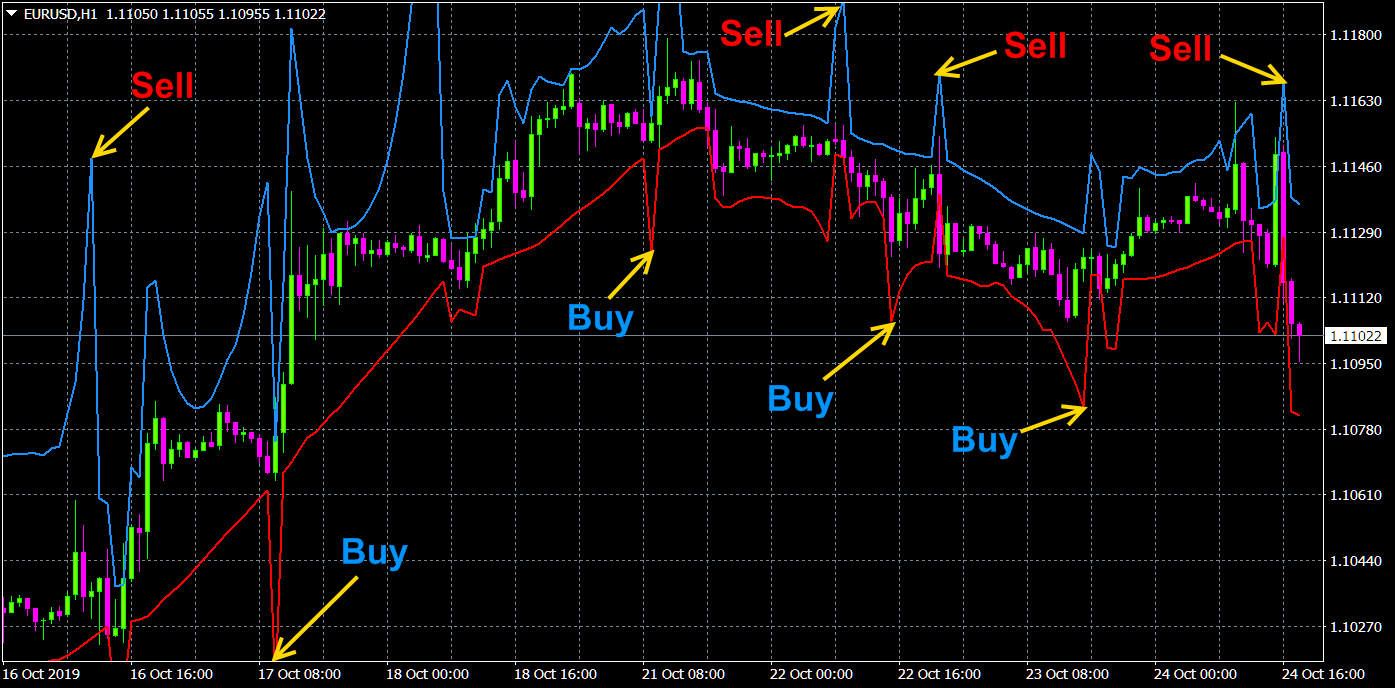
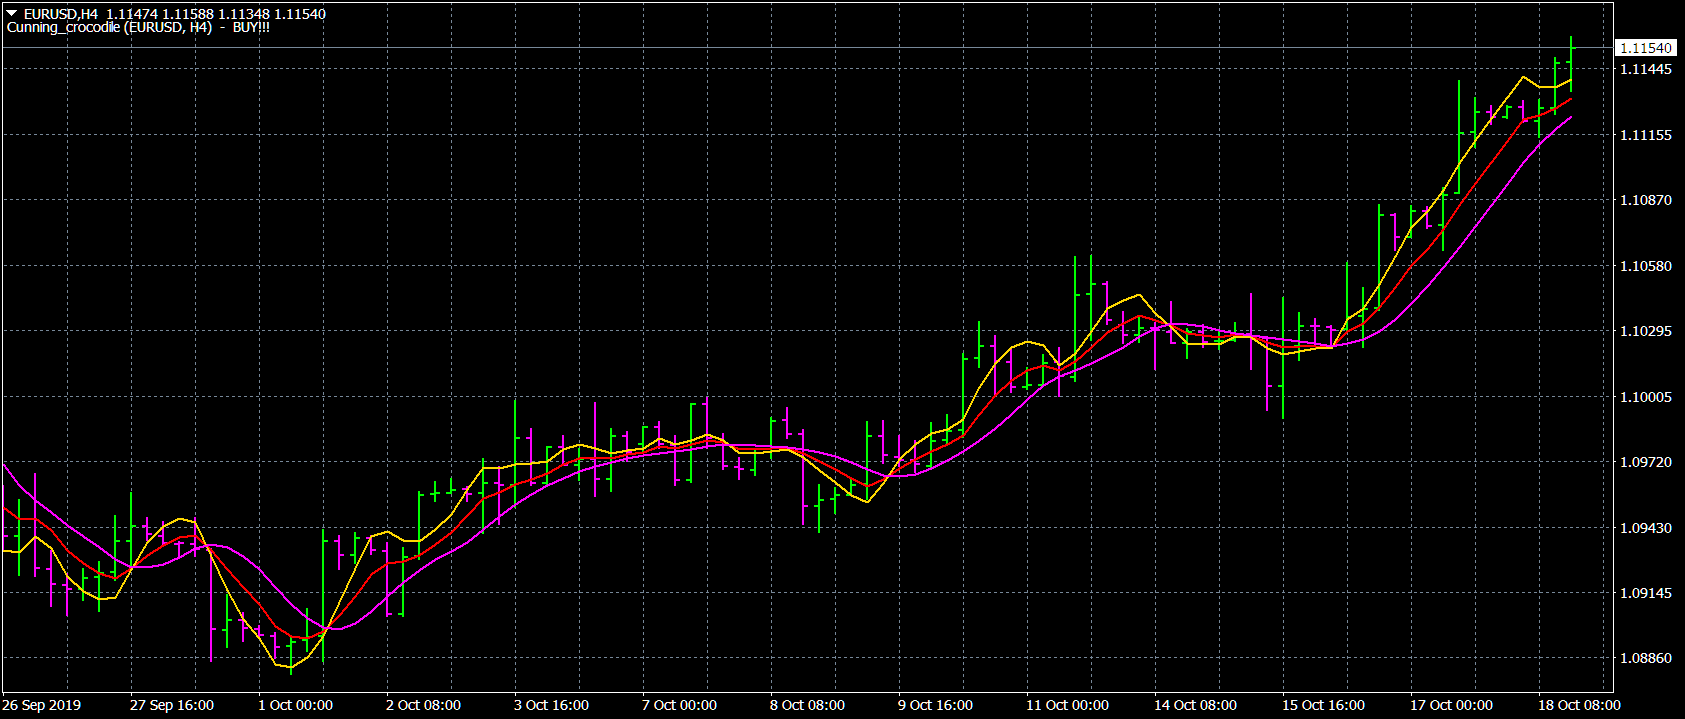
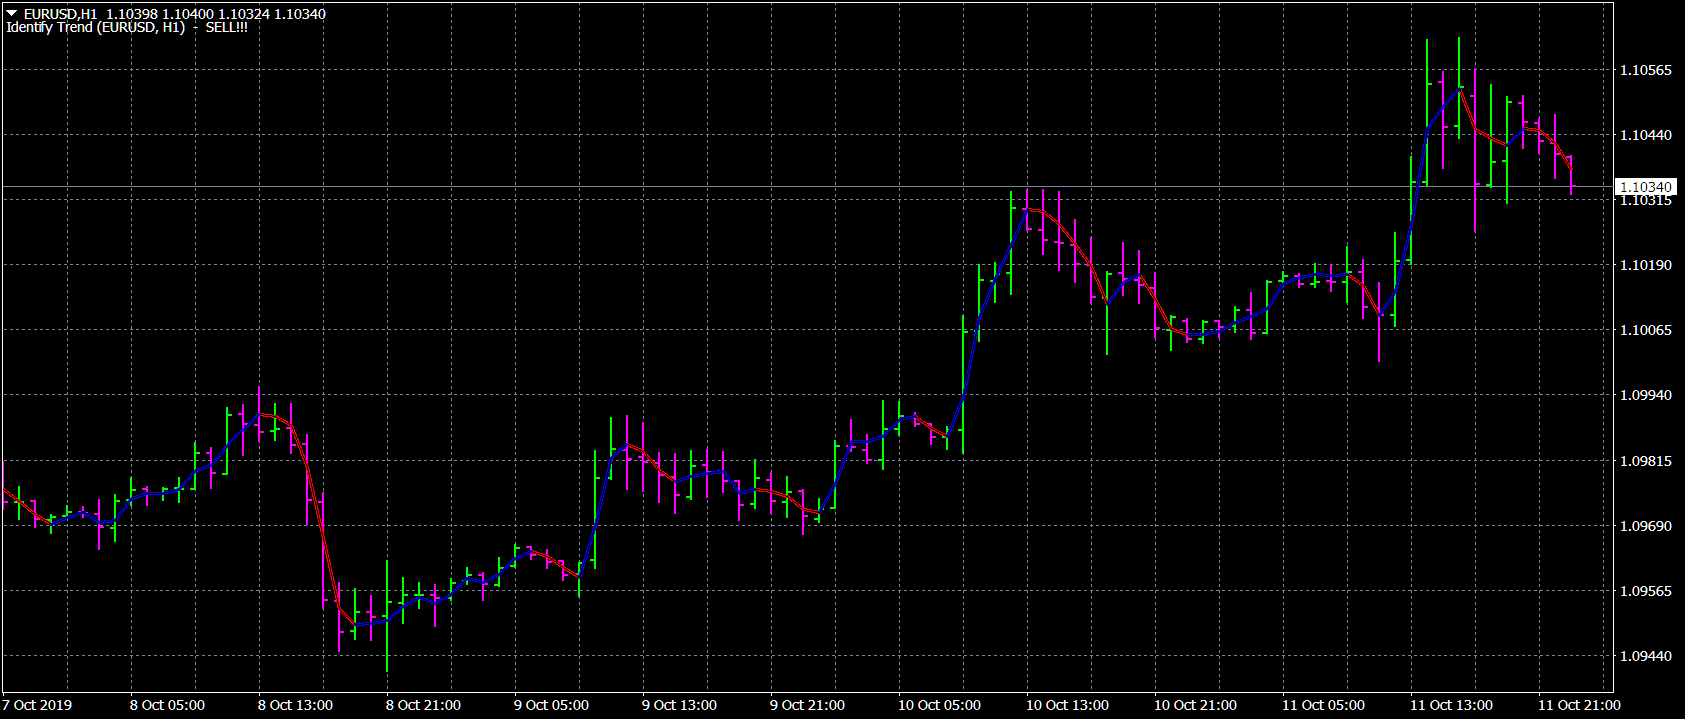
1) 🏆 Indikatoren mit optimaler Filterung von Marktgeräuschen (zur Auswahl von Öffnungs- und Schlusspositionen).
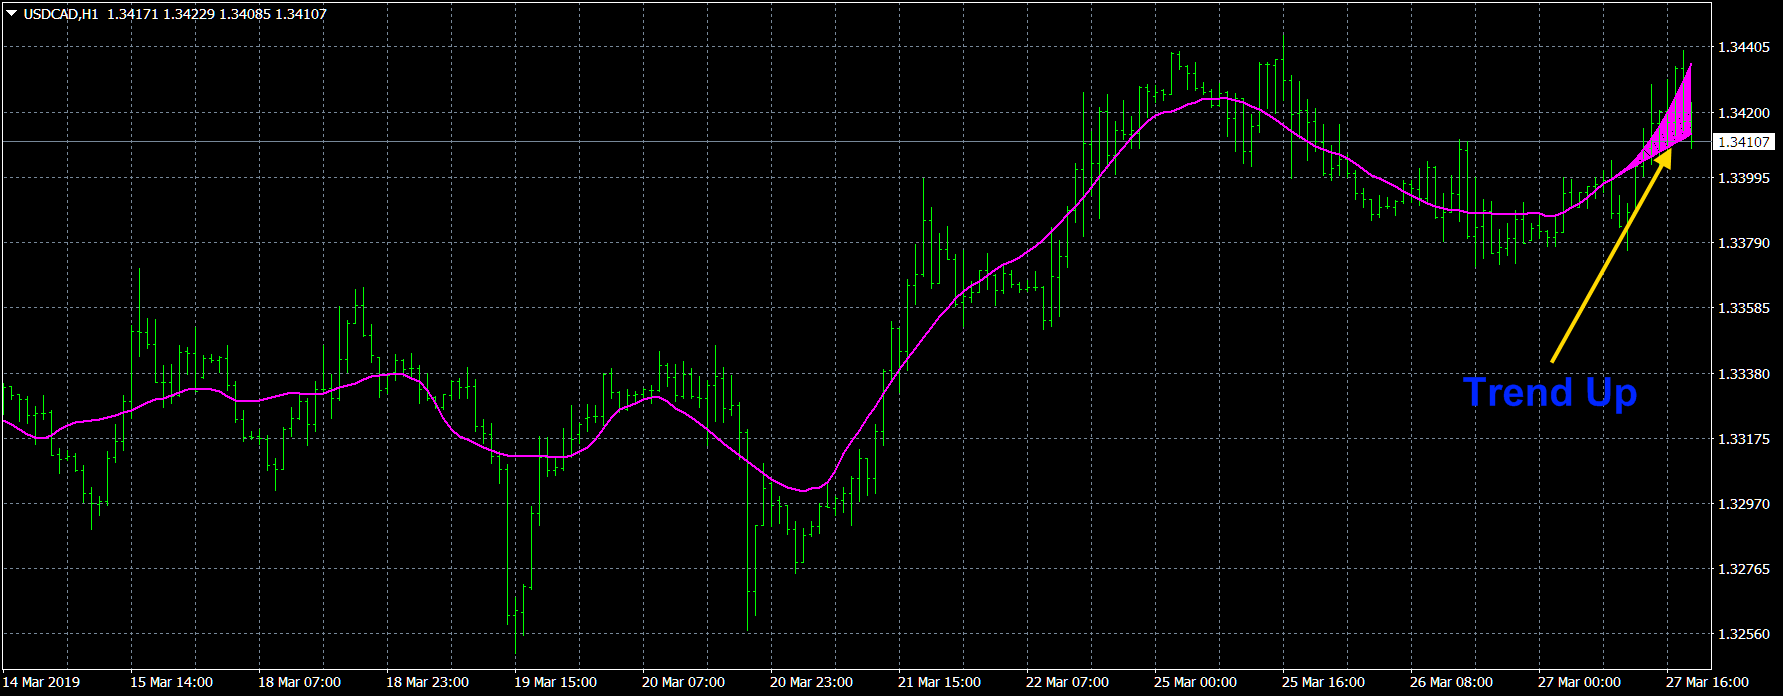
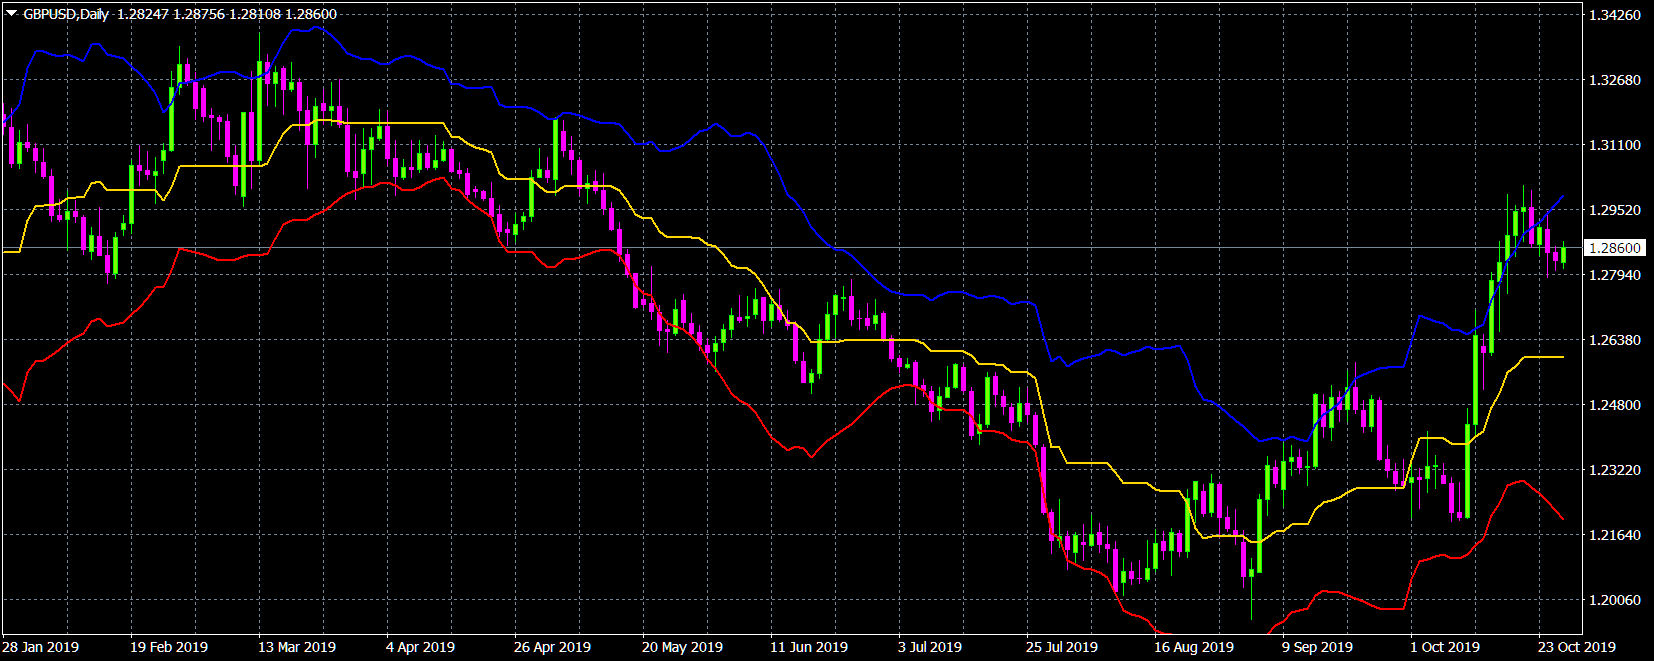
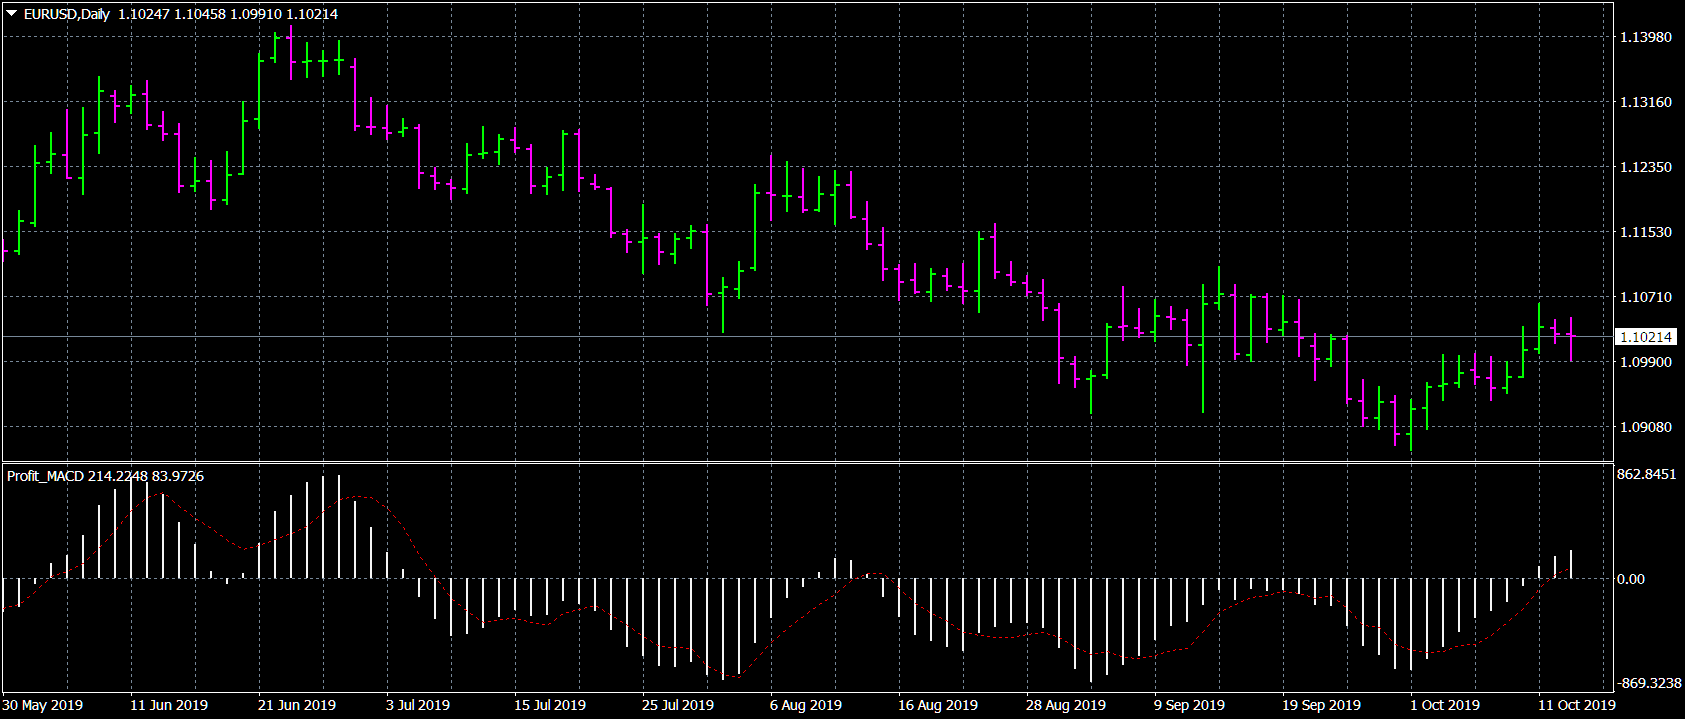
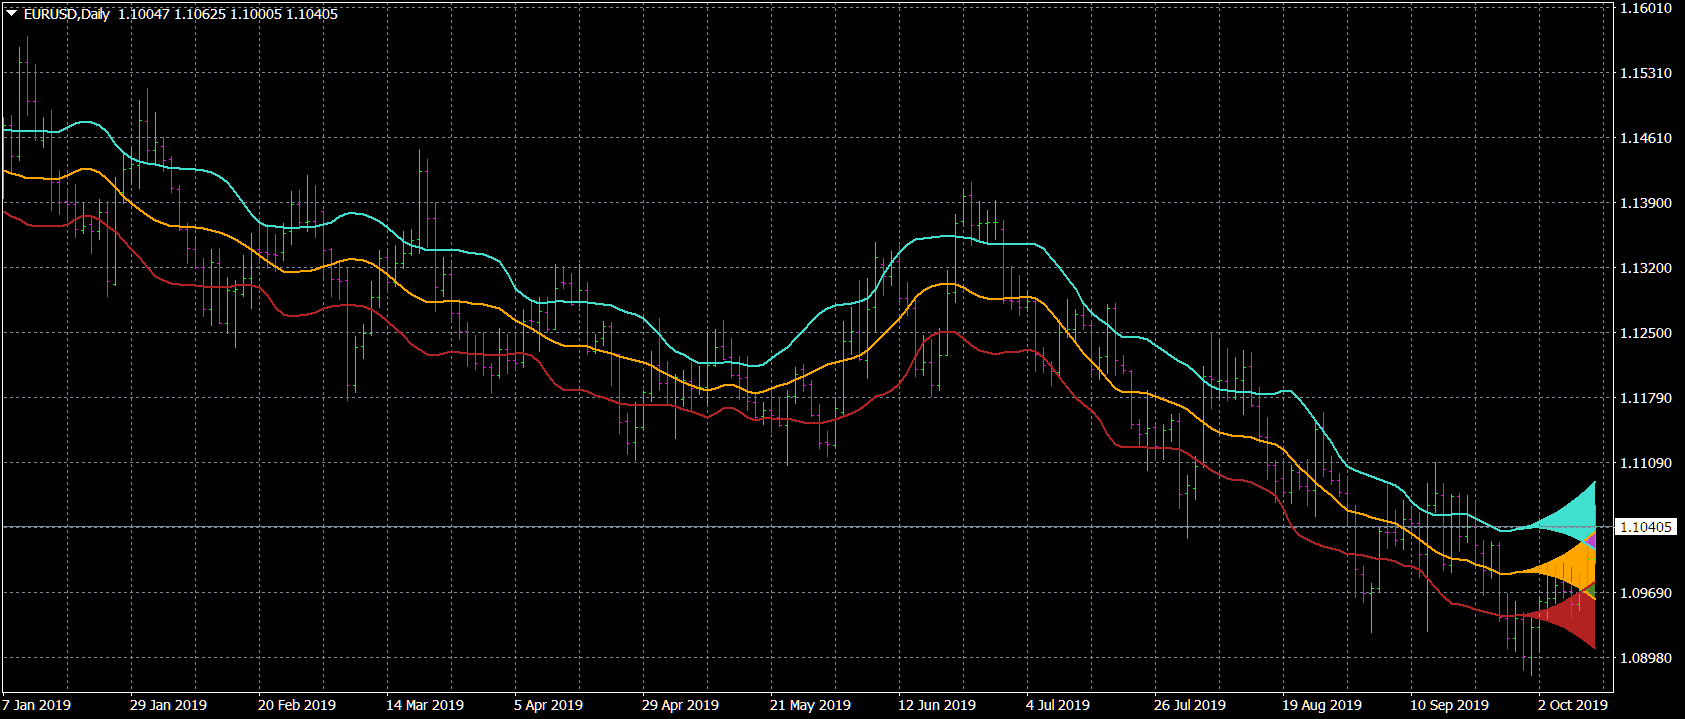
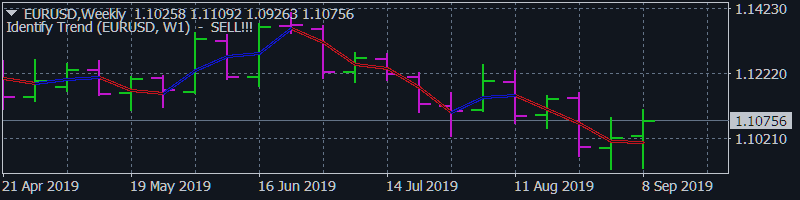
2) 🏆 Statistische Indikatoren (zur Bestimmung des globalen Trends).
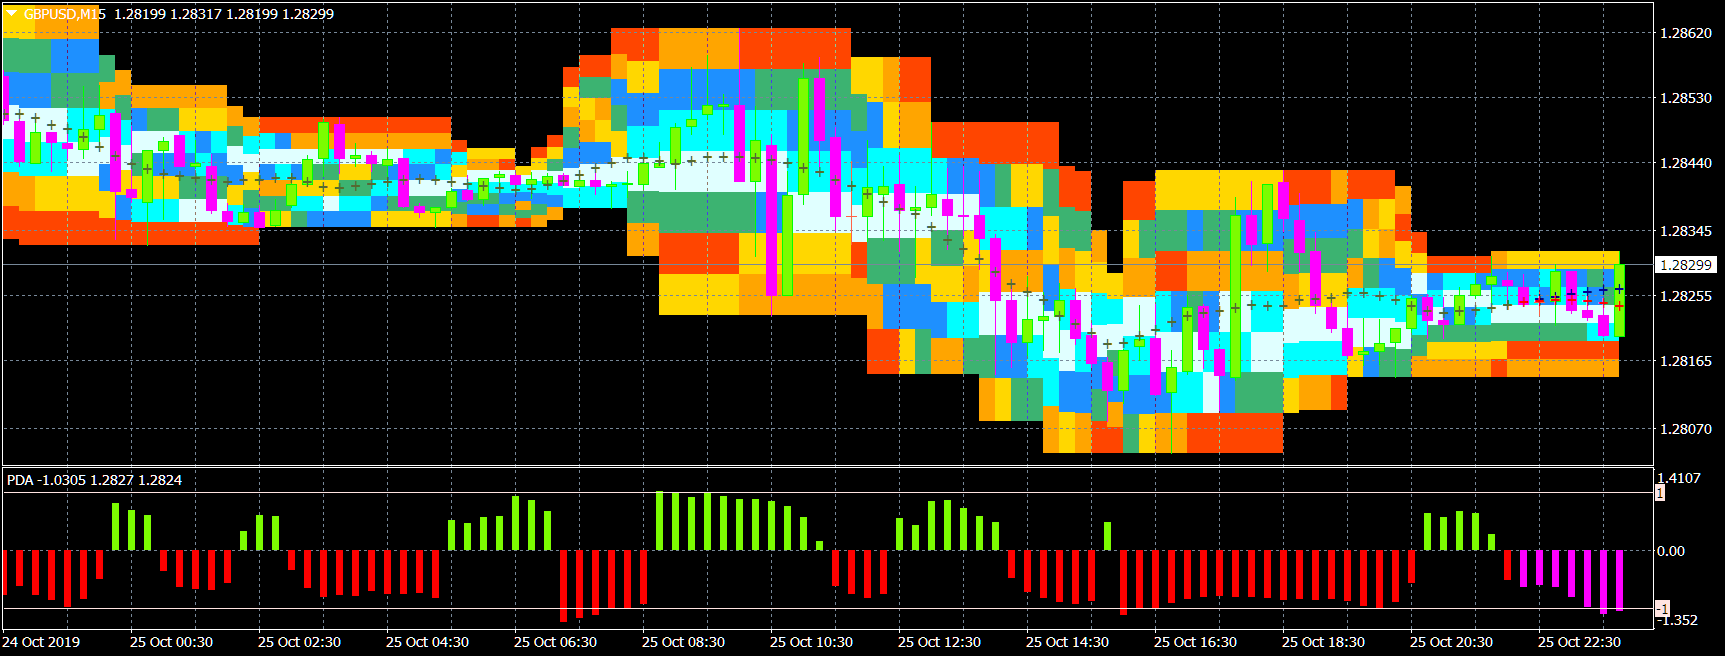
3) 🏆 Marktforschungsindikatoren (um die Mikrostruktur der Preise zu klären, Kanäle aufzubauen, Unterschiede zwischen Trendumkehrungen und Pullbacks zu identifizieren).
------------------------------------------------------------------------------------------
☛ Weitere Informationen im Blog https://www.mql5.com/en/blogs/post/741637
Der Indikator wird verwendet für: Definition von Preiswahrscheinlichkeitsverteilungen. Dies ermöglicht eine detaillierte Darstellung des Kanals und seiner Grenzen sowie die Vorhersage der Wahrscheinlichkeit des Auftretens eines Preises in jedem Segment seiner Schwankungen; die Definition des Zeitpunkts des Kanalwechsels. Funktionsprinzipien und Merkmale Der Indikator analysiert den Kursverlauf auf niedrigeren Zeitskalen und berechnet die Wahrscheinlichkeitsverteilung des Preises auf höheren
The indicator predicts the price in accordance with the prevailing trend and its own small statistical price fluctuations around this trend.
PDP indicator is used for:
1.defining price probability distributions. This allows for a detailed representation of the channel and its borders and forecast the probability of a price appearing at each segment of its fluctuations;
2.defining the channel change moment.
Signal Bands is a sensitive and convenient indicator, which performs deep statistical processing of information. It allows to see on one chart (1) the price trend, (2) the clear price channel and (3) latent signs of trend change. The indicator can be used on charts of any periods, but it is especially useful for scalping due to its high sensitivity to the current market state.
The Sensitive Signal (SS) indicator, using the filtering methods developed by the author, allows, with a high degree of probability, to establish the beginning of the true (filtered from interference - random price walks) trend movement. It is clear that such an indicator is very effective for trading on the currency exchange, where signals are highly distorted by random noise.
I present an indicator for professionals. ProfitMACD is very similar to classic MACD in appearance and its functions. However, ProfitMACD is based on completely new algorithms (for example, it has only one averaging period) and is more robust, especially on small timeframes, since it filters random price walks.
The indicator predicts the price in accordance with the prevailing trend and its own small statistical price fluctuations around this trend.
I present an indicator for professionals. ProfitMACD is very similar to classic MACD in appearance and its functions. However, ProfitMACD is based on completely new algorithms (for example, it has only one averaging period) and is more robust, especially on small timeframes, since it filters random price walks.
Das Prinzip des Indikators. Der Asummetrie-Indikator ermöglicht es Ihnen, den Beginn einer Trendwende vorherzusagen, lange bevor diese auf dem Kursdiagramm sichtbar wird. Der Autor hat statistisch nachgewiesen, dass vor dem Wechsel der Trendrichtung die Wahrscheinlichkeitsverteilungsfunktion des Preises so asymmetrisch wie möglich gestaltet wird. Genauer gesagt, die Preisbewegung in eine beliebige Richtung zieht die Funktion ihrer Verteilung immer seitwärts, aber wenn die Wurzel dritten Grades
Signal Bands is a sensitive and convenient indicator, which performs deep statistical processing of information. It allows to see on one chart (1) the price trend, (2) the clear price channel and (3) latent signs of trend change. The indicator can be used on charts of any periods, but it is especially useful for scalping due to its high sensitivity to the current market state.
The indicator predicts the price in accordance with the prevailing trend and its own small statistical price fluctuations around this trend.
The StatChannel indicator is constructed in the same way as a classic Bollinger Bands indicator, but only on the basis of the non-lagging moving average. Such a curve is calculated at points (Inf, n + 1], as a moving average at the segment (Inf, 0], where 0 is the number of the last bar, shifted back by n bars, and at the points of the segment [n, 0] it is estimated. The estimate is a curvilinear sector (sweeping confidence interval) in which the line of the non-lagging moving average is laid with a given confidence level. The non-lagging average is also surrounded by non-lagging std, which is determined at points at points (Inf, n + 1) in the same way as the non-lagging moving average, and at points of the segment [n, 0] - by a special algorithm that calculates the set of values std, that will be within the specified value of the confidence interval.
Description of the slides.
1. With quiet natural price movement, its tendency is determined and a position is opened.
2. There is an artificial process of price consolidation.
3. The artificial consolidation process is completed and the price continues its natural movement, closing the position.

