Regardez les tutoriels vidéo de Market sur YouTube
Comment acheter un robot de trading ou un indicateur
Exécutez votre EA sur
hébergement virtuel
hébergement virtuel
Test un indicateur/robot de trading avant d'acheter
Vous voulez gagner de l'argent sur Market ?
Comment présenter un produit pour qu'il se vende bien
Indicateurs techniques payants pour MetaTrader 4 - 13

This indicator tool provides mini charts, with adjustable symbol/tf that can be dragged and resized into place. Lightweight operation with multiple mini charts are supported.
Chart features: adjustable symbol and tf draggable resizeable multiple mini charts color styling and font sizing, foreground/background colors candle coloring candle styles; candles, bars, line, high-low channel
optional background color gradient predfined period separators on all tf's (eg 1hr/1day sep on 1Min, 4hr/1day
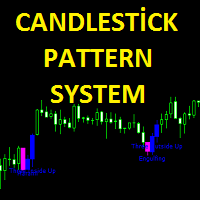
Candlestick pattern system finds 40 candle formations. Features Has the feature to send the notification. It has candlestick patterns feature. Bullish patterns feature. Bearish patterns feature. Trend filter and reliability features.
Parameters Show alert - Send alert Send email - Send alerts to mail address. Look back - Retrospective calculation === PATTERN SETUP === Show bullish patterns - Open close feature Show bearish patterns - Open close feature Trend filter - Open close feature

Supertrend indicator uses a combination of a moving average and average true range to detect the trend of a trading instrument.
Supertrend indicator for MetaTrader 5 easily shows the trend as a line following the price.
USAGE THIS INDICATOR If the closing prices are above Supertrend Line, there is a Bullish sentiment at that moment. The opposite is a Bearish sentiment. Three green lines - Strong Bullish sentiment. Three red lines - Bearish sentiment.
For BUY : - Three green lines and pr
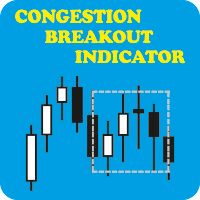
CONGESTION BREAKOUT INDICATOR: When you see a sideways price movement in a meaningless market, what goes through your mind? Is it a danger, an opportunity or completely a vacuum? Let's see if we can avoid the latter and focus on using it to our advantage. The ability to read price action through the display of rectangles on the chart could be the boost you need to achieve your trading goals. What is congestion? Congestion is a market situation where the price is trading around a particular leve

Average Daily Weekly Monthly Range Alerts.
The most complete multi-period dynamic range indicator with full alert options. Visually displays the Average Range lines on chart + real time distances to the Range Highs and Lows. Notifications are sent when the average ranges are hit. An essential tool for any serious trader! Average period ranges, especially the ADR (Average Daily Range) for day traders, are one of the most useful and consistently reliable indicators available to traders. Always a

I developed a special algorithm indicator
Indicator EXACTLY-SR-LEVELS looks for confluence of at least two combination algorithm levels (day+week,day+mont,day+year, week+month, week+year,month+year)
LEVELS ARE NOT REDRAWN IF THE NEW HIGH / LOW INDICATOR IS CALCULATING NEW LEVELY AND DRAWS IN THE GRAPH
On a new low/high day - the S/R day is recalculed. On a new low/high week - the S/R week is a recalculed On a new low/high month - the S/R month is a recalculed On a new low/high year - the
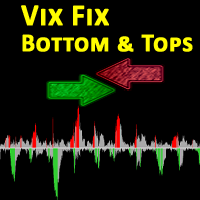
The VIX Fix is a volatility indicator developed by renowned trader Larry Williams. It's designed to measure volatility in assets that don't have options or futures, such as individual stocks and forex markets. Essentially, it acts as a synthetic VIX (Volatility Index) for any asset , providing a gauge of market uncertainty. This modified version of William's indicator helps you to find market bottoms and market tops. It comes with 2 styles: Stochastic and histogram style. Please see screenshot

MT5 Version Kill Zones
Kill Zones allows you to insert up to 3 time zones in the chart. The visual representation of the Kill Zones in the chart together with an alert and notification system helps you to ignore fake trading setups occurring outside the Kill Zones or specific trading sessions. Using Kill Zones in your trading will help you filter higher probability trading setups. You should select time ranges where the market usually reacts with high volatility. Based on EST time zone, followi

The Identify Market State indicator allows you to set the beginning of a new trends and pullbacks on an existing trend. This indicator can be used both for trading on scalper strategies and for long-term trading strategies. The indicator is based on the 14 periodic DeMarker indicator and the 8 periodic simple moving average from this indicator. Statistical studies have shown that the sharp peaks of the DeMarker indicator curve when they drop below its minimum li
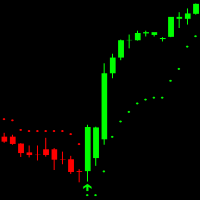
Easy Trend Indicator can be used for all forex pairs, indices and cryptocurrencies. It´s a non rapainting Trend trading indicator and works on all timeframes. GREEN candles show an uptrend and RED candles show a Downtrend. Arrows show when to enter the Market. Indicator has 7 Inputs: Max History Bars = On how many Bars in the Chart the indicator is drawn ATR Period = How many Bars are used for Average True Range calculation ATR Multiplier = Is used for Indicator sensitivity (Higher multiplier =

The principle of constructing indicator lines . Profit Trade indicator is very effective for trading. Profit Trade is a deep development of the well-known Donchian channel indicator. The upper (BlueViolet color) Dup and the lower (IndianRed) Ddn lines of the indicator are constructed in the same way as in the Donchian channel , based on the highest (high of High) and lowest (low of Low) prices for the previous n1 = 20 periods. The middle line (Gold) Dm is constructed in the sam

This is a unique multi-currency trading strategy developed for trading on H1 timeframe, which allows you to determine the global market entry points and obtain the maximum profit for each transaction. The market entry point is calculated using a variety of author equations and algorithms. We recommend using the indicator simultaneously on several trading instruments . A huge advantage of Big Deals System is an information panel in which the user can see the current information on potential entry
Hello dear friend! Here's my story. I'm fast. After many attempts to trade manually, I decided to use expert. I started writing my robot. But testing took a lot of time! In parallel, I tried other people's robots. And again I spent a lot of time testing. Night scalpers, news scalpers, intraday scalpers, and many other classes... you needed to know exactly when the robot was trading, when it was making a profit, and when it Was losing. Some robots have time-based trading features that are not de
The indicator compares quotes of the current symbol and a synthetic quote calculated from two specified referential symbols. The indicator is useful for checking Forex symbol behavior via corresponding stock indices and detecting their convergence/divergence which can forecast future price movements. The main idea is that all stock indices are quoted in particular currencies and therefore demonstrate correlation with Forex pairs where these currencies are used. When market makers decide to "buy"

MultiCurrencyWPR (MCWPR) indicator applies conventional WPR formula to plain Forex currencies (that is their pure strengths extracted from Forex pairs), market indices, CFDs and other groups of tickers. It uses built-in instance of CCFpExtraValue to calculate relative strengths of selected tickers. Unlike standard WPR calculated for specific symbol, this indicator provides a global view of selected part of market and explains which instruments demonstrate maximal gain at the moment. It allows yo

Currency Power Meter shows the power of major currencies against each other. The indicator shows the relative strength of currency/pair at the current moment in a period of time (H4, daily, weekly, monthly). It is useful for day traders, swing traders and position traders with suitable period options. Currency power is the true reason of market trend: The strongest currency against the weakest currency will combine into a most trending pair. As we know, trend makes money and all traders love tre
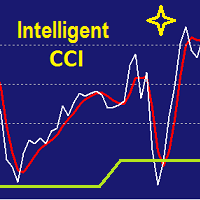
It is CCI indicator with very smooth and noiseless movement that calculates four levels of buy, sell, overbought and oversold dynamically. Professional traders know well that level of 100, 200 or -100 and -200 are not always right and need fine adjustments. This indicator calculates those levels dynamically by using mathematics and statistic methods in addition to shows divergence between indicator and price. Like original CCI, for best result you have better to set proper value for CCI period b

"Trend reversal ml4" est un indicateur unique conçu pour déterminer les moments de retournement de prix en temps réel. Il s'agit d'un système commercial prêt à l'emploi pour Metatrader4. L'indicateur ne redessine pas ses valeurs ! Basé sur des algorithmes avancés et une analyse technique, cet indicateur vous fournit des signaux clairs sur les points d'entrée et de sortie possibles du marché, vous aidant ainsi à prendre des décisions éclairées.
Avantages de l'indicateur : haute précision du si

Real Trade négocie sur des délais inférieurs à 1 heure. Tradez dans les directions haussières et baissières. Négociez avec les directions de tendance temporelle les plus élevées et négociez la première bougie. Utilisez le contraire pour sortir ou utilisez le ratio pour sortir 1:1 ou plus avec des arrêts de fuite. Négociez les tendances réelles pendant les heures actives et avec une direction de tendance plus élevée pour obtenir les meilleurs résultats. Indicateur de charge dans le testeur pour

The Professional Signal that A Swing / Daily / Scalping / Binary Options trader MUST HAVE ! Suitable For ALL kind of Financial Instruments (FX Currencies, Commodities, Indices, Stock CFDs and Crytocurrencies) For the last 12 years, Our team has studied on the price action of currency pairs and created an innovation of signal indicator based on the AI technology. Based on know-how of the professionals, we have designed a AI deep-learning model and tuned the model by learning fro
Mettre à jour! Des flèches ont été ajoutées aux niveaux 100 et 200.
Cet indicateur est précis pour accéder aux extrêmes et prend en charge les positions d'achat principalement pour des périodes de 1 minute. D'autres délais peuvent être utilisés mais les niveaux sont différents. C'est un meilleur oscillateur et se compare avec d'autres pour voir la différence.
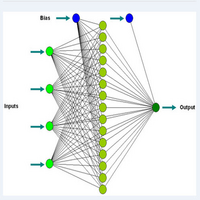
Commerce de jour utilisant des concepts de réseau neuro. Cet indicateur utilise des formes élémentaires de réseaux neuro pour génére
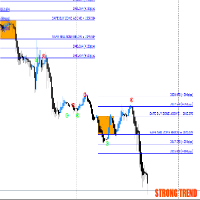
Introducing Breakout scalper system(BSS), an innovative and robust trading solution designed to elevate your trading experience to new heights. This sophisticated MetaTrader 4 compatible system is meticulously crafted to empower traders with precise buy and sell levels, strategic targets, and timely signals, all delivered with utmost accuracy and efficiency. Key Features: Buy and Sell Levels: Gain a competitive edge with carefully calculated buy and sell levels, providing you with clear entry an

Description
SuperCCI is an indicator based on the standard CCI indicator. It identifies and displays convergences/divergences in the market and forms the corresponding entry points. Also, using the trading channel index, it determines the direction of the trend and displays the levels of support and resistance .
Features Not repaint. Shows entry points. Shows the direction of the current trend and support/resistance levels. Has notifications. Recommendations
Use convergence/divergence to

This is first public release of detector code entitled "Enhanced Instantaneous Cycle Period" for PSv4.0 I built many months ago. Be forewarned, this is not an indicator, this is a detector to be used by ADVANCED developers to build futuristic indicators in Pine. The origins of this script come from a document by Dr . John Ehlers entitled "SIGNAL ANALYSIS CONCEPTS". You may find this using the NSA's reverse search engine "goggles", as I call it. John Ehlers' MESA used this measurement to

The Fair Value Gap (FVG) is a price range where one side of the market liquidity is offered, typically confirmed by a liquidity void on the lower time frame charts in the same price range. Price can "gap" to create a literal vacuum in trading, resulting in an actual price gap. Fair Value Gaps are most commonly used by price action traders to identify inefficiencies or imbalances in the market, indicating that buying and selling are not equal. If you're following the ICT Trading Strategy or Smart

Détecteur de pertes optimalesL'utilisation des techniques de stoploss habituelles et populaires, comme les stoploss fixes ou le placement sous les hauts et les bas précédents, est désavantageuse pour un certain nombre de raisons :1. Les courtiers connaissent déjà ces zones, il leur est donc facile de les prendre. 2. Vous ne pouvez pas toujours utiliser un stoploss fixe avec un marché car il peut devenir très large ou très fin à différents moments, et vous prenez moins du marché ou vous vous expo
L'indicateur Optimal Trailing TP peut fonctionner à la fois comme un outil d'entrée et comme un outil de suivi des bénéfices. Sa conception unique lui permet de fournir des signaux d'achat et de vente. Si vous êtes déjà en position, vous pouvez ignorer les flèches de signal. Si vous n'êtes pas en position, les flèches peuvent vous alerter d'un mouvement dans cette direction sur l'échelle de temps ou la paire de devises sur laquelle l'indicateur est réglé. Ainsi, vous pouvez soit utiliser les flè
L'indicateur MTF Optimal Trailing TP fonctionne exactement comme le trailing take profit optimal mais imprime les signaux sous forme de barres au lieu de flèches et imprime pour deux horizons temporels différents en même temps.
Il peut servir à la fois d'outil d'entrée et de prise de bénéfices. Nous l'utilisons à la fois comme outil d'entrée et de prise de profit.
La meilleure façon de l'utiliser est la suivante :
Trouvez un mouvement sur une période plus élevée en utilisant le tableau de
Indicateur converti à partir d'une autre plateforme codée par LuxAlgo.
J'ai ajouté des moyennes mobiles de types différents et des sources de données variées. Dans la version originale, la moyenne mobile est une SMA et la source de données du marché n'est constituée que de la clôture des bougies.
Dans cette version, vous pouvez sélectionner plusieurs types de moyennes mobiles et également des données sources comme high/low/HL2/HLC/HLC2/... .
Voici quelques détails fournis par le développ
Cet indicateur trace jusqu'à 6 niveaux qui peuvent être activés / désactivés pour rendre le graphique plus propre selon les exigences du commerçant
Ces 6 niveaux sont en 2 ensembles : Haut et Bas
Pour chaque ensemble, différents délais peuvent être sélectionnés
Il est basé sur la stratégie d'inversion du précédent haut bas, car il est considéré que le prix montre généralement un rejet dans un délai plus court comme 5 minutes lorsque le prix atteint le haut bas quotidien, hebdomadaire ou m

Indicateur équipé d'un système de calcul du taux de gain [Caractéristiques de l'indicateur] Cet indicateur vous permet de confirmer intuitivement et facilement une analyse technique régulière avec des signaux de signalisation. De plus, il peut vérifier le taux de gain des paramètres actuels et comprend un système de détermination automatique du taux de gain qui évite de donner des signaux lorsque le taux de gain est faible. Cela réduit les entrées inutiles et vous permet de saisir des transac

DAYTRADING POUR LES ACTIONS (CFD) uniquement.
Le commerce demande du travail. Il n'y a pas de raccourcis ou d'indicateurs qui vous indiqueront toutes les entrées et sorties. Le profit vient de l'état d'esprit. Les indicateurs sont des outils à utiliser conjointement avec la gestion de l'argent et la psychologie du succès. Trouvez les déséquilibres dans le profil de volume. Déséquilibres du volume des prix commerciaux.
De nombreux déséquilibres se produisent à la clôture et à l'ouverture et
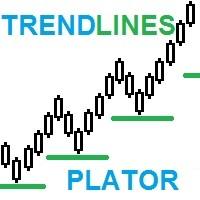
TrendLines Plator : Optimisez vos stratégies de trading avec un indicateur avancé de projection de tendances Explorez le potentiel de notre indicateur innovant ! Avec la capacité d'analyser et de projeter des lignes de tendance à partir de plages de temps plus longues directement sur votre période de temps actuelle, il offre un support stratégique qui attire l'attention des traders en général. Ces points deviennent des niveaux stratégiques de support ou de résistance pour vos opérations, renforç

Description
The base of this indicator is an ZigZag algorithm based on ATR and Fibo retracement. The ZigZag can be drawn like a classic ZigZag or like Arrows or needn't be drawn at all. This indicator is not redrawing in sense that the ZigZag's last shoulder is formed right after the appropriate conditions occur on the market. The shoulder doesn't change its direction afterwards (can only continue). There are some other possibilities to show advanced information in this indicator: Auto Fibo on

All patterns from Encyclopedia of Chart Patterns by Thomas N. Bulkowski in one indicator. It draws an up or down arrow whenever a pattern is identified. Patterns are selected in the drop-down list of the Pattern variable (located at the beginning of the properties window). The indicator has numerous external parameters, some of them apply to all patterns, while others are selective. To see more information on the parameters used for the selected pattern, enable the ShowHelp variable (located at
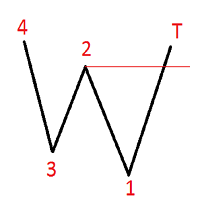
ZigZag Alert The indicator is based on the standard ZigZag.
Displays on the chart and signals the emergence of a certain formed pattern.
At the user's choice, the indicator signals are displayed in the terminal, or an e-mail to the address,
or sends a notification to the mobile terminal. Pattern conditions for the upward movement signal:
the price at point 4 must be higher than the price at point 2, the price at point T must be higher than the price at point 2.
When moving down, on the co
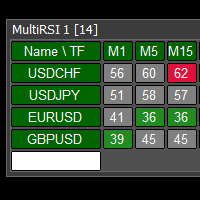
This tool monitors RSI indicators on all time frames in the selected markets. Displays a table with signals to open a BUY trade (green) or SELL trade (red). You can set the conditions for the signal. You can easily add or delete market names / symbols. If the conditions for opening a trade on multiple time frames are met, you can be notified by e-mail or phone message (according to the settings in MT4 menu Tools - Options…) You can also set the conditions for sending notifications. The list of s
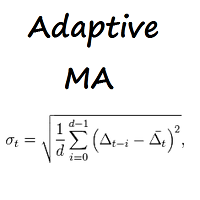
Moving Average. Calculation method: average value of all prices used for determining a bar.
Description of External Settings of the EA: MA_period - period of averaging for calculation of the indicator. Recommended values: 5, 13, 21, 34. ma_method - averaging method. It can have any values of the Moving Average method (Moving Average). 0 - (SMA) Simple Moving Average. 1 - (EMA) Exponential Moving Average. SMMA 2 - (SMMA) Smoothed Moving Average. LWMA 3 - (LWMA) Linear weighed Moving Average.

Il s'agit d'un indicateur MTF des niveaux de support et de résistance basé sur les extremums de l'indicateur Advanced ZigZag Dynamic et/ou Extended Fractals avec des étiquettes de prix (peut être désactivé). Des TF plus élevés peuvent être sélectionnés pour le mode MTF. Par défaut, les niveaux sont générés en fonction des points indicateurs ZigZag. Les points indicateurs de fractales peuvent également être utilisés avec ZigZag ou à sa place. Afin de simplifier l'utilisation et d'économis

CHART OBJECTS: Blue box : Bullish Order Blocks (OB) Red box : Bearish OB Orange box : Mitigated OB. Price bounce from this area the made a new high/low Light gray box : Price bounced from this area but did not made a new high/low Dark gray box : Broken OB. Filled boxes : TimeFrame 1 Order Blocks
Unfilled boxes : TimeFrame 2 Order Blocks
INDICATOR SETTINGS: Order Block Required Length: Required number of subsequent candles in the same direction to identify Order Block. Default value: 5 Im

The Moving Average Crossover Dashboard indicator is a technical tool that displays the crossovers of 2 selected moving averages on the price chart indicating whether it is a bullish or bearish crossover. In addition, as its name indicates, it shows a signal dashboard that indicates in which market and time frame a crossover of the two moving averages occurs. In the setting window the user can select the markets and time frames that can be displayed on the dashboard. You also have the option

L'indicateur montre des modèles harmoniques sur le graphique sans repeindre avec le minimum de décalage possible. La recherche de sommets d'indicateurs est basée sur le principe des vagues de l'analyse des prix. Les paramètres avancés vous permettent de choisir les paramètres de votre style de trading. À l'ouverture d'une bougie (barre), lorsqu'un nouveau motif se forme, une flèche de la direction probable du mouvement des prix est fixée, qui reste inchangée. L'indicateur reconnaît les modè
Military dog s-army will help you identify entry points for the Indian processing. He works for all the peridos. You can open the ADR levels from the settings by double-clicking on the strategy. If you turn off the ADR feature, it will find more transactions.
In particular, in addition to your own strategy, it allows you to pass your processing inputs through a better quality filter.
Do you want the ADR level to average a certain daily volume and signal the trading when the number of points
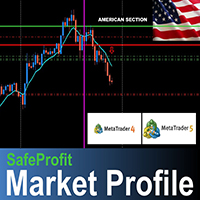
The SafeProfit Market Profile is the most advanced tracking indicator in the Forex Market. It was developed to track the market profile of each session of the day: Asian, European and American. With this indicator you will operate Intraday smiling ... knowing exactly where the Big Players are positioned and the exact moment where they are going to. The indicator is simple, fast and objective, tracking every movement of the Big Players in price. Get out of the 95% statistic that only loses and us
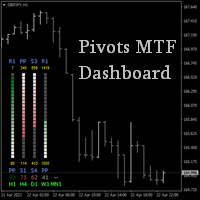
Si vous négociez par niveaux, cet indicateur est fait pour vous.
L'indicateur affiche les niveaux de support et de résistance pour les périodes sélectionnées, indiquant en outre le nombre de points par rapport aux niveaux les plus proches, ainsi que les niveaux entre lesquels se situe le prix actuel sous la forme d'une échelle de couleurs et de pourcentages.
L'emplacement n'importe où sur le graphique, la possibilité de mise à l'échelle, le décalage de calcul prenant en compte la différence

Cet indicateur multi-temps et multi-symboles identifie le moment où la ligne de signal stochastique croise la ligne principale stochastique. En prime, il peut également rechercher les bandes de Bollinger et les croisements de surachat/survente RSI. Combiné à vos propres règles et techniques, cet indicateur vous permettra de créer (ou d'améliorer) votre propre système puissant. Caractéristiques Peut surveiller tous les symboles visibles dans votre fenêtre Market Watch en même temps. Appliquez l'i

L'indicateur montre le calendrier des communiqués de presse économiques sur le graphique. Les nouvelles sont chargées à l'aide d'un utilitaire gratuit que vous pouvez télécharger ici . Le calendrier est chargé une fois en début de semaine. Vous pouvez personnaliser la liste des pays requis (devises). L'actualité est divisée en 4 catégories d'importance : élevée, moyenne, faible et autres. Par défaut, l'indicateur affiche les données de la semaine en cours. Il existe 4 tampons de dé

Ultimate Consecutive Bar Scanner (Multi Pair And Multi Time Frame) : ---LIMITED TIME OFFER: NEXT 25 CLIENTS ONLY ---46% OFF REGULAR PRICE AND 2 FREE BONUSES ---SEE BELOW FOR FULL DETAILS Unlike the equity markets which tend to trend for years at a time, the forex market is a stationary time series.
Therefore, when prices become severely over extended, it is only a matter of time before they make a retracement.
And eventually a reversal. This is a critical market dynamic that the institution

Full Market Dashboard (Multi Pair And Multi Time Frame) : ---LIMITED TIME OFFER: NEXT 25 CLIENTS ONLY ---46% OFF REGULAR PRICE AND 2 FREE BONUSES ---SEE BELOW FOR FULL DETAILS One of the biggest advantages the institutions have, is their access to enormous amounts of data.
And this access to so much data, is one of the reasons they find so many potential trades.
As a retail trader, you will never have access to the same type (or amount) of data as a large institution.
But we created this

Ultimate Divergence Scanner (Multi Pair And Multi Time Frame) : ---LIMITED TIME OFFER: NEXT 25 CLIENTS ONLY ---46% OFF REGULAR PRICE AND 2 FREE BONUSES ---SEE BELOW FOR FULL DETAILS It is a widely known market principle that momentum generally precedes price.
Making divergence patterns a clear indication that price and momentum are not in agreement.
Divergence patterns are widely used by institutional traders around the world. As they allow you to manage
your trades within strictly de

Ultimate Reversal Scanner (Multi Pair And Multi Time Frame) : ---LIMITED TIME OFFER: NEXT 25 CLIENTS ONLY ---46% OFF REGULAR PRICE AND 2 FREE BONUSES ---SEE BELOW FOR FULL DETAILS Reversal patterns are some of the most widely used setups in the institutional trading world.
And the most (statistically) accurate pattern of them all is called the ' Three Line Strike '. According to Thomas Bulkowski ( best selling author and a leading expert on candlestick patterns ),
the ' Three Line Strik
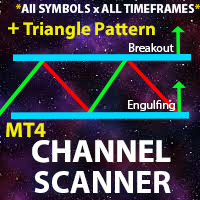
** All Symbols x All Timeframes scan just by pressing scanner button ** *** Contact me after the purchase to send you instructions and add you in "Channel Scanner group" for sharing or seeing experiences with other users. Introduction: The Channel pattern is described as the area located between two trend lines. This area is used for a measure of a trading range. In this case, the upper trend line connects price highs while the lower trend line connects price lows. Also when it comes to breakout

Algorithmic Signals indicator is not an indicator but a strategy that generates entry/exit signals. The entry arrows are formed after multiple conditions are met. The indicator is using an Adaptive Algorithm which automatically adjust to the symbol and time frame (see the screenshots below) . Signals can be used for scalping or even trend trading. Main features:- Non repainting signals Entry signals Exit signals Alert for price reaching 1 x ATR(14) (could be utilized for initial take prof

Информационный индикатор, показывающий самые важные торговые уровни для внутридневной торговли, и не только. О понятии уровней «Поддержка» и «Сопротивление».
Всем известно, что исторический ценовой диапазон цен состоит из уровней от которых в прошлом, были значимые движения.
И уровни работающие в прошлом, наверняка будут работать и сейчас. К примеру, уровень, находящийся снизу текущей цены
является уровнем «Поддержки», если от него ранее было значительное движение. К примеру, уровень,

Market Trend Catcher indicator analyzes the duration of trend movements and, with a certain development of the current trend, offers market entry points in the form of arrows with recommended profit targets. The indicator is very easy to use and does not require a lot of information to understand how it works. It has a minimum of settings and is transparent in understanding the principle of its operation, fully displaying the information on the basis of which it makes decisions on recommending e

This is a multi-currency author strategy, designed for trading on the M1, M5, M15, М30, Н1, Н4. Entry points are calculated using custom formulas and algorithms that allow you to effectively determine current trend in the market, obtain the entry points (buy/sell) and the optimal levels to close orders. The Cosmic Diviner Scalper System indicator can be used on any Forex pairs. The detailed guide on how to use the indicator is provided in the blog: https://www.mql5.com/en/blogs/post/719602 A hug

The indicator (Current Strength) is represented in a separate window by Blue and Pink histogram . The parameter NPeriod represents the number of bars on which we calculate the variation of forces, the recommended value is 5. The Blue histogram measures the buyers force , while the Pink histogram measures the sellers force . The change in color signifies the change in strength which leads t he price . Each drop (especially below 52.8) after touching levels 96.3 or 1.236 must be condidered

Présentation de M. Fibonacci , un indicateur étonnant conçu pour simplifier le processus de dessin et d'ajustement des niveaux de Fibonacci sur votre graphique. Cet indicateur offre des options de personnalisation exceptionnelles aux traders professionnels, leur permettant de tracer n'importe quel niveau de Fibonacci avec précision. De plus, il fournit des notifications mobiles, des alertes par e-mail et des alertes contextuelles lorsque le prix atteint les niveaux de Fibonacci, vous assuran
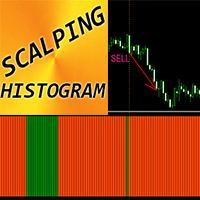
Forex Indicator "Scalping Histogram" for MT4 Scalping Histogram indicator can be used for search of entry signals into the main direction price momentum after minor price correction Scalping Histogram can be in 2 colors: orange for bearish momentum and green for bullish one . Once you see at least 10 consecutive histogram bars of the same color it means strong momentum takes place Entry signal is 1 column with opposite color in histogram and next column with initial momentu

L'indicateur technique Smart Awesome Volume est conçu pour mesurer la dynamique du marché en combinant les données de volume des bougies et en les filtrant avec une moyenne pour fournir des signaux précis. Il se concentre sur le concept de "volume confirme le prix", permettant aux traders d'identifier facilement la dynamique du marché et la bataille entre acheteurs et vendeurs au sein de chaque bougie. Grâce à son système d'alerte rapide, les traders peuvent rester au courant des événements

[75% OFF! - SALE ENDS SOON] - RevCan Trend Entry Point is a trend based trade alert indicator for serious traders. It does all the price and chart analysis all by itself, and whenever it finds any potential high quality trading opportunity(Buy or Sell) using its revolutionized price prediction algorithms, it sends instant trade alert directly on the chart, MT4 terminal and on the mobile device. The trade signals will be visible on the chart as Up and Down arrows, while the instant audible aler

Ants Lite ATR allows you to enter and manage your trades based on the market volatility, giving you safer entries and better exits. Based on the work by Daryl Guppy.
Features Ability to define the bar the Long and Short calculation starts from. Can be used to generate both entry or exit signals. Customizable ATR period and multiplier. GMMA is a tried and tested indicator with a long pedigree. Volatility based entry and exit signal rather than time based.
How To Use Simply drag the indicator

RiverScope automatically determines the nearest most important price levels and support and resistance zones in history, it also identifies a large number of price action patterns (30+). The support and resistance levels are determined based on an algorithm that calculates and filters the historical values of the price, its movement character, volumes, etc. It displays the current situation, therefore the nearest levels change in real time depending on the current price.
Advantages flexible cu
TendanceSwift Il est conçu pour être utilisé par n’importe qui, même le débutant absolu en trading peut l’utiliser. NE repeint JAMAIS . Les indications sont données de Close à Close. Conçu pour être utilisé seul, aucun autre indicateur n’est requis.
Comment ça marche TrensSwift utilise un indicateur de tendance interne combiné à une action sur les prix et au système Fibonacci. La stratégie est strictement appliquée sans aucun post-recalcul, lissage ou interpolation. Le « succès » de la st

Super Trend Filter Indicator Super trend Arrow Consider as a Master Candle , If super trend in Buy signal , then signal candle calculate as master candle and master candle close above the open candle then calculate filter Buy Arrow. If super trend in Sell signal , then signal candle calculate master candle and master candle close below the open candle calculate filter Sell Arrow. 3 Target with Trailing Stop Loss
Introducing the POWER TRADE indicator created by a small group of traders with a few years trading trading the financial market profitably . This is a plug and play indicator that provides you with POWERFUL Entry signals with Profit Taking and rebound zones. The indicator Works with all MT4 trading instruments. The indicator uses previous chart data as receipt to speculate on future market moves.

In case you get Laguerre S crat indicator, you will get Laguerre Scrat Ea as a Gift. To get Ea and det a iled m anu al PDF contact me PM. Default settings are for usd/cad H4 For St able Long term Profits Laguerre Scrat is a trading system based on 4 indicator combinations in the shape of one indicator. Laguerre indicator (upgraded), CCI, Bollinger bands and market volatility factor. It generates arrows in the indicator window and nuts on the price chart, doubling arrows for a better view where
Description:
This indicator (with its Fibonacci algorithm) marks Buy and Sell zones, which indicate where a trend has a higher probability of continuing either upward, or downward.
Additionally, there are horizontal lines drawn for each day, which show a high probability level of where price is likely to break out, and continue either higher, or lower. This indicator will never repaint.
Features: The main strength of this indicator is that the user is able to visually assess what the
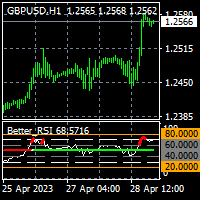
To get access to MT5 version please contact via private message. This is the exact conversion from TradingView: " Better RSI with bullish / bearish market cycle indicator" by TradeCalmly.
This is a light-load processing and non-repaint indicator. All input options are available. Buffers are available for processing in EAs. You can message in private chat for further changes you need.
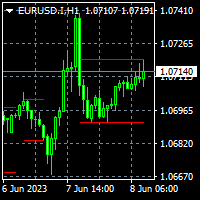
To get access to MT5 version please contact via private message. This indicator is not a standard indicator and you may get into trouble installing it. Please contact via private chat if you face trouble. This is exact conversion from TradingView: "Consolidation Zones - Live" by "LonesomeTheBlue". This is a light-load processing indicator. Updates are available only upon candle closure. Buffers are available for processing in EAs. It is a repaint indicator. So previous buffer values do not repre
Le MetaTrader Market offre un lieu pratique et sécurisé pour acheter des applications pour la plateforme MetaTrader. Téléchargez des versions démo gratuites de Expert Advisors et des indicateurs directement depuis votre terminal pour les tester dans le testeur de stratégie.
Testez les applications dans différents modes pour surveiller les performances et effectuez un paiement pour le produit que vous souhaitez en utilisant le système de paiement MQL5.community.
Vous manquez des opportunités de trading :
- Applications de trading gratuites
- Plus de 8 000 signaux à copier
- Actualités économiques pour explorer les marchés financiers
Inscription
Se connecter
Si vous n'avez pas de compte, veuillez vous inscrire
Autorisez l'utilisation de cookies pour vous connecter au site Web MQL5.com.
Veuillez activer les paramètres nécessaires dans votre navigateur, sinon vous ne pourrez pas vous connecter.