Issam Kassas / 个人资料
- 信息
|
4 年
经验
|
36
产品
|
1256
演示版
|
|
0
工作
|
0
信号
|
0
订阅者
|
I’m Issam Kassas, the developer behind Issam Algo. I build MetaTrader 5 indicators and Expert Advisors for chart analysis and trading automation.
Current OFFER: Buy Smart Trend Trading System MT5 and receive Smart Universal Expert Adviser MT5 as a free bonus.
Smart Trend Trading System MT5:
https://www.mql5.com/en/market/product/103515
Smart Universal Expert Adviser MT5:
https://www.mql5.com/en/market/product/104039
After purchasing Smart Trend Trading System, message me here on MQL5 to claim your bonus.
For product questions, setup guidance, or technical support, contact me directly through MQL5 messages.
Issam Kassas
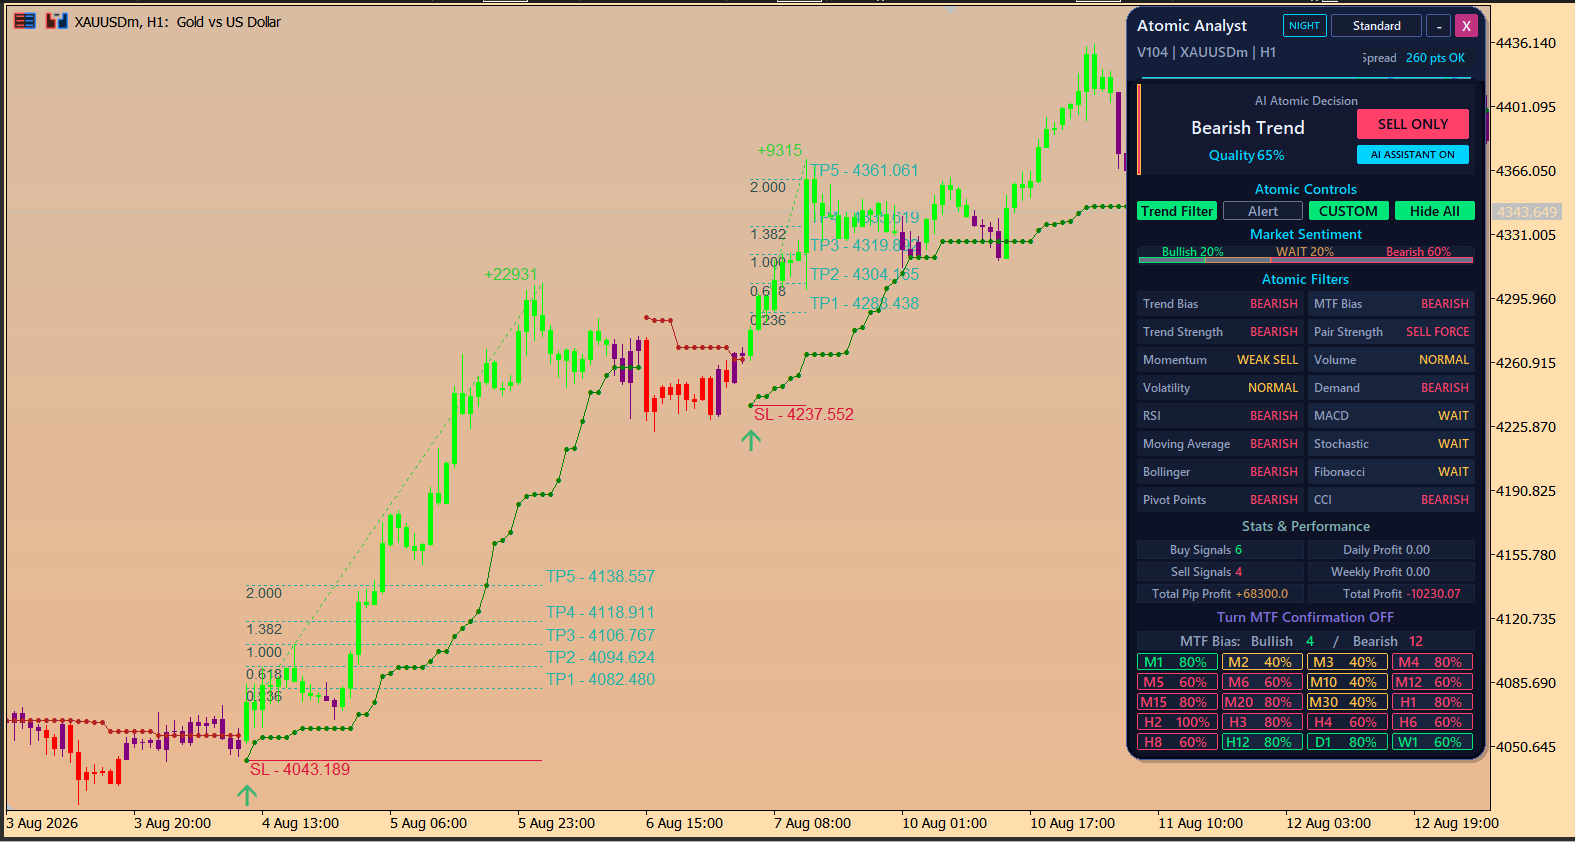
Read a bearish panel in the context of the wider chart. This historical 3-12 August 2026 XAUUSDm H1 Atomic Analyst example shows Bearish Trend and SELL ONLY after a substantial earlier rise. Momentum reads WEAK SELL, volume NORMAL, and MACD, Stochastic and Fibonacci read WAIT. The MTF summary shows Bullish 4 / Bearish 12. Compare those mixed readings with signal timing and nearby price structure before defining entry and invalidation. Displayed quality, pip and profit figures are interface statistics, not verified live returns or guarantees. Test settings on demo first.
https://www.mql5.com/en/market/product/114662
Issam Kassas
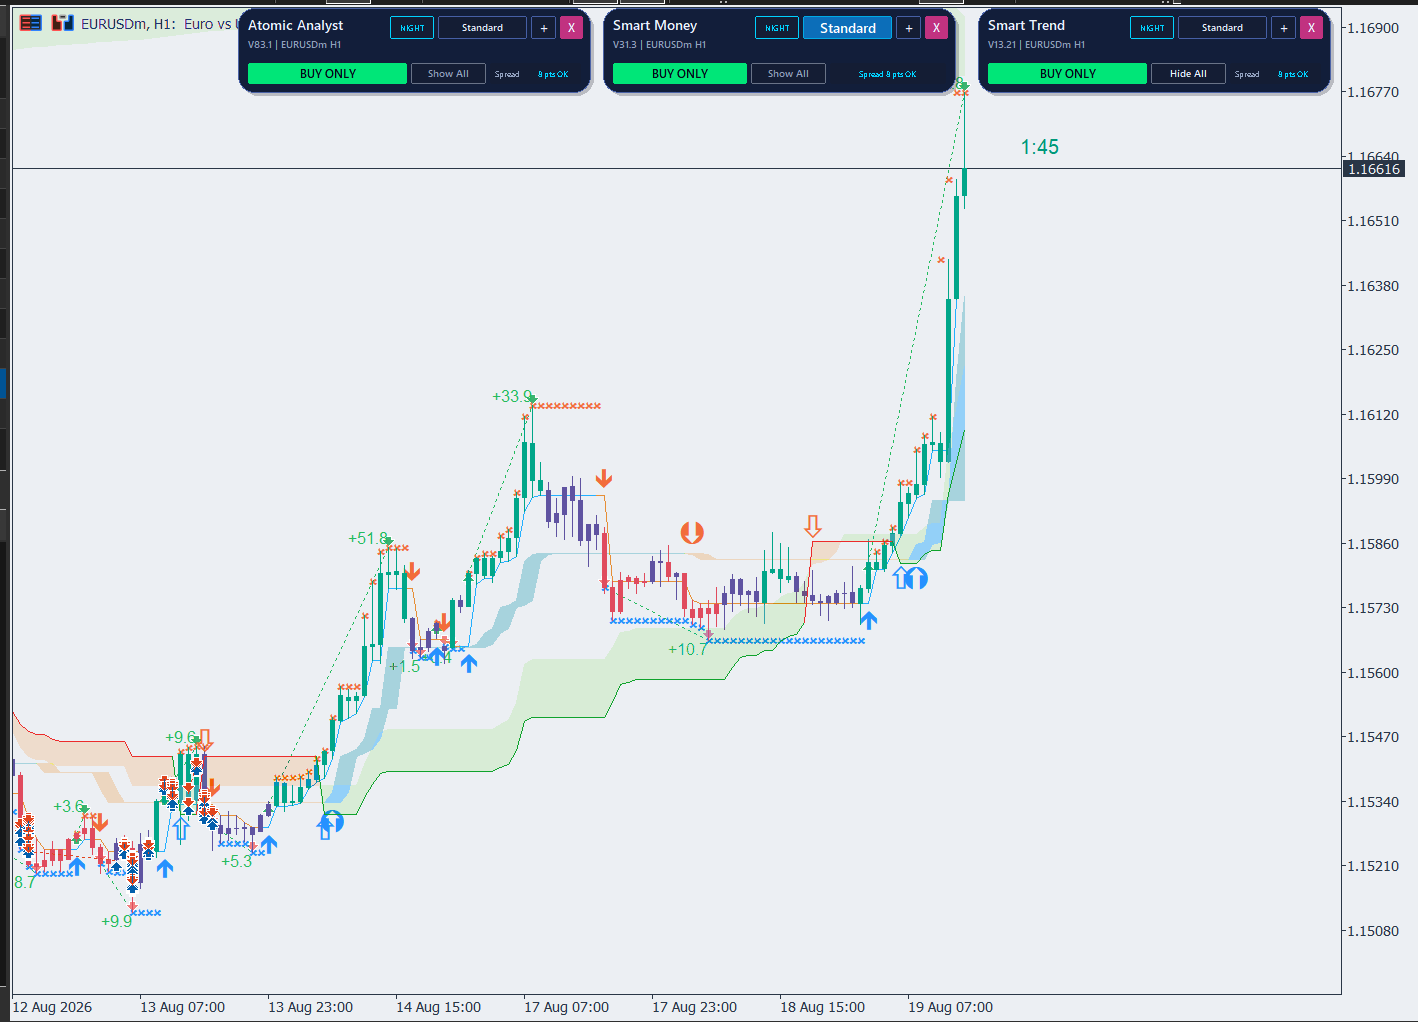
Agreement between panels still needs price context. This historical 12-19 August 2026 EURUSDm H1 chart shows Atomic Analyst, Smart Money and Smart Trend compact panels all reading BUY ONLY. Price has moved sharply higher after an earlier consolidation, with arrows and cloud bands visible on the chart. A shared direction label does not establish independent confirmation or justify chasing an extended move. Review signal timing, nearby structure and a defined invalidation level before considering entry. Displayed pip annotations are interface statistics, not verified live returns or guarantees. Test on demo first.
https://www.mql5.com/en/market/product/103515
Issam Kassas
Separate chart analysis from automation settings. This historical 26-31 July 2026 EURUSDm H1 example shows Smart Trend with Bullish Trend and BUY ONLY, STRONG trend and pair strength, GOOD momentum and LOW volume. Beside it, Smart Universal Expert displays EA ON, Trend Indicator as the signal source and Martin Recovery selected. Those are visible interface settings, not proof that orders were executed or losses recovered. Review signal timing, position sizing and recovery exposure before enabling automation. Displayed quality, accuracy and pip figures are not verified live returns or guarantees. Test on demo first.
https://www.mql5.com/en/market/product/103515
Issam Kassas
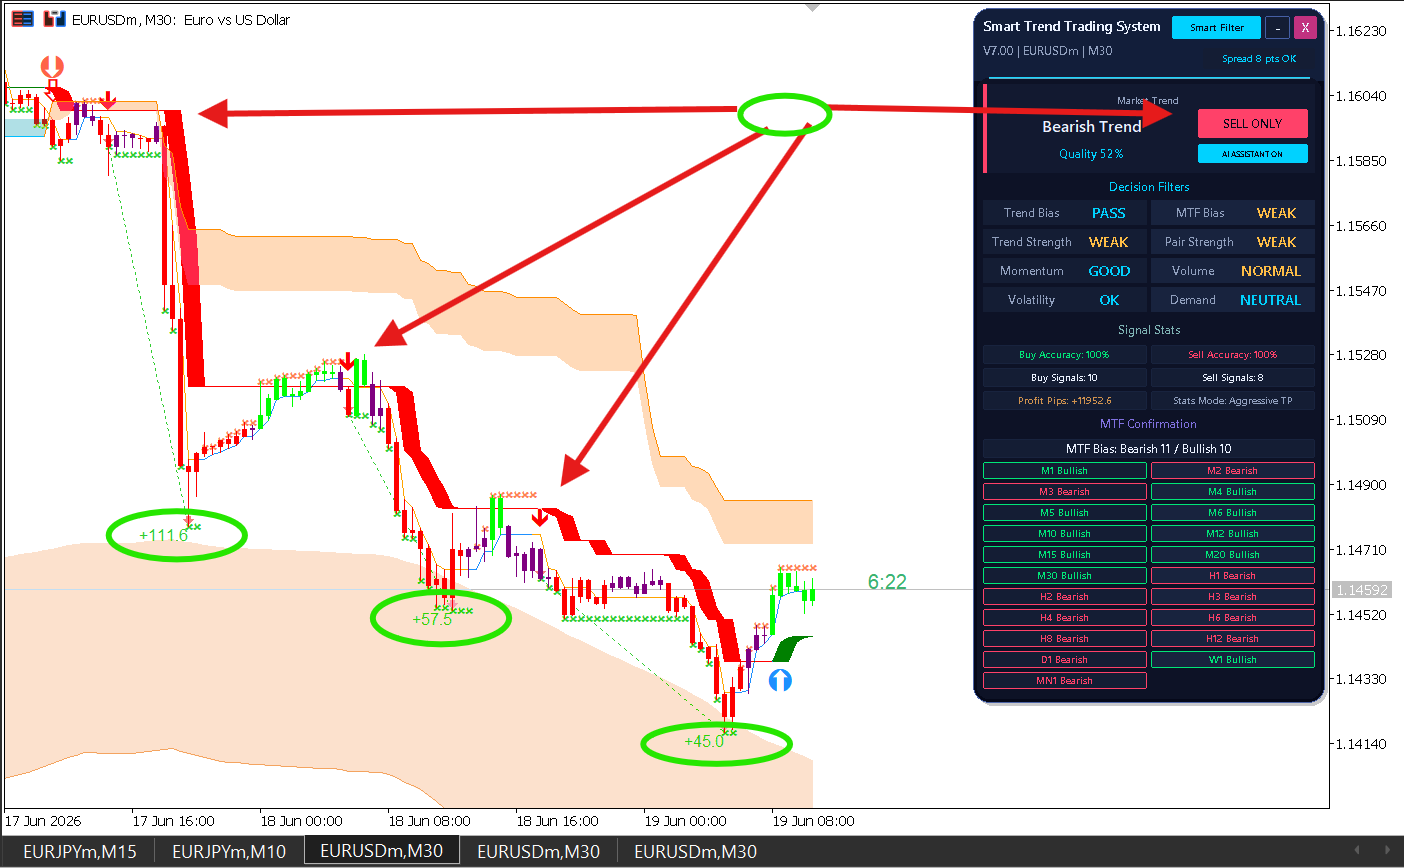
Read the strength filters alongside the headline direction. This historical 17-19 June 2026 EURUSDm M30 Smart Trend example shows Bearish Trend and SELL ONLY across a declining chart. Trend strength, pair strength and MTF bias read WEAK, while momentum reads GOOD and volume NORMAL. The MTF summary is nearly balanced: Bearish 11 / Bullish 10. Compare those mixed readings with price structure before defining entry and invalidation. Displayed quality, accuracy and pip figures are interface statistics, not verified live returns or guarantees. Test settings on demo first.
https://www.mql5.com/en/market/product/103515
Issam Kassas
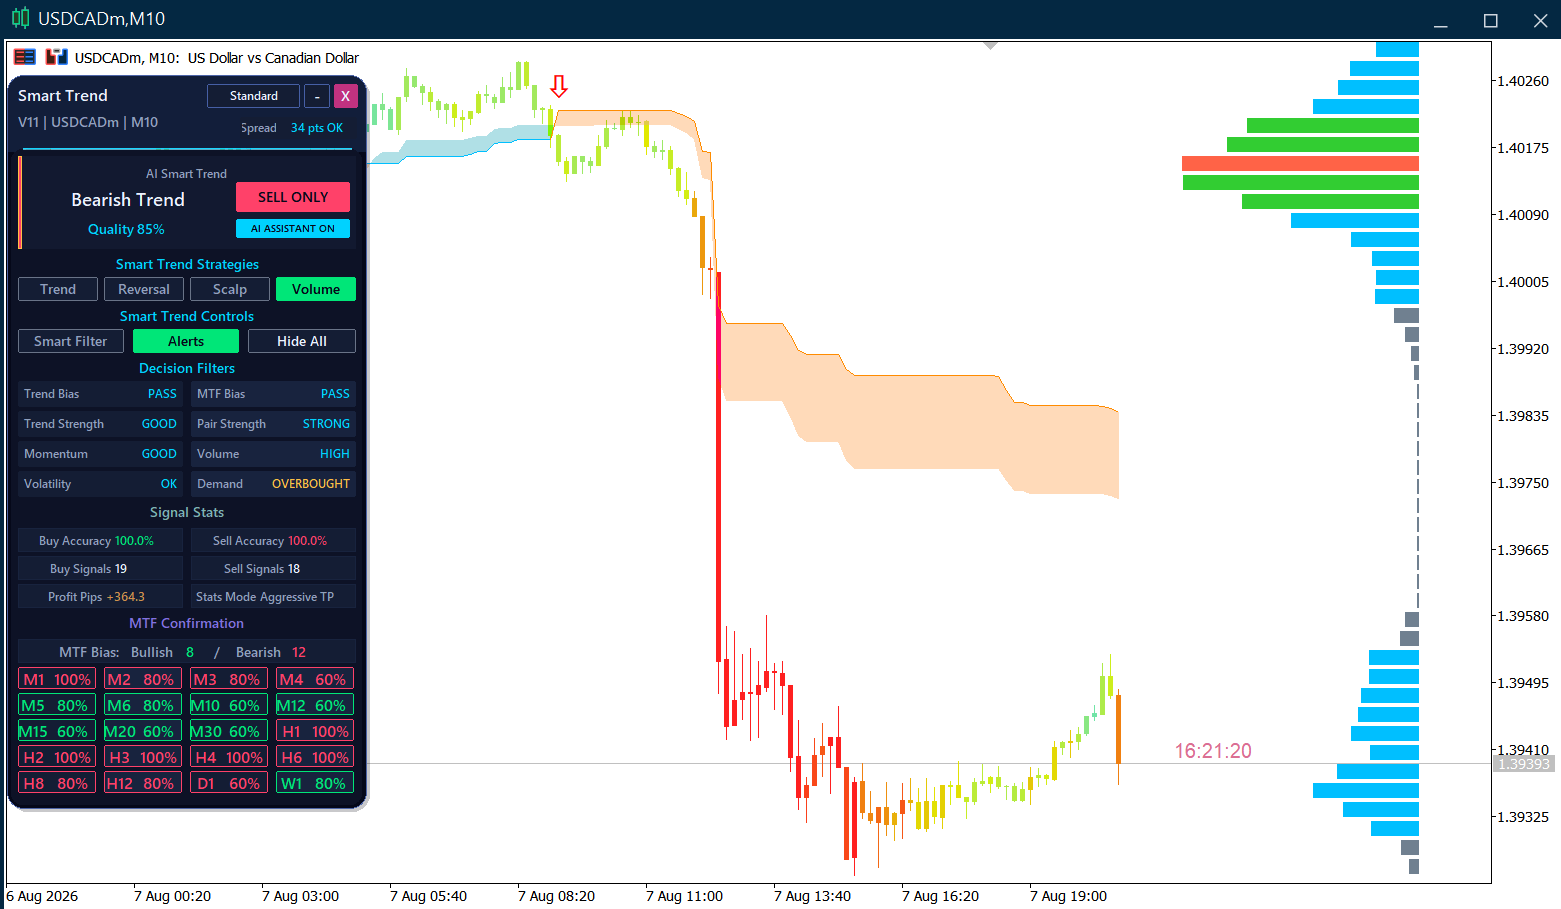
A rebound can occur within a larger decline. This historical 6-7 August 2026 USDCADm M10 Smart Trend example shows Bearish Trend and SELL ONLY after a sharp fall, with the Volume strategy selected. Momentum reads GOOD, volume HIGH and pair strength STRONG, while demand reads OVERBOUGHT. The MTF summary shows Bullish 8 / Bearish 12. Compare those mixed readings with price structure before defining entry and invalidation. Displayed quality, accuracy and pip figures are interface statistics, not verified live returns or guarantees. Test settings on demo first.
https://www.mql5.com/en/market/product/103515
Issam Kassas
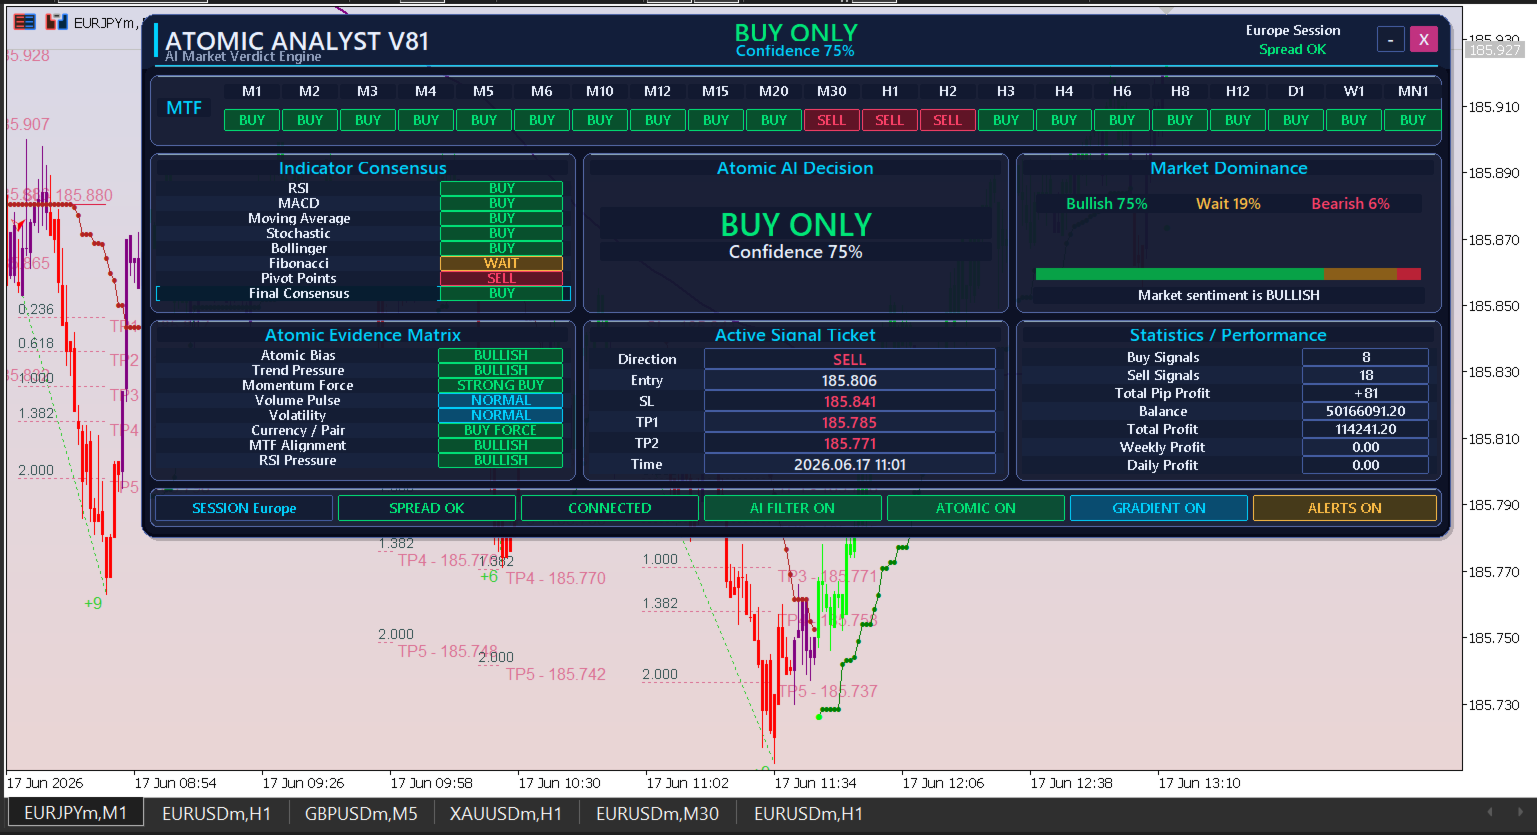
Compare the current decision with the signal ticket before acting. This historical 17 June 2026 EURJPYm M1 Atomic Analyst V81 example shows BUY ONLY and 75% confidence, while the Active Signal Ticket still displays SELL at 11:01. The M30, H1 and H2 rows also read SELL within a mostly BUY timeframe grid. Treat those differences as a reason to check signal timing and price structure before defining entry and invalidation. Displayed confidence and profit figures are interface statistics, not verified live returns or guarantees. Test settings on demo first.
https://www.mql5.com/en/market/product/114662
Issam Kassas
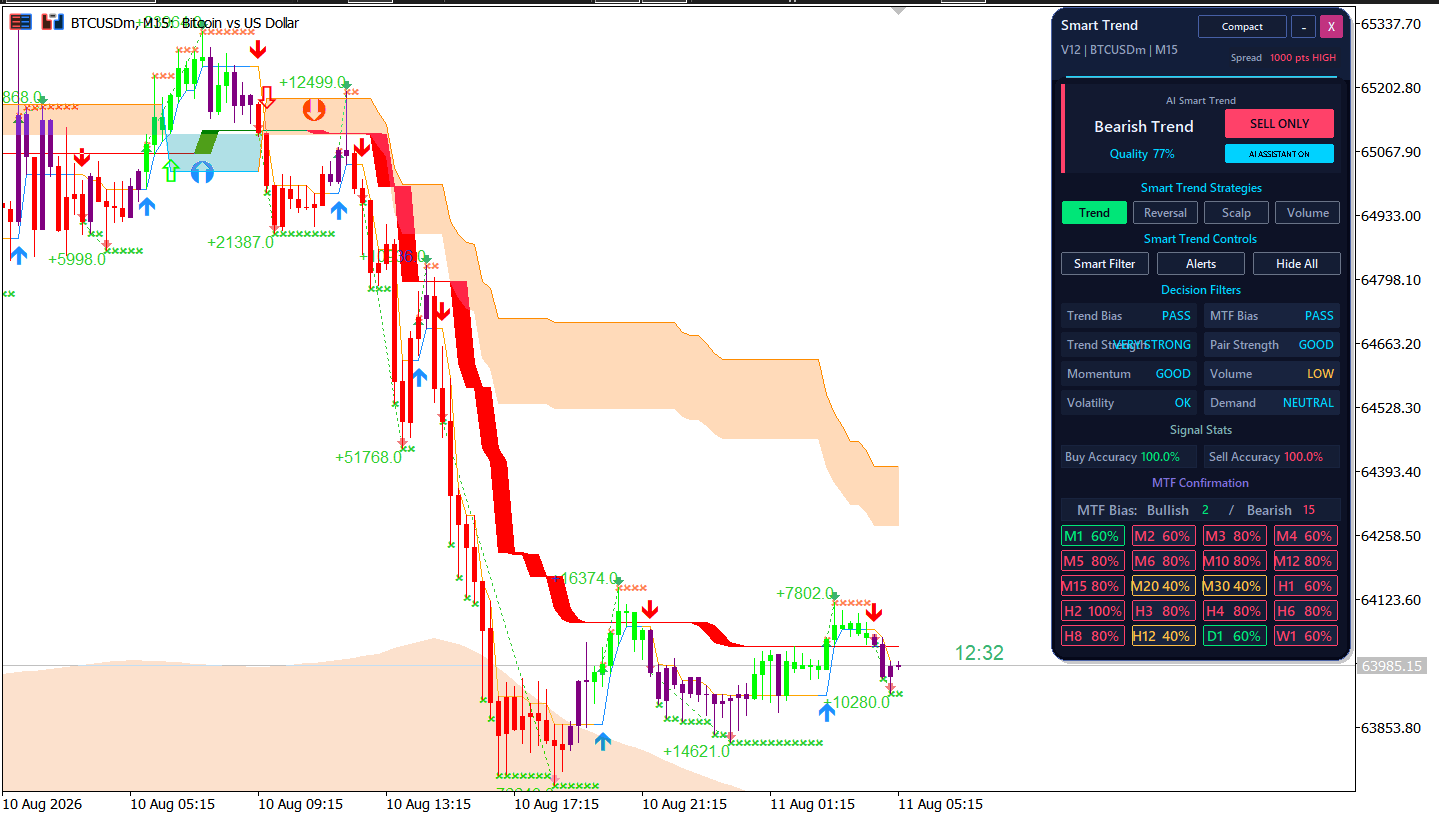
Read execution conditions alongside the direction label. This historical 10-11 August 2026 BTCUSDm M15 Smart Trend example shows Bearish Trend and SELL ONLY after a sharp decline. The panel also shows a HIGH spread warning and LOW volume, while momentum reads GOOD and the MTF summary reads Bullish 2 / Bearish 15. Compare those readings with price structure and trading costs before defining entry and invalidation. Displayed quality, accuracy and pip figures are interface statistics, not verified live returns or guarantees. Test settings on demo first.
https://www.mql5.com/en/market/product/103515
Issam Kassas
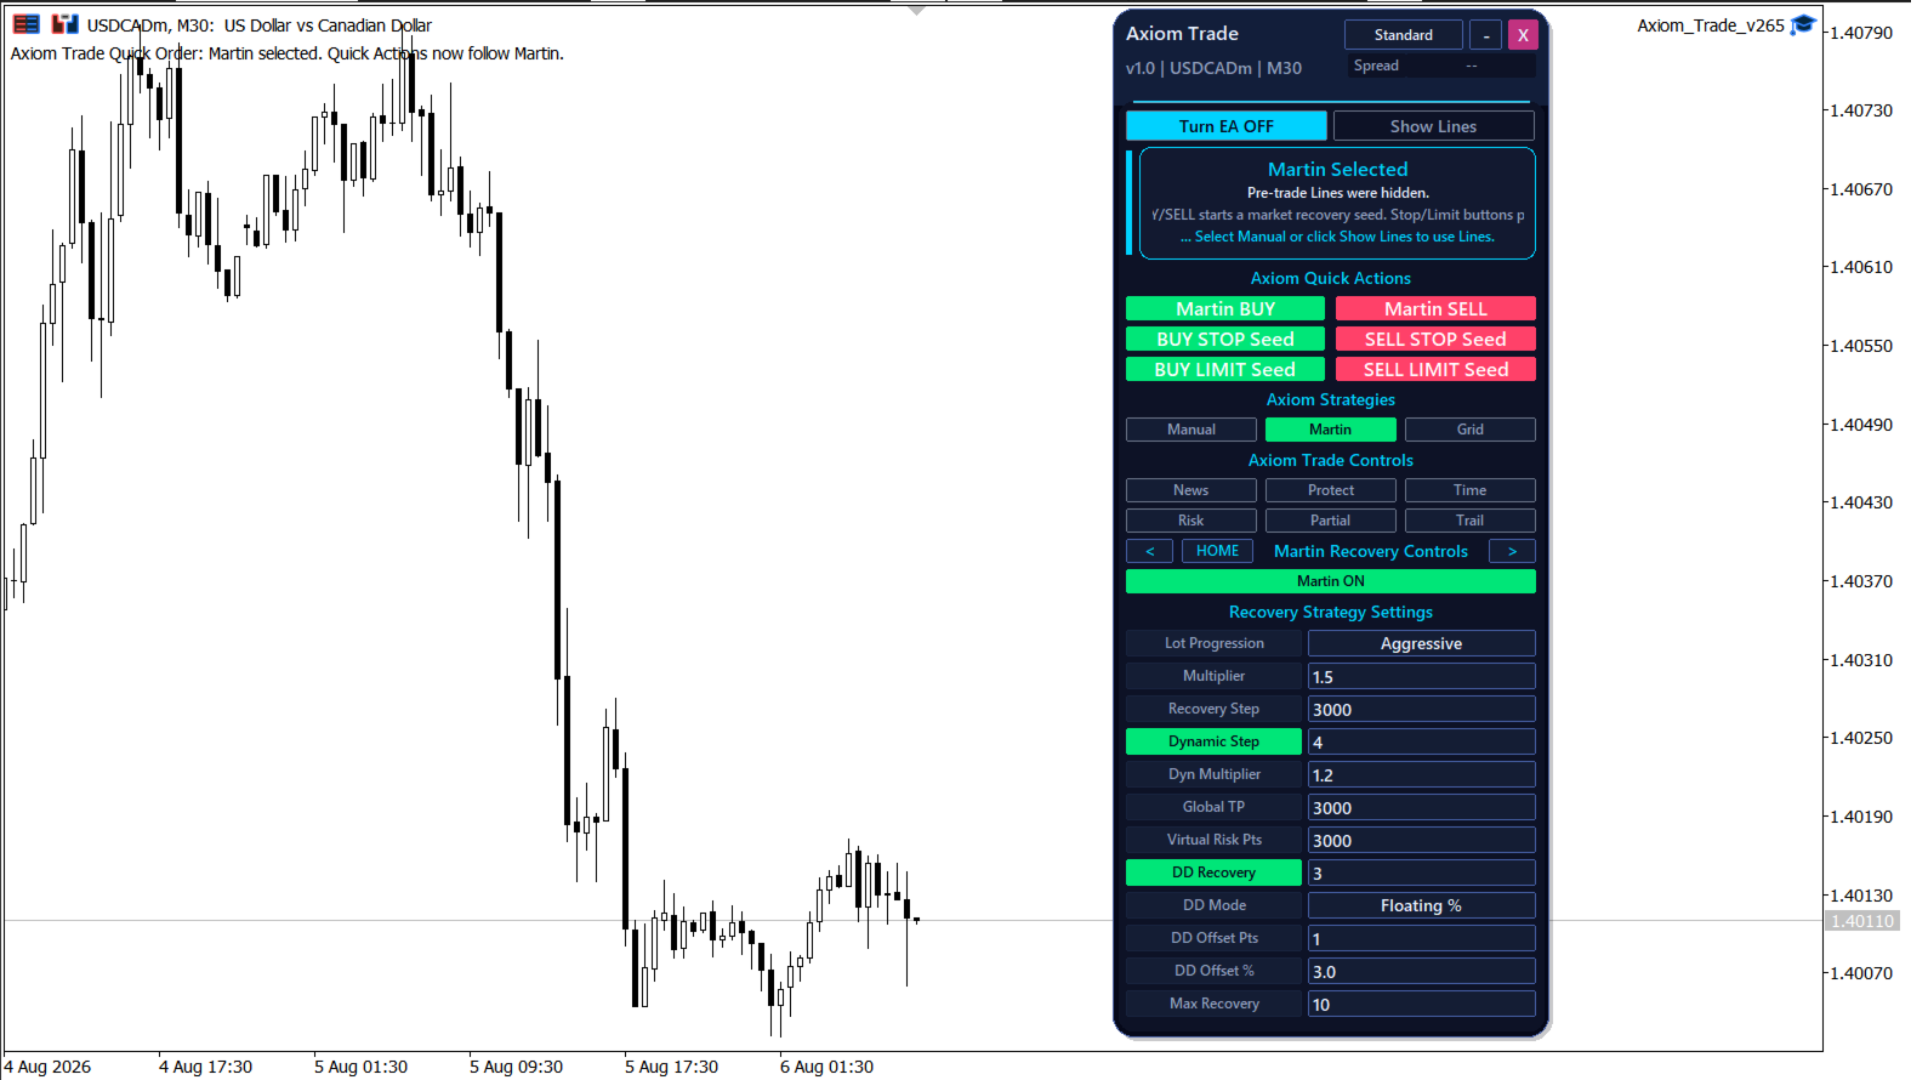
Check the selected mode before using a quick-action button. This historical 4-6 August 2026 USDCADm M30 Axiom Trade example shows Martin Selected, Martin ON and hidden pre-trade lines. The recovery settings display Aggressive lot progression, a 1.5 multiplier and Max Recovery 10. These are configuration values, not evidence that trades were placed or recovered. Recovery workflows can increase exposure and drawdown. Review sizing and limits, and test the setup on demo before live use.
https://www.mql5.com/en/market/product/184566
Issam Kassas
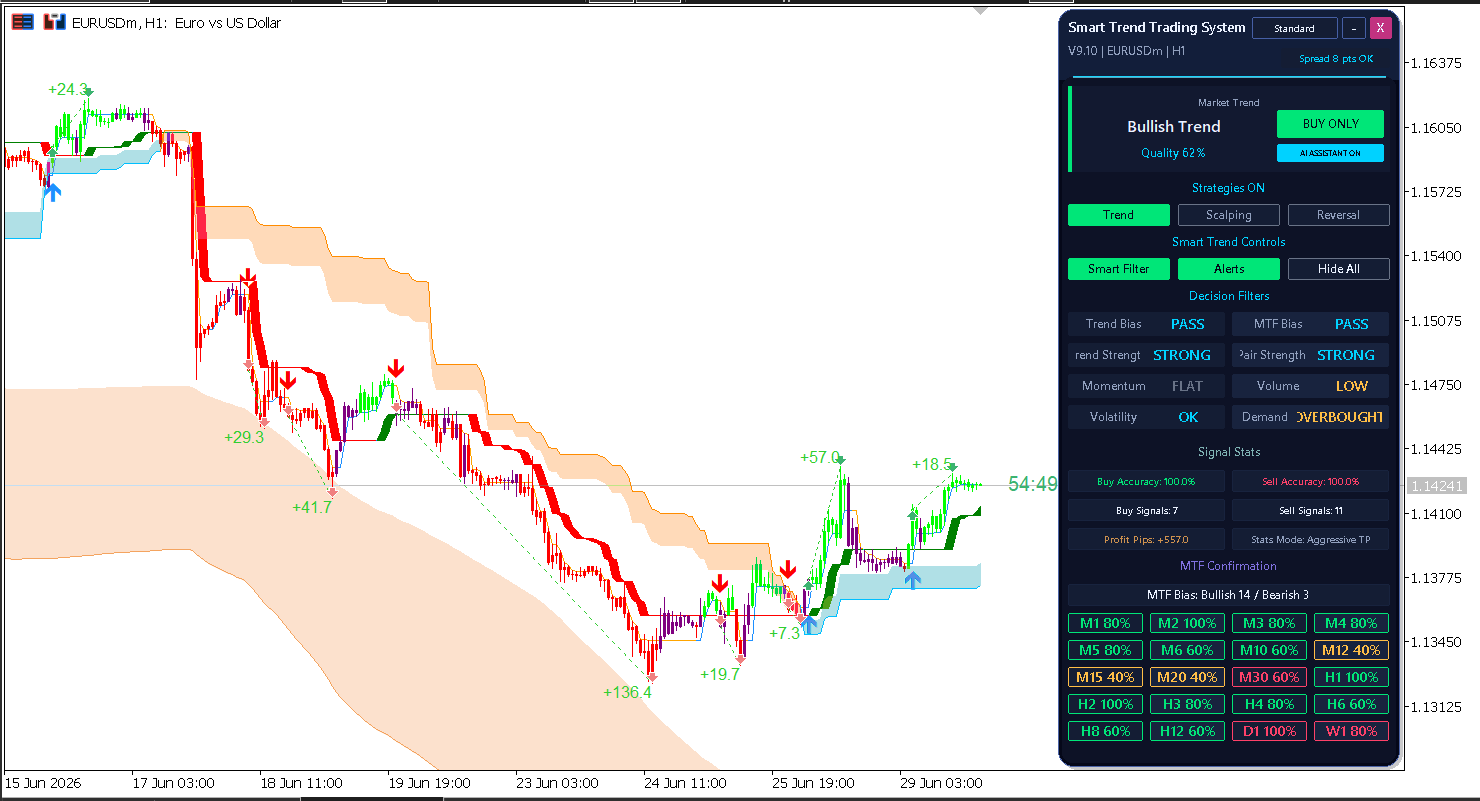
Read the recovery in its wider chart context. This historical 15-29 June 2026 EURUSDm H1 Smart Trend example shows Bullish Trend and BUY ONLY after a larger decline and rebound. Trend strength and pair strength read STRONG, but momentum is FLAT, volume LOW and demand OVERBOUGHT. The MTF summary reads Bullish 14 / Bearish 3. Compare those mixed readings with nearby price structure before defining entry and invalidation. Displayed quality, accuracy and pip figures are interface statistics, not verified live returns or guarantees. Test settings on demo first.
https://www.mql5.com/en/market/product/103515
Issam Kassas
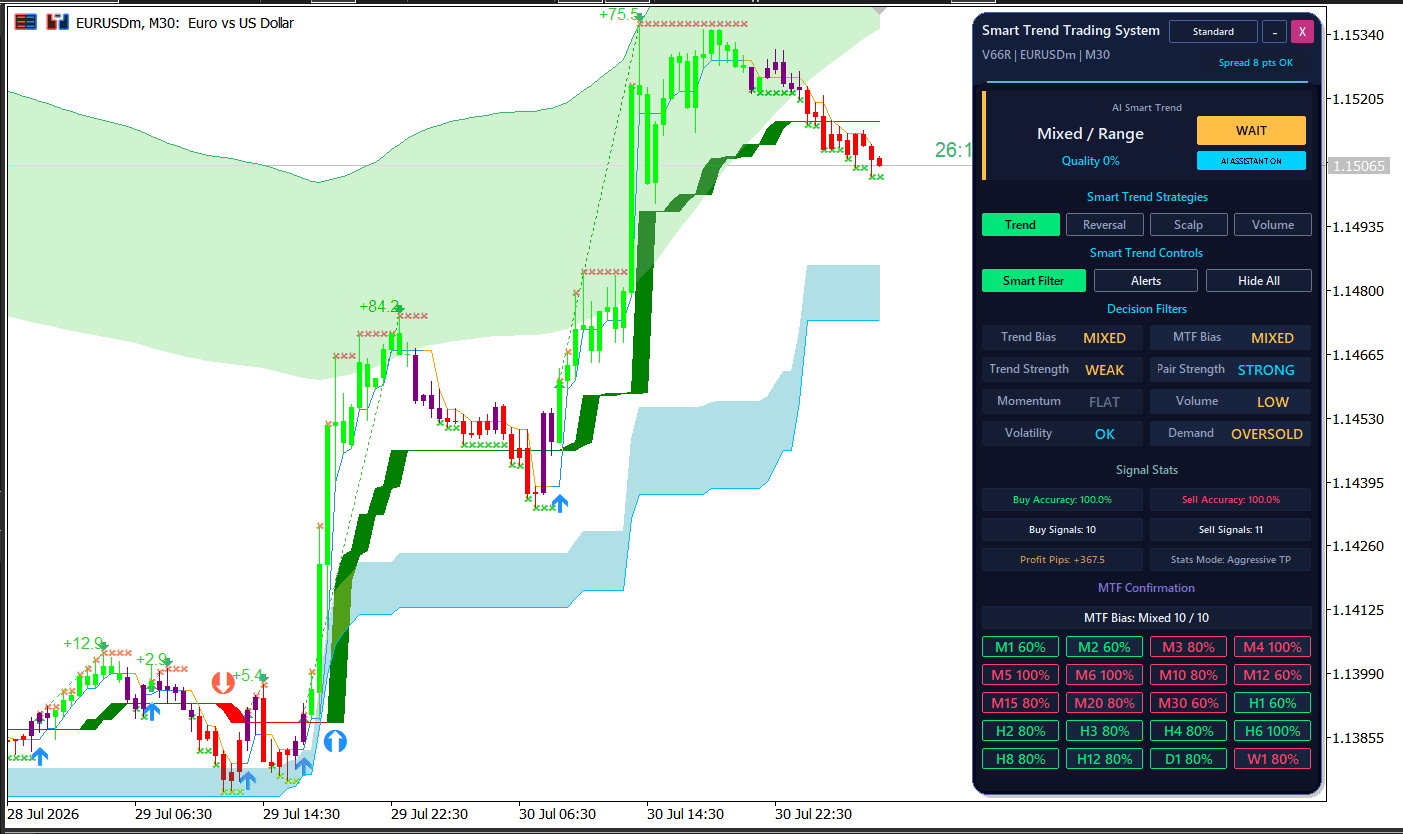
A rising chart does not require a new entry. This historical 28-30 July 2026 EURUSDm M30 Smart Trend example shows Mixed / Range and WAIT after a sharp rise and pullback. Trend bias and MTF bias are MIXED, trend strength WEAK, momentum FLAT and volume LOW; the MTF summary is Mixed 10 / 10. Compare those readings with price structure before defining entry and invalidation. Displayed quality, accuracy and pip figures are interface statistics, not verified live returns or guarantees. Test settings on demo first.
https://www.mql5.com/en/market/product/103515
Issam Kassas
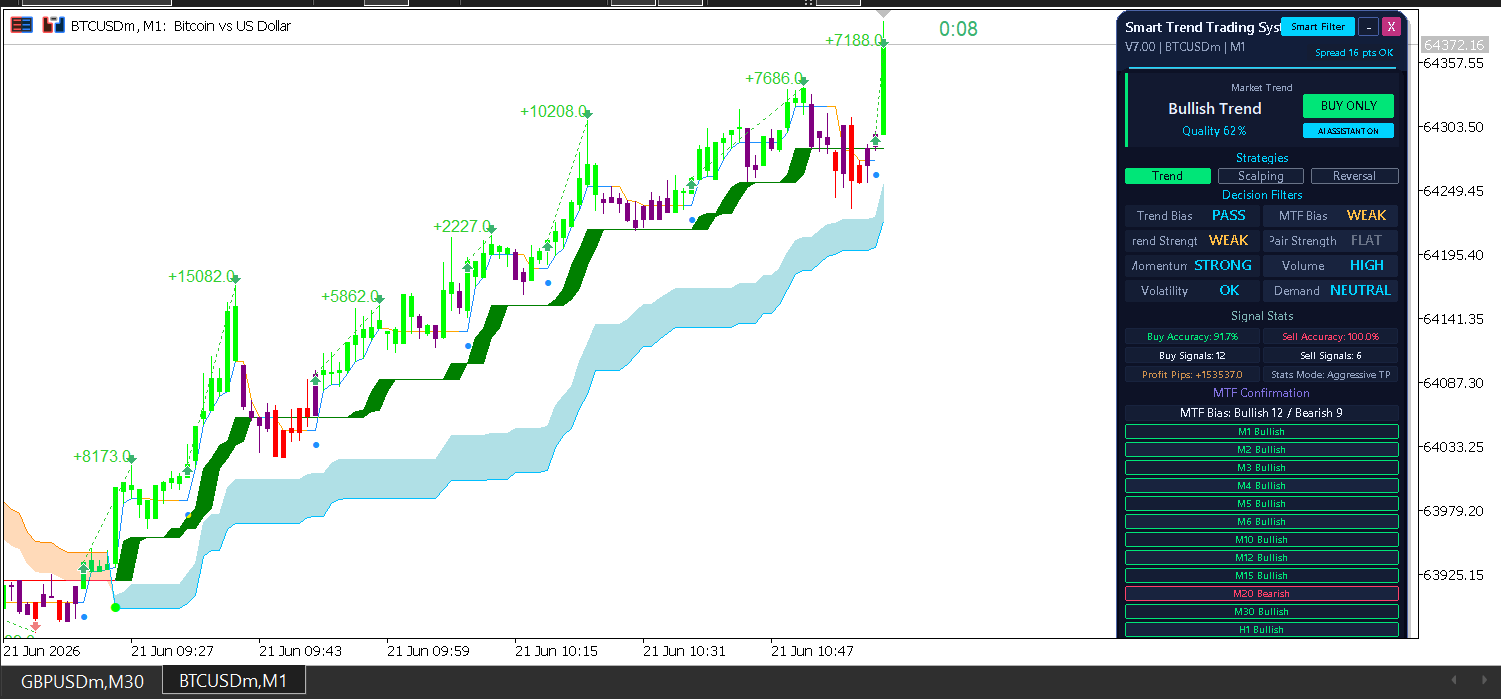
A bullish label still needs a filter check. This historical 21 June 2026 BTCUSDm M1 Smart Trend example shows Bullish Trend and BUY ONLY, while trend strength and MTF bias read WEAK and pair strength FLAT. Momentum is STRONG and volume HIGH; the MTF summary reads Bullish 12 / Bearish 9. Compare those mixed readings with price structure before defining entry and invalidation. Displayed quality, accuracy and pip figures are interface statistics, not verified live returns or guarantees. Test settings on demo first.
https://www.mql5.com/en/market/product/103515
Issam Kassas
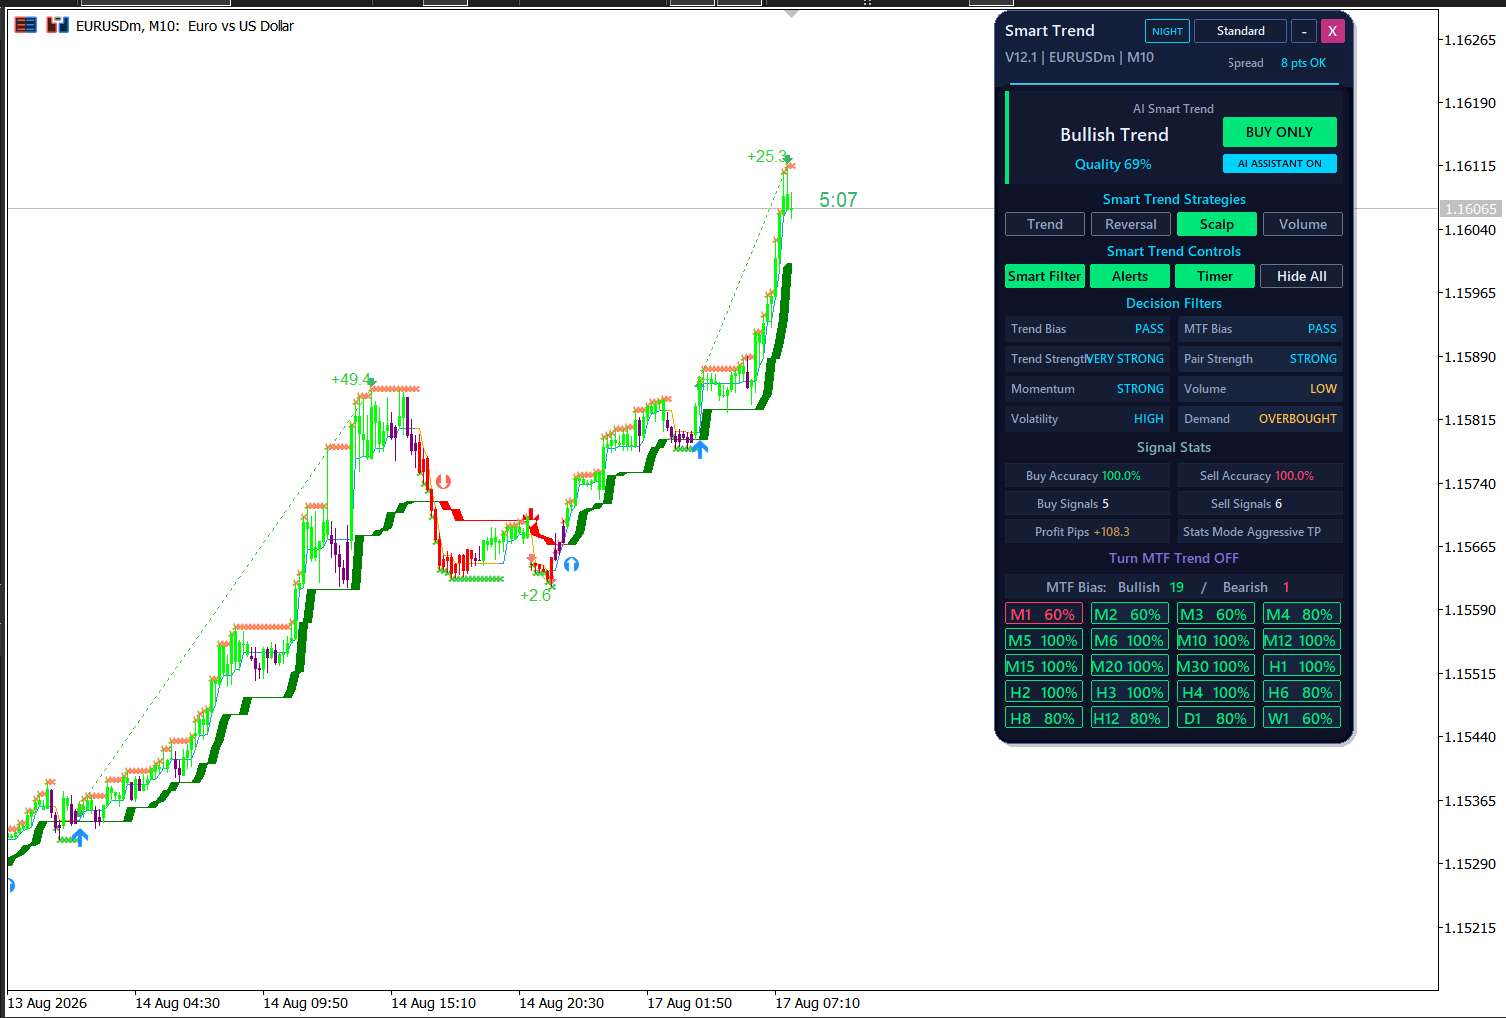
Read every filter before acting on a bullish label. This historical 13-17 August 2026 EURUSDm M10 Smart Trend example shows Bullish Trend and BUY ONLY, with VERY STRONG trend strength and STRONG momentum. Volume reads LOW, volatility HIGH and demand OVERBOUGHT. Compare those mixed conditions with price structure before defining entry and invalidation. The MTF summary reads Bullish 19 / Bearish 1. Displayed quality, accuracy and pip figures are interface statistics, not verified live returns or guarantees. Test settings on demo first.
https://www.mql5.com/en/market/product/103515
Issam Kassas
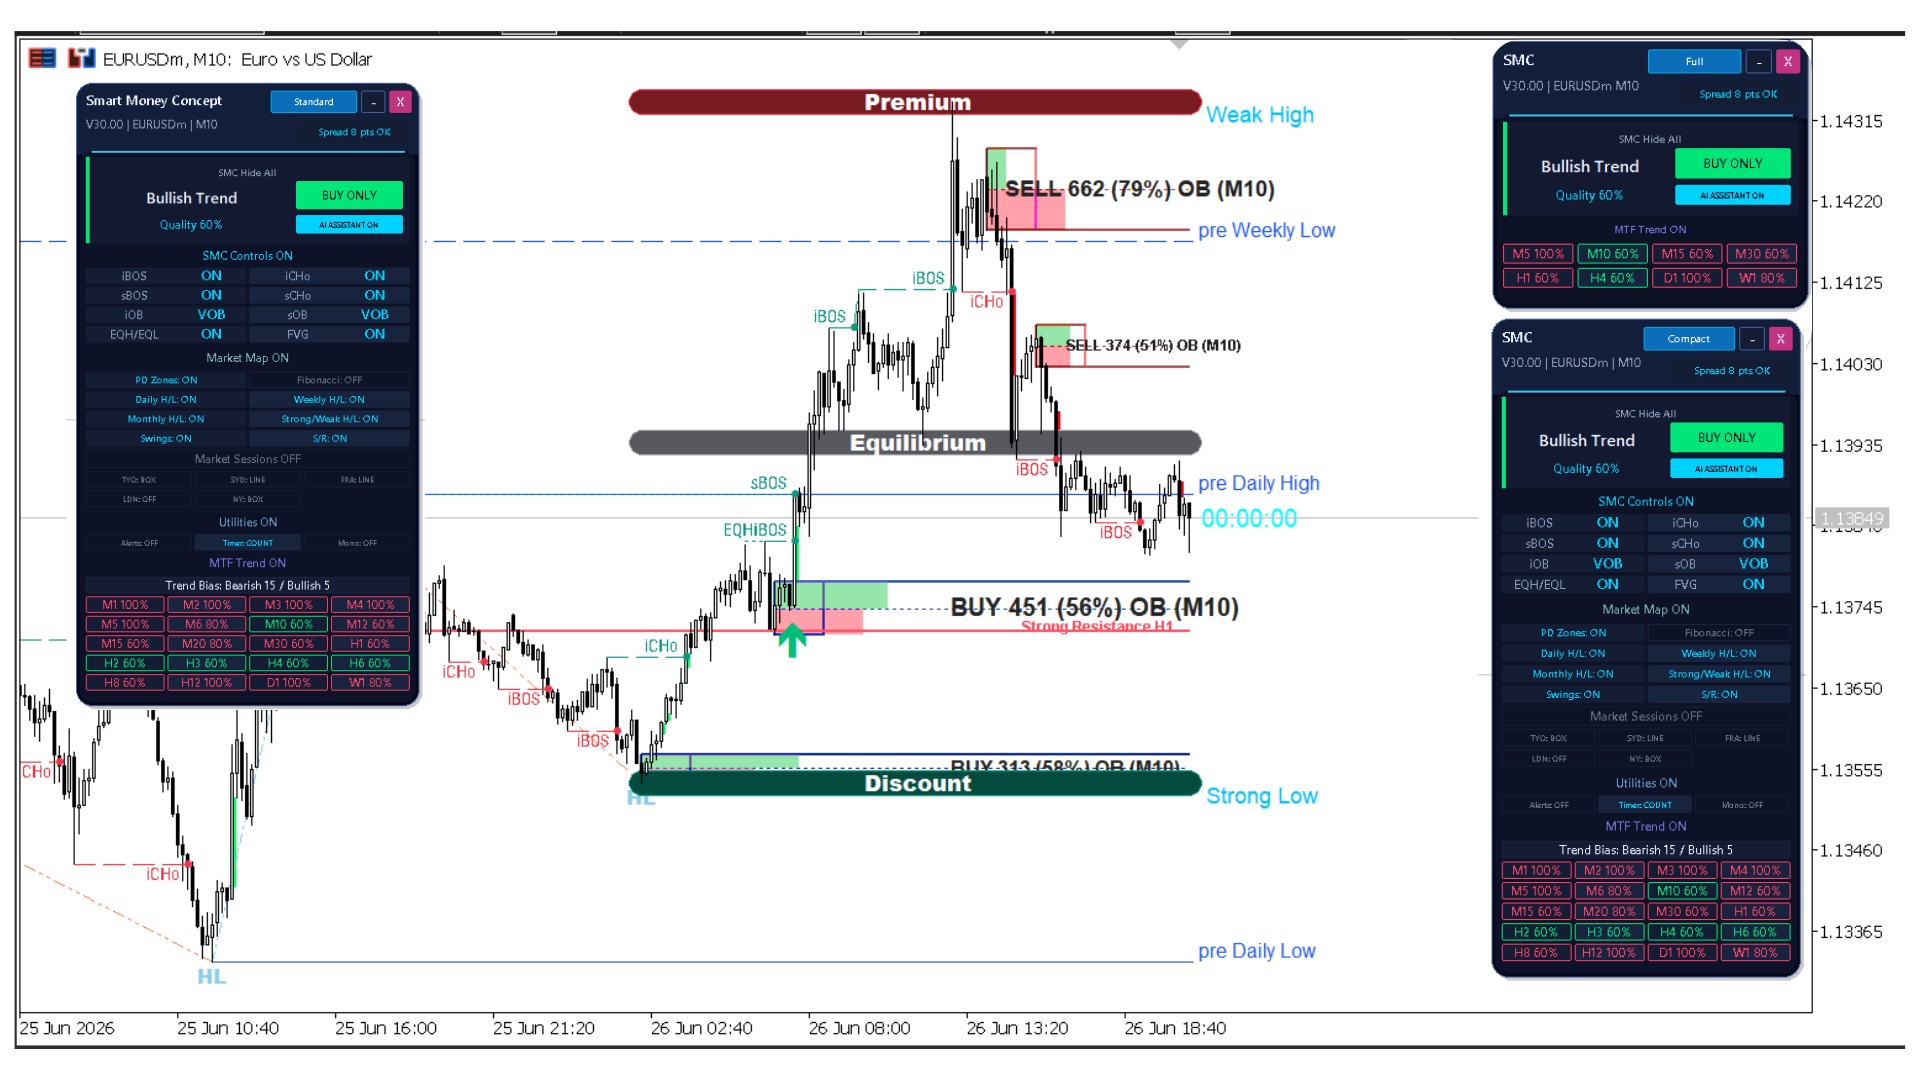
Compare the headline with the timeframe evidence. This historical 25-26 June 2026 EURUSDm M10 Smart Price Action Concepts example shows Bullish Trend and BUY ONLY, while the MTF summary reads Bearish 15 / Bullish 5. Price has pulled back below the marked equilibrium zone, with order blocks and previous daily and weekly references nearby. Check price location and structure before defining entry and invalidation. Displayed quality and timeframe percentages are interface scores, not guaranteed outcomes. Test settings on demo first.
https://www.mql5.com/en/market/product/103105
Issam Kassas
Check trading costs alongside the direction label. This historical 4 July 2026 BTCUSDm M1 Smart Trend example shows BUY ONLY with a HIGH spread warning, during a sharp upward move and pullback. Compare the spread, price structure and distance to an invalidation level before defining entry and position size. A bullish label does not remove execution costs or the risk of loss. Displayed pip annotations are interface statistics, not verified live returns or guarantees. Test settings on demo first.
https://www.mql5.com/en/market/product/103515
Issam Kassas
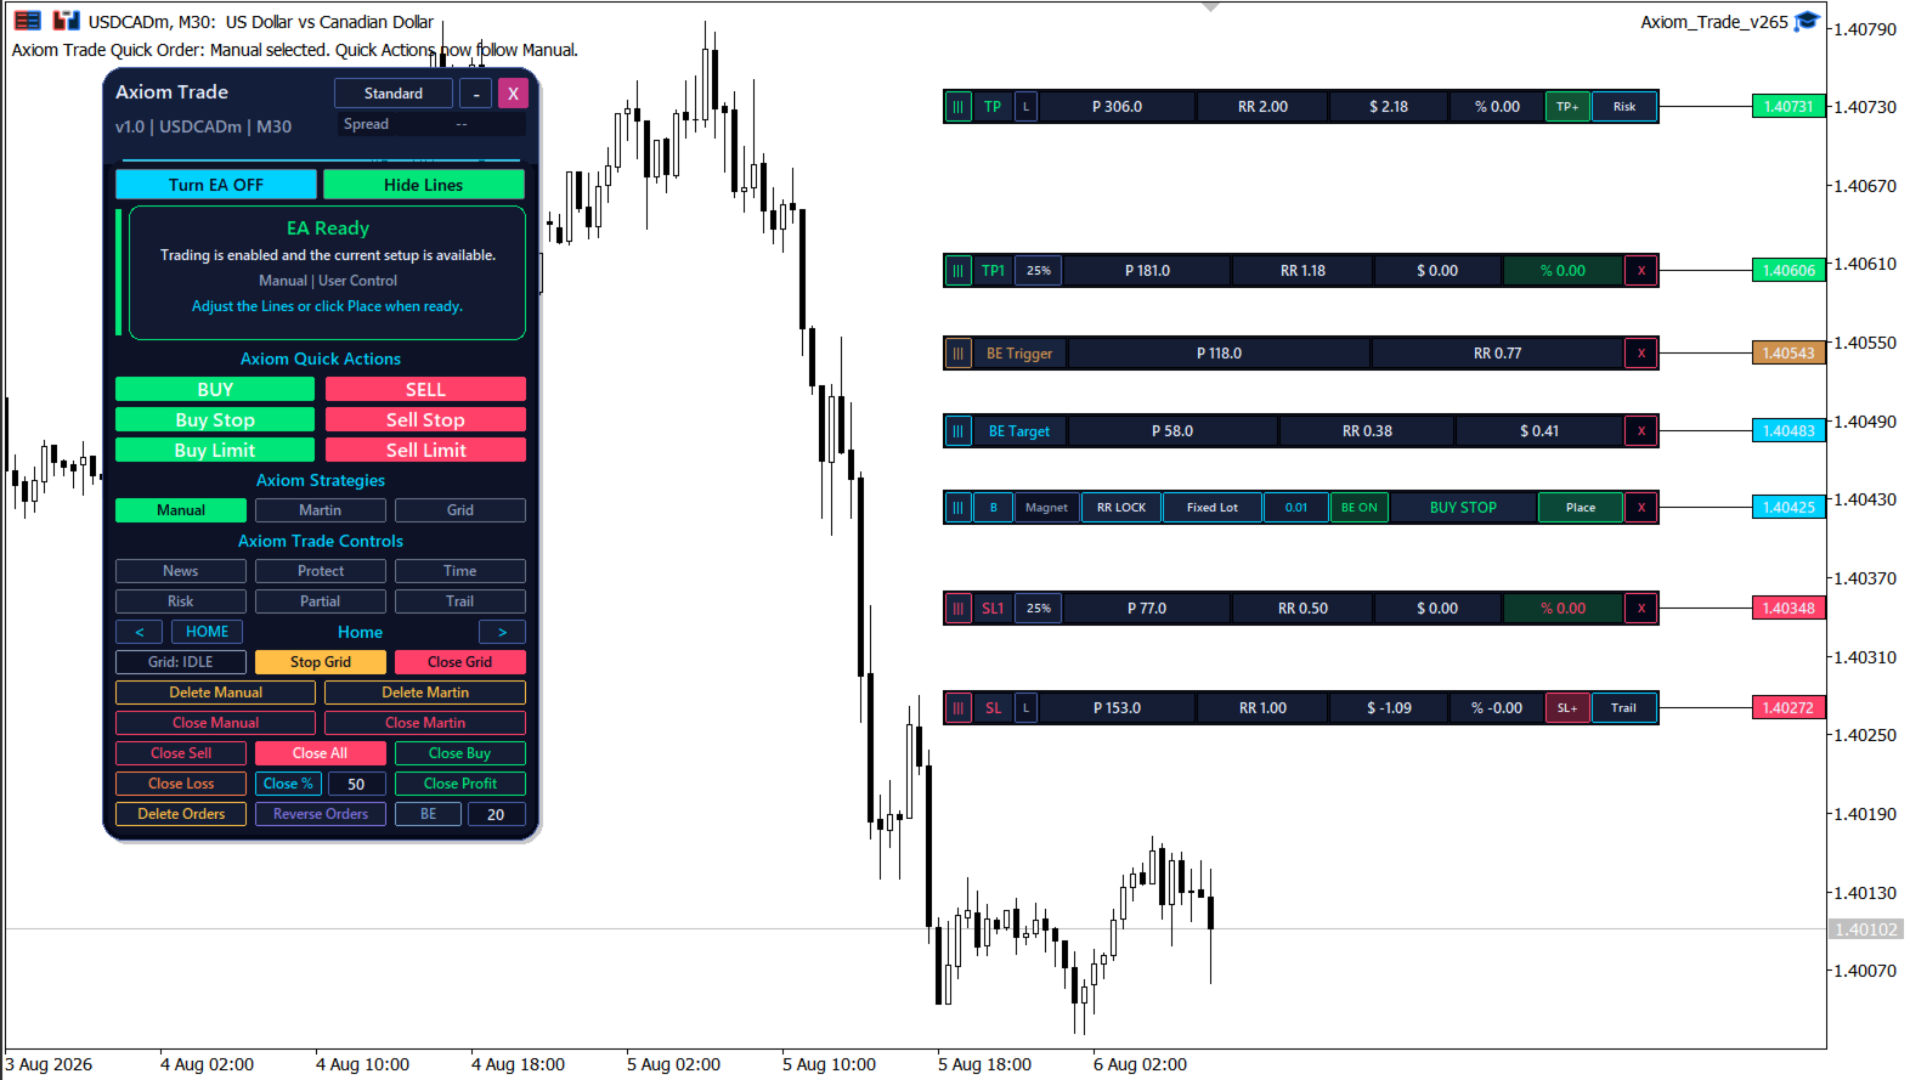
Prepare the order before pressing Place. This historical August 2026 USDCADm M30 Axiom Trade example shows Manual selected and a BUY STOP setup, with Entry, Stop Loss, Take Profit, partial exits and break-even levels. Review position size, distances and the risk-reward relationship together before execution. EA Ready describes the interface state; it does not prove that an order was placed. Displayed money and percentage figures are setup calculations, not verified live results. Test settings on demo first.
https://www.mql5.com/en/market/product/184566
Issam Kassas
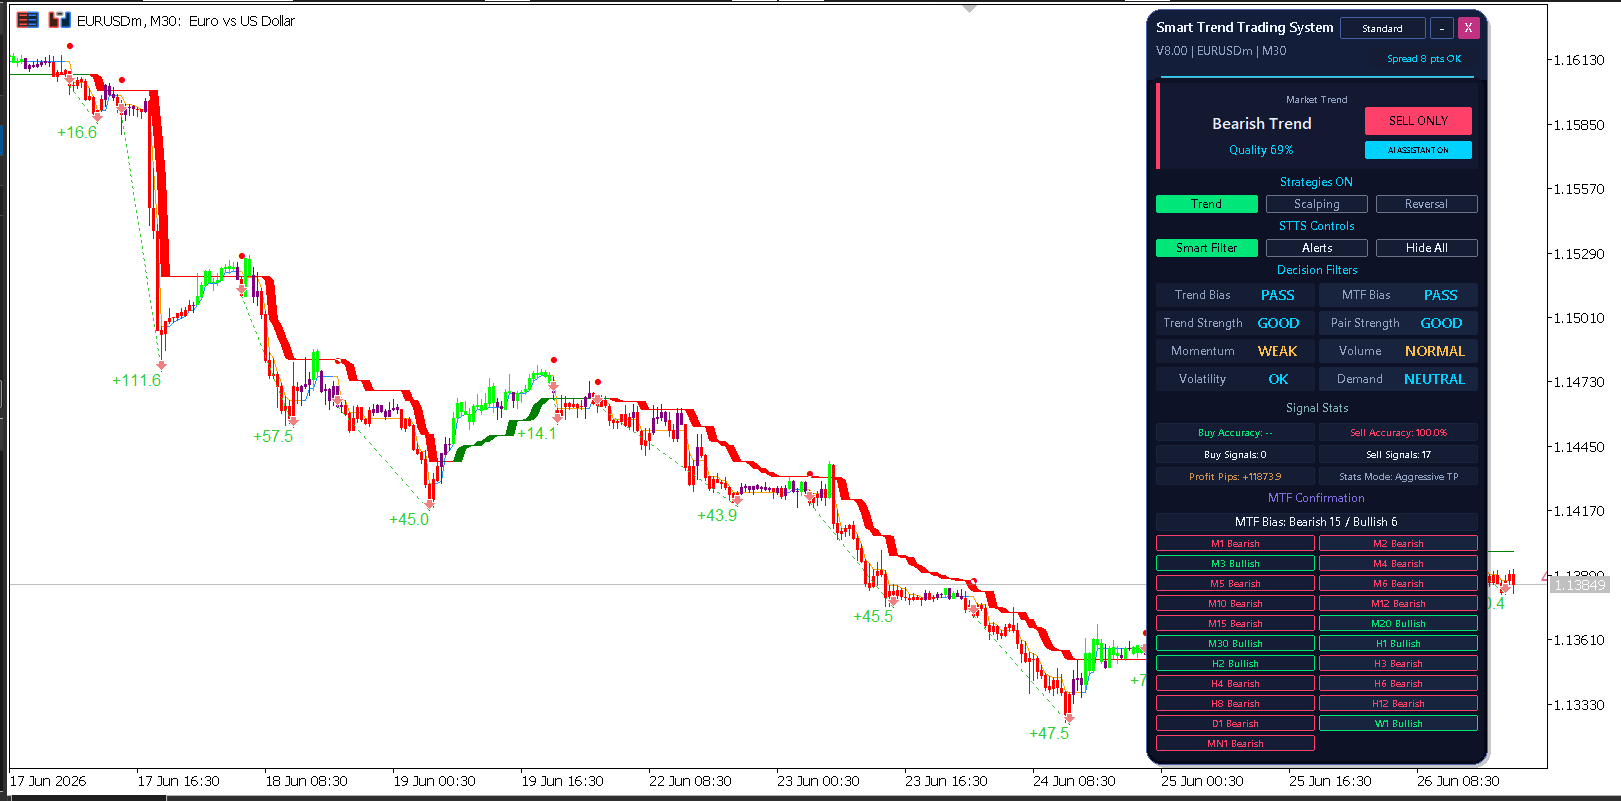
Read the filters behind a trend label. This historical June 2026 EURUSDm M30 Smart Trend example shows Bearish Trend and SELL ONLY, with GOOD trend strength, WEAK momentum and NORMAL volume. The MTF summary reads Bearish 15 / Bullish 6, so the timeframes are not unanimous. Compare these readings with price structure before defining entry and risk. Displayed quality, accuracy and pip figures are interface statistics, not verified live returns or guarantees. Test settings on demo first.
https://www.mql5.com/en/market/product/103515
Issam Kassas
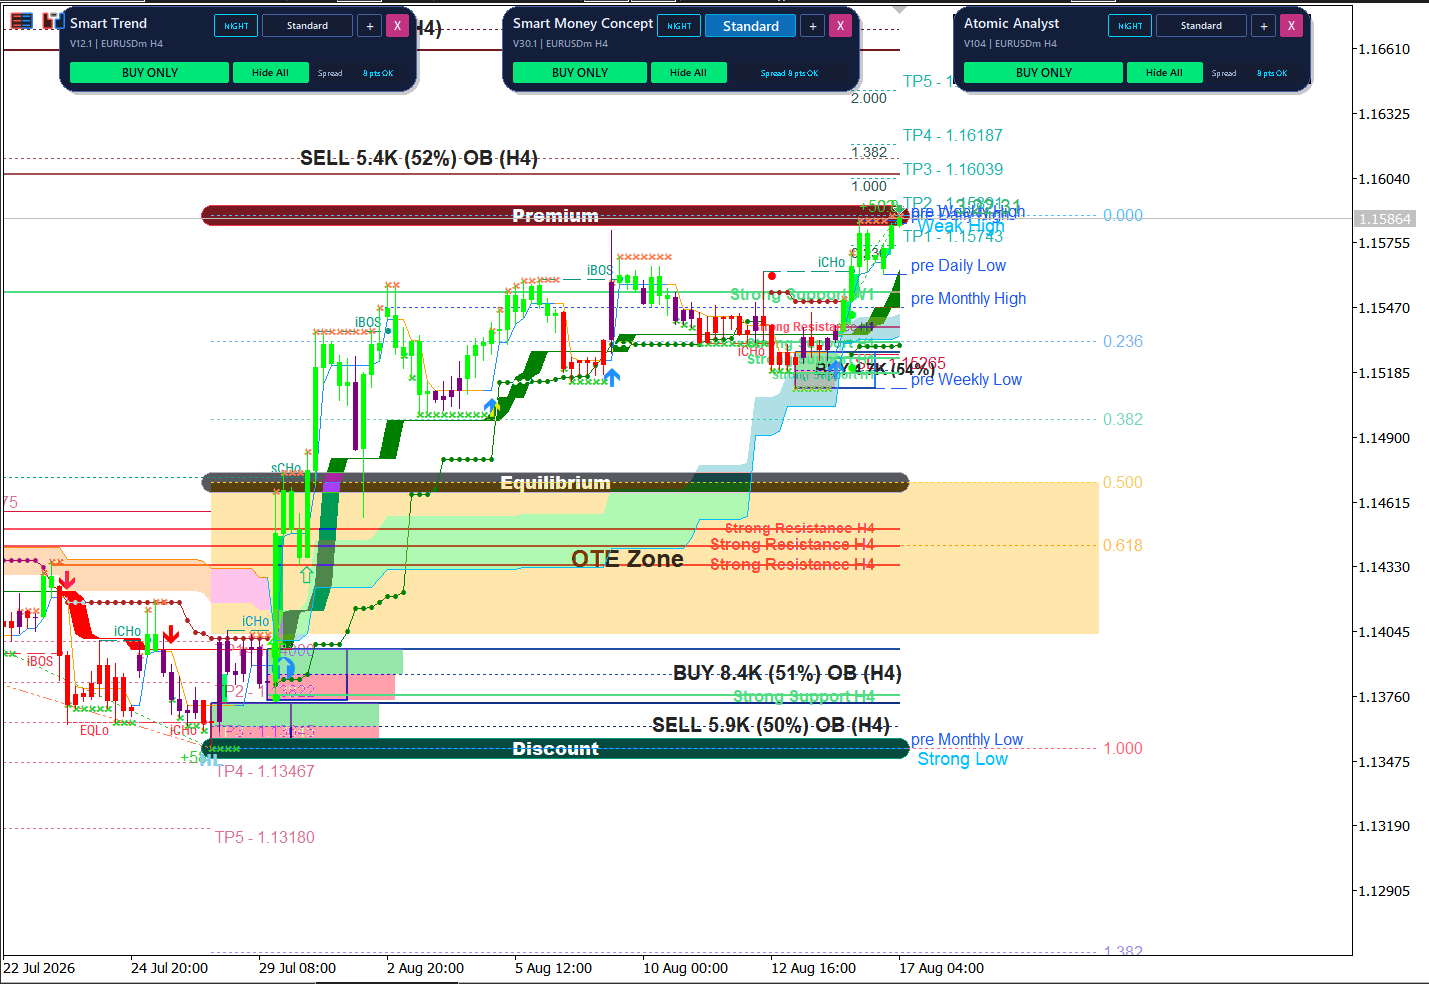
Read price location alongside the direction label. This historical July-August 2026 EURUSDm H4 chart shows Smart Trend, Smart Money Concept and Atomic Analyst panels displaying BUY ONLY, while price is near the marked premium zone and weak high. Compare nearby order blocks, Fibonacci references and previous-period levels before defining entry and invalidation. Agreement between panels does not guarantee the next price move. Displayed pip and percentage figures are interface statistics, not verified live returns. Test settings on demo first.
https://www.mql5.com/en/market/product/103105
Issam Kassas
Read the decision alongside its supporting evidence. This historical XAUUSDm H4 Atomic Analyst example shows WAIT with 56% confidence, while Final Consensus is SELL and MTF Alignment is BULLISH. Market Dominance reads Bullish 6%, Wait 50% and Bearish 44%. Compare those differences with price structure before defining entry and risk. The active signal ticket is dated 3 June 2026; it is not a current trade instruction. Displayed confidence and profit figures are interface statistics, not verified live returns or guarantees. Test settings on demo first.
https://www.mql5.com/en/market/product/114662
Issam Kassas
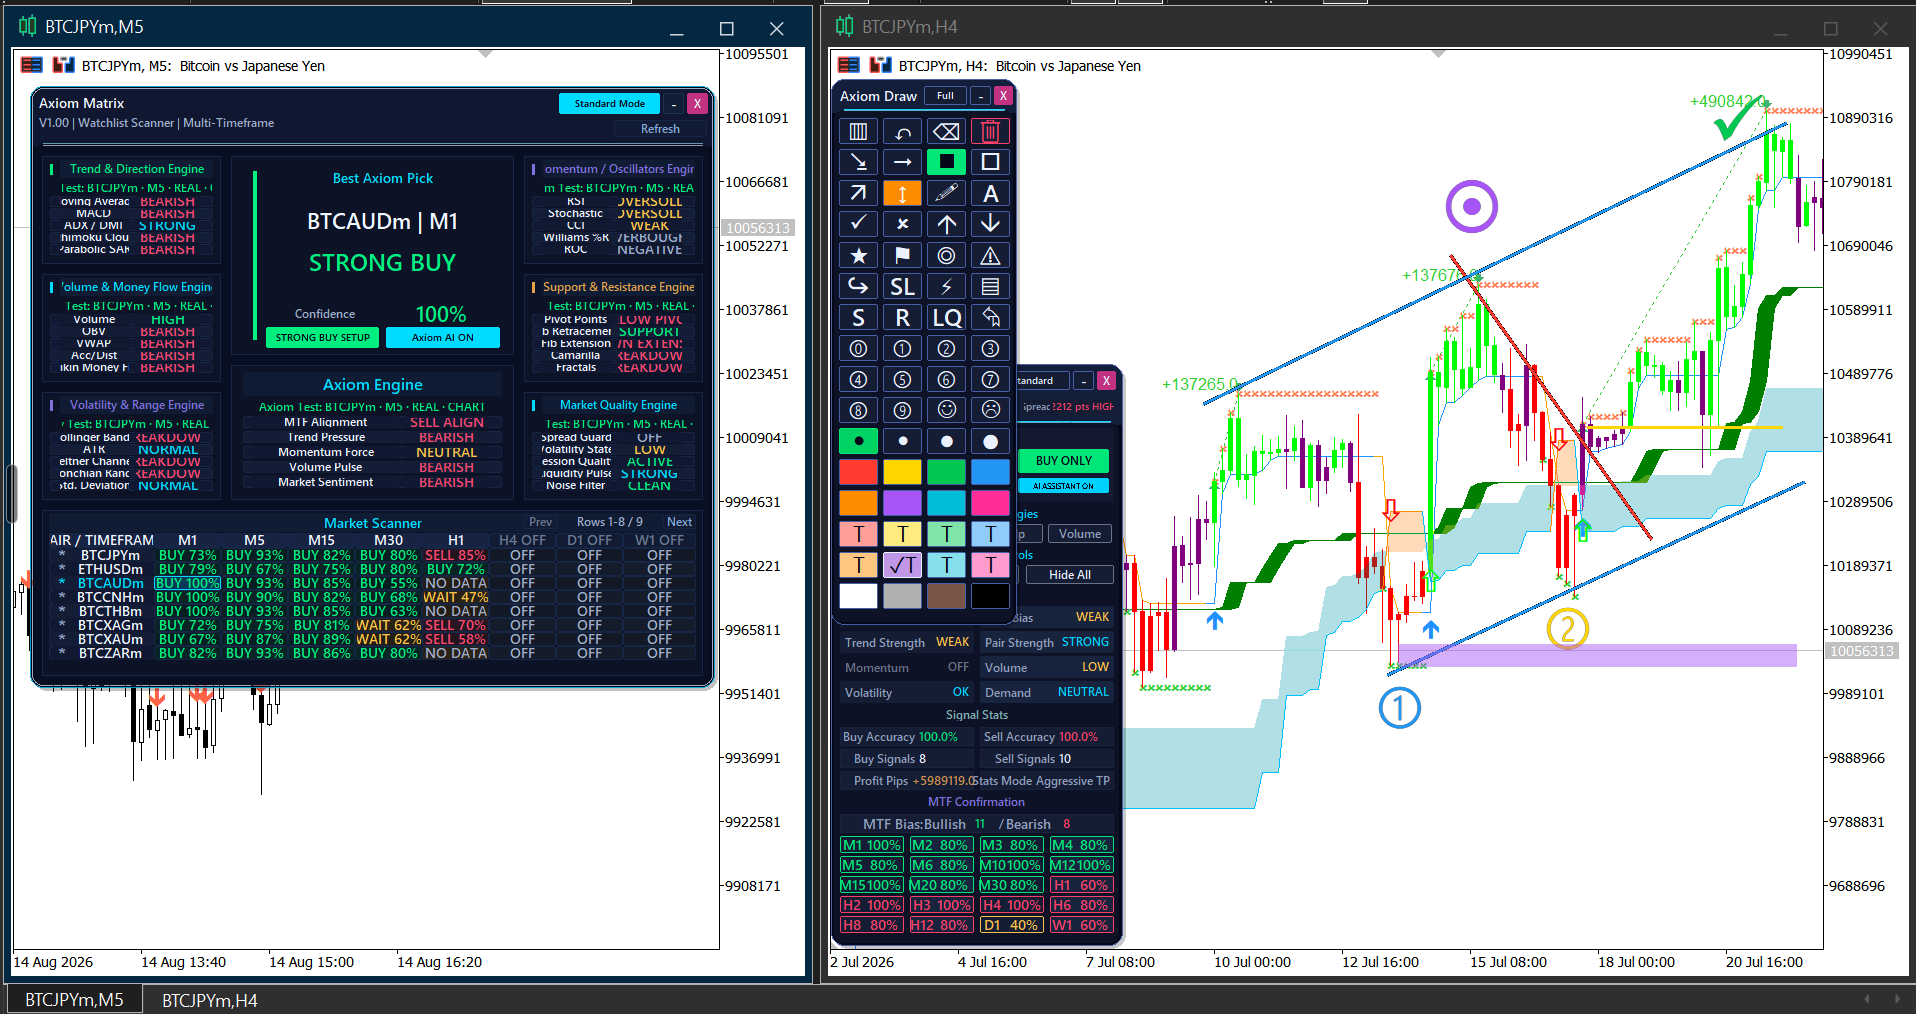
Match a scanner pick to its own market and timeframe. This historical split view shows BTCJPYm M5 in August 2026 beside BTCJPYm H4 in July, while Axiom Matrix highlights BTCAUDm M1 as its Best Axiom Pick with STRONG BUY and a displayed 100% reading. That pick is not the BTCJPYm chart signal. Open the selected instrument and compare its price structure before defining entry and risk. Displayed confidence, accuracy and pip figures are interface statistics, not verified live returns or guarantees. Test settings on demo first.
https://www.mql5.com/en/market/product/182954
Issam Kassas
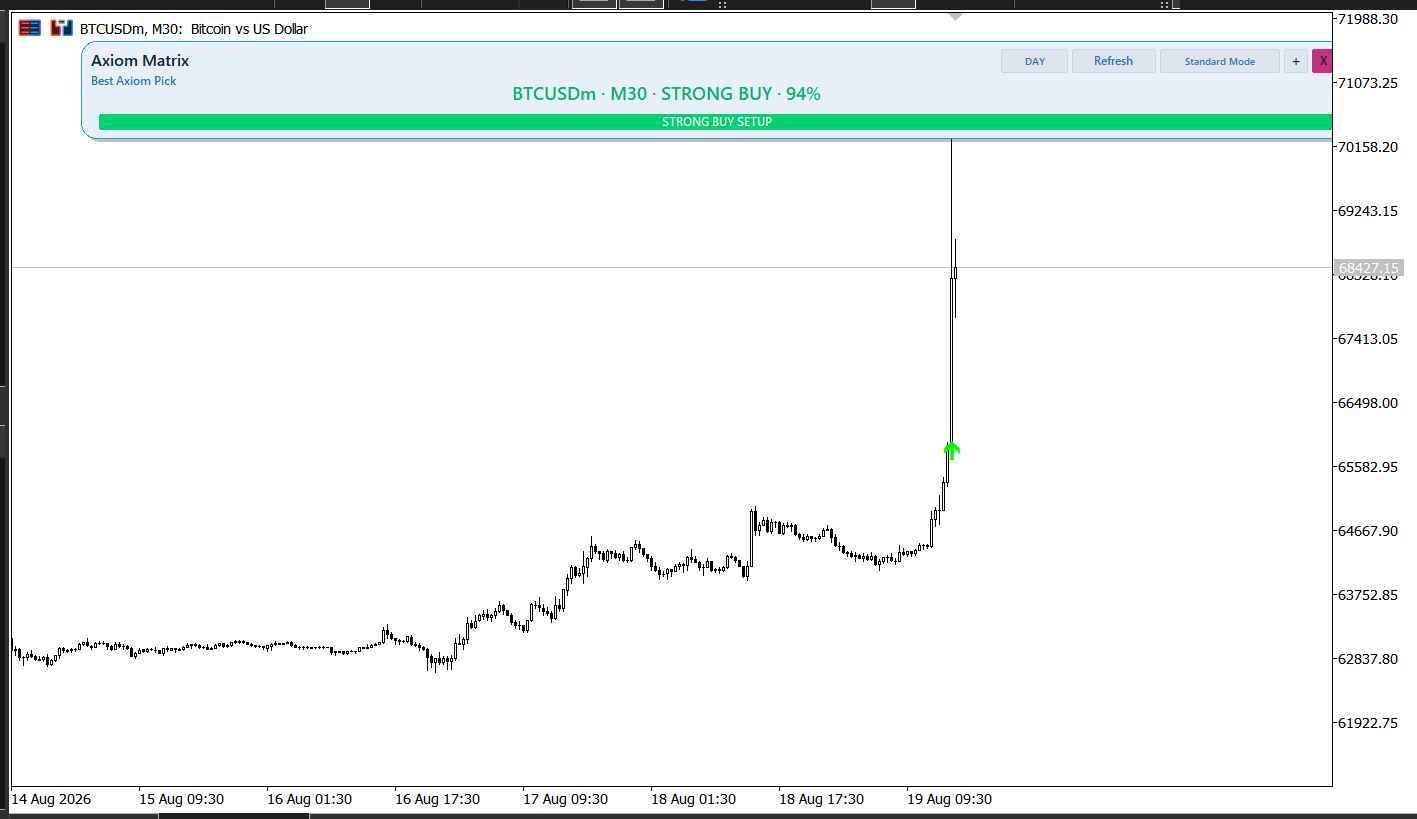
Check the symbol and timeframe before interpreting a scanner score. This historical August 2026 BTCUSDm M30 chart shows Axiom Matrix highlighting BTCUSDm M30 as the Best Axiom Pick, with STRONG BUY and a displayed 94% reading. Compare the pick with price structure and define an invalidation level before considering an entry. The percentage is an interface reading, not a guaranteed win rate or a live recommendation. Axiom Matrix is an analysis dashboard and does not place trades. Test your setup on demo first.
https://www.mql5.com/en/market/product/182954
: