 概览
概览 股票
股票 技术
技术 金融
金融 房地产
房地产 能源
能源 基础材料
基础材料 通讯服务
通讯服务 消费类周期性
 消费防御
消费防御 医疗保健
医疗保健 工业
工业 公用事业
公用事业 其他交易品种
 货币
货币 主要
主要 次要
次要 美国
美国 欧洲
欧洲 亚洲
亚洲 数字加密货币
 金属
金属 指数
指数 大宗商品
大宗商品 图表
图表 小工具
小工具XPTUSD: 铂金 / 美元
XPTUSD交易应用程序
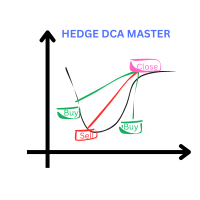
Wealth gained hastily will dwindle, but whoever gathers little by little will increase it.
This Expert is using DCA and Hedging Strategy. Live Account with startlot 0.04 : Hedge DCA Master HighRisk x4
Live Account with Middle Risk and recovery from loss other EA : https://www.mql5.com/en/signals/2289704
www.myfxbook. com/portfolio/hedge-dca-master/11230507 delete space before com I cut the loss and change the demo to Gold m15 because more happening on gold pair
The Key point: Use my cu
FREE
无论你是多周期分析派,还是只用一台显示器交易,这款工具都能派上用场。
把MT5变成分析指挥中心——图表同步与品种一键切换工具 每次切换策略都要一张一张手动改图表,是不是很麻烦? 货币对、指数、大宗商品的标签页太多,工作区乱糟糟的? 没有多台显示器,也想要接近多屏的分析效率? 如果这些场景你都很熟悉, All Charts Sync Changer Pro 正是为解决这些问题而设计的实用型EA。它能把你花在图表操作上的时间和精力,还给真正重要的事——分析和决策。
频道功能:让工作区管理彻底井井有条 这款工具的核心是 频道(Channel) 系统,可以把图表按用途分成互不干扰的组,例如: 频道1: 外汇主要货币对分组 频道2: 日元交叉盘分组 频道3: 股指与大宗商品分组 最多可设置10个独立的主图表。频道1的主图表只会同步分配到同一频道的子图表,不会影响其他频道。 也就是说,你终于可以按策略、按资产类别,把图表分得清清楚楚,互不干扰。
两种模式,操作都很简单 多图表同步模式 适合同时追踪多个策略或做相关性分析的交易者。给每个策略分配一个频道,各设一个主图表,点一下按钮,主图表本身以

Stop Cluster Mapper
Stop Cluster Mapper is a custom MT5 indicator that identifies where stop orders are most likely concentrated in the market and ranks each level by probability. Rather than drawing flat support and resistance lines, it scores every detected swing point across five independent factors and renders a weighted heatmap directly on your chart.
The result is a continuous score from 0 to 100 per level. High-scoring levels are drawn as thick red lines. Medium scores draw orange. Low

> Institutional Grade Multi-Index Adaptive Indicator
IndexViz Pro MT5 is a professional-grade, multi-index adaptive indicator designed for traders who demand institutional-level analysis across multiple markets simultaneously. Built for MetaTrader 5, IVP combines over 20 analytical modules into a single, unified visual dashboard that monitors stock indices, synthetic indices, commodities, forex pairs, and cryptocurrencies in real time. Unlike conventional indicators that analyze a single instr

注意,白金交易者!
XPTUSD 趋势保护型 EA 不会随意开仓。
它只在趋势明确且市场确认时才入场。
避免噪音和过度交易,保护账户不被破坏。
智能风险管理:连续亏损后降低仓位,连胜时增加盈利机会。
每笔交易独立——无马丁格尔、网格或对冲。
渐进式止损保护利润,同时不阻碍趋势发展。
适应伦敦、纽约及中间交易时段。
可控回撤,长期稳定。
为追求稳健而非侥幸的交易者设计。 XPTUSD 趋势保护型 EA 是一个完全自动化的专家顾问,专为 白金 (XPTUSD) 设计,运行于 M15 时间框架。 详细说明 系统基于 多时间框架趋势跟随逻辑 ,只有在市场结构、趋势强度和波动性确认时才执行交易,显著减少低质量操作。 核心特性是 自适应风险管理 :仓位大小根据账户余额、ATR 计算的止损距离以及对近期交易表现敏感的风险系数动态调整。连续亏损后,EA 会自动降低风险并启动冷却期,以优先保护资本。 渐进式止损 会随着价格向有利方向移动而调整,遵循 非线性保护曲线 ,逐步锁定利润,同时不限制趋势的完全发展。 EA 还会根据 伦敦、纽约及中间时段 调整操作参数,提高低质量时段的选择性,并在流动性和

Quantum Forex EA — 多指标交易系统 简介
Quantum Forex EA 是一款专业的 MetaTrader 5 交易顾问,结合了四种流行的技术指标来辅助交易决策。该顾问设计用于自动化金融市场交易,具备灵活的参数设置和可靠的风险管理系统。 主要特点 多指标交易系统: 移动平均线 (MA) — 分析快慢均线的交叉 相对强弱指数 (RSI) — 判断超买和超卖区域 MACD — 分析主线与信号线的交叉 布林带 (Bollinger Bands) — 依据布林带边界进行交易 灵活的信号逻辑: 可调节的确认指标数量(2 至 4 个) 不要求所有指标完全一致 可在部分指标同意时进行交易 专业的风险管理: 固定手数 — 以固定仓位交易 百分比风险 — 根据账户余额按百分比自动计算手数 控制最大同时持仓数 设置订单间最小间隔(点数和时间) 可调节止损和止盈: 灵活设置止损和止盈点数 可关闭止损/止盈(设置为 0) 自动适应经纪商条件 高级功能: 跟踪止损 — 自动追踪盈利仓位的止损 保本 — 达到设定盈利后自动移动止损到保本点 交易可视化 — 在图表上显示已平仓交易及结果 工作
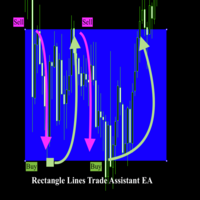
Rectangle line Trade Execution Assistant Rectangle Line Trade Assistant EA Semi-Automated Trading Assistant IMPORTANT : On the main/purchased program a user can click on the Rectangle line and move/ drag it around the chart, by double clicking on it. Please keep in mind that this option is not available on demo version, due to some restrictions/limitations of Strategy Tester, some Object related operations are not available in the Strategy Tester. But, it will not prevent you from Test
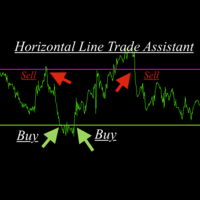
Horizontal Line Trade Assistant EA Semi-Automated Trading Assistant IMPORTANT : On the main/purchased program a user can click on the Horizontal line and change it to Buy or Sell, and drag by double clicking on it. Please keep in mind that this option is not available on demo version, due to some restrictions/limitations of Strategy Tester, some Object related operations are not available in the Strategy Tester. But, it will not prevent you from Testing, please drop an Object to chart