MR Trend Corrections 5

We publish the indicator as a useful tool in trading and call this indicator the "Swiss Army Knife" because it provides many possibilities and combinations to help understand the material on the "Masters of Risk" trading system. The indicator itself is not part of the tools used in the "Masters of Risk" trading system.


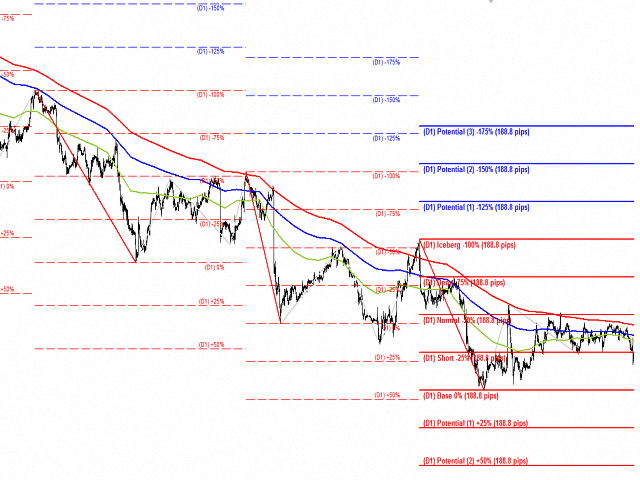
The indicator consists of 3 separate multi-timeframe indicators, which in combination with each other help to reduce the "noise" of false signals.

  • The first of the indicators are three "Moving averages". In trend they work well, but unfortunately the same cannot be said when we are in Range.
  • The second of the indicators is a modified "Zig-Zag". We use 3 bars on the left, 3 bars on the right and one bar in the middle to define the fractal. The indicator itself gives a lagging signal, but is very good at identifying "Impulse" price movements.
  • The third of the indicators is a modified "Fibonacci Levels". The idea is simple - we divide the "Impulse" price movement into equal parts of 25% each. This is what works in markets.

The combination of the three indicators helps you not to be "Lost in the Trend"!!!

Now we will explain the "Corrections" made by the price movement. Since we have not found anything meaningful as an explanation in the books we have and on the internet, we will use our own terminology for this.

  • "Potential (1) +25%" and "Potential (2) +50%" corrections determine how far the movement along the trend is possible to continue. According to our observations, these are the levels most often reached by the price movement. Reaching these levels is a slow and difficult process. It is very possible that this has to do with the "limit barriers" that the "Big" players put up or the fixing of their positions. If we have weak and short "Impulses", we wait... A trend reversal is possible at these correction levels!!!
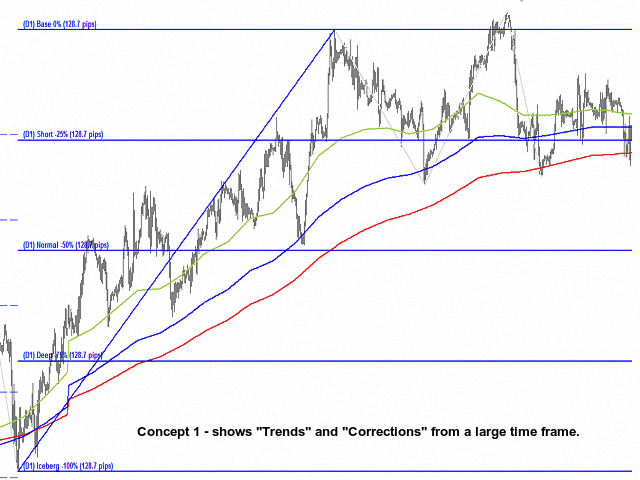
  • As "Base 0%" we use 0%, where the corrections start. The "Base 0%" is always at the end of the impulse price movement!!!
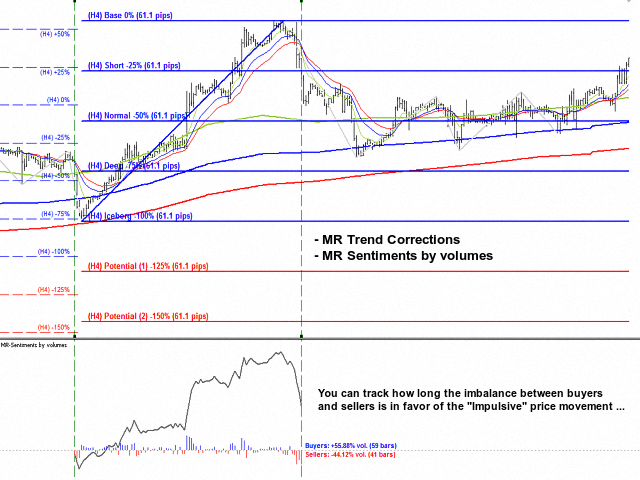
  • The "Short -25%" correction is the first level that the price corrects. This is a very interesting level of correction. From our experience, we have two findings about this: 1. This correction is tested in a "strong trend" and the next impulse of the price movement starts from it. The important thing is that there is no long-term holding of the price in the form of "Range". If there is no "Range", we call the level "Strong"!!! 2. If there is a "Range" we have the following finding.The battle between the "Big" players in the market has been going on for a long time and this has been seen by other market players. In such a case, the continuation is by testing the next correction of -50%. In that case, we call the -25% correction "Weak"!!!
  • In the "Normal -50%" level, there is nothing interesting. This is a "system" fix. Usually at this level there is some volume to be absorbed by the "Big" players in the market!!!
  • The most interesting is the next level of correction, which we have called "Deep -75%". This is a very interesting place. The essence of "Deep -75%" correction is as follows: A "big" player in the market holds an open position in the opposite direction of the price impulse (within the -100% correction). He has made interventions to reach his open position and to get out of it. However, other "Big" players saw this price movement and took action (more liquidity) to prevent it. In this case, we say that a "Big" player has remained in "Locked-in Range". The important thing to know is that in this level there is a battle between "Big" players and this level is very "Strong"!!!
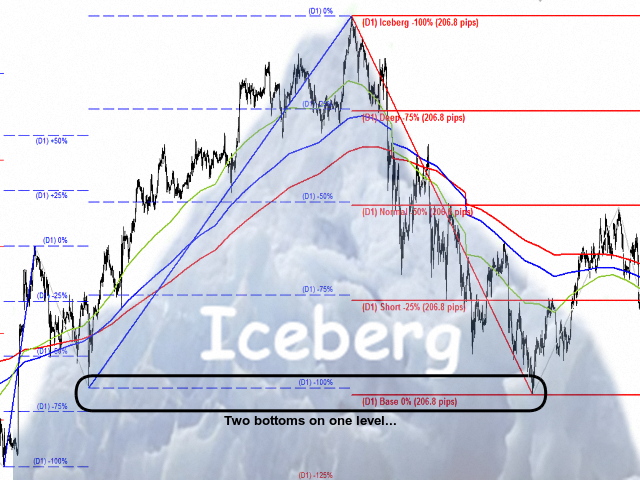
  • The term "Iceberg -100%" is our suggestion, because that is how we liken this model in the markets. It can easily be called "Mountain" and "Abyss". The essence of this correction is that there a "Big" player managed to get out of his position. There are two continuation options after the price has tested the "Iceberg -100%" correction. The first option is for the "Big" player to be very strong and win the battle with the other participants. Then we have a correction of between -25% and -50% of the "Iceberg" momentum and then a continuation of the price movement in the direction of the position of the strong "Big" player. The second option is that the "Big" player has freed himself from his position and has entered the market in a position opposite to his own. By adding his position to the other "Big" players, he gives a new impulse to the price movement and follows a big impulse and a new "Iceberg" model, opposite to the first one. A mandatory condition for a test of the "Iceberg -100%" level is that the price stops at this level and makes a correction. The "Iceberg -100%" model consists of two impulses - the second impulse is the size of the first impulse!!!
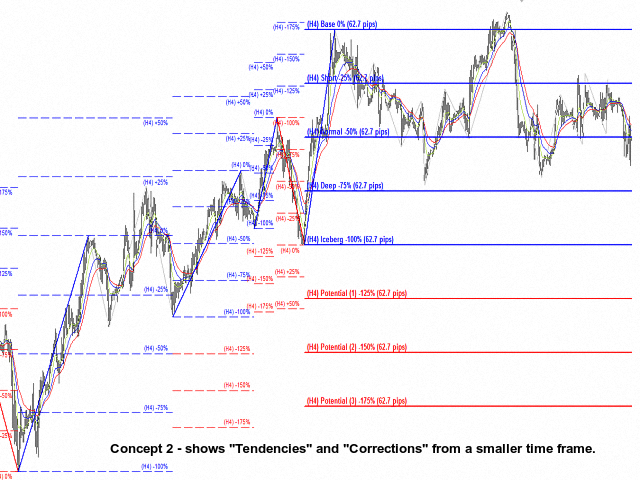
  • The "Potential (1) -125%", "Potential (2) -150%" and "Potential (3) -175%" corrections determine how far the correction movement can continue. According to our observations, these are frequently reached levels of the corrective price movement. Reaching these levels is a fast and powerful process. This is related to the increased liquidity at the expense of the stop losses of other players, regrouping of the positions of the "Big" players or long-term operations of Central Banks.


The indicator has two main concepts of use.

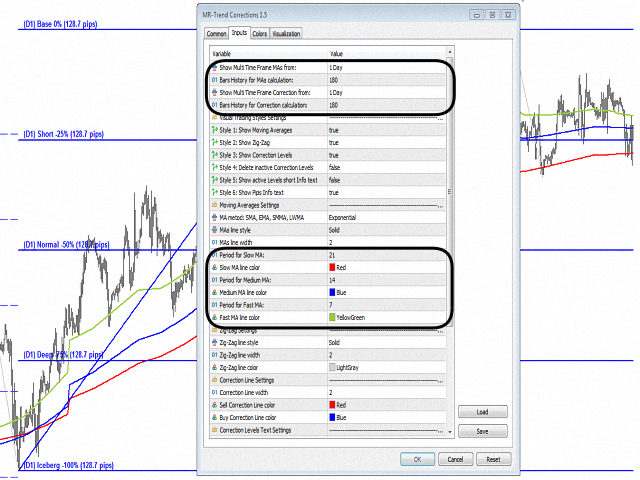
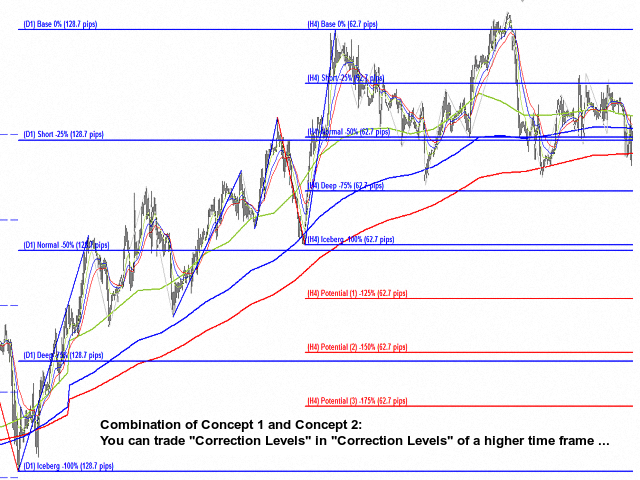
  • Concept 1 - shows "Trends" and "Corrections" from a large time frame. By default, the indicator is set to work on this concept - three "Moving averages" from time frame D1 with periods of 21, 14 and 7 days, "Zig-zag" and "Correction levels" also from time frame D1.
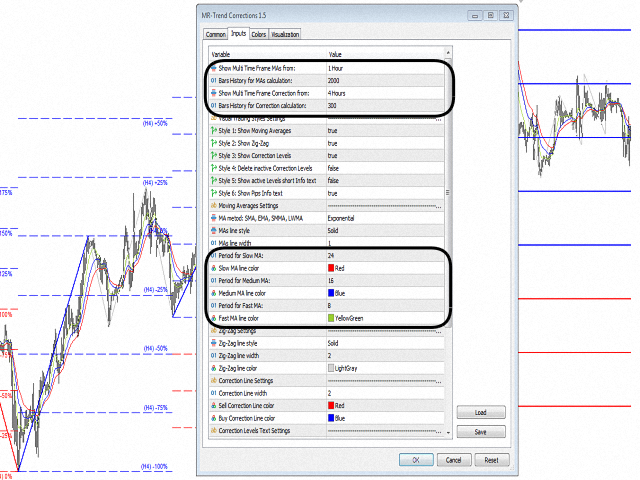
  • Concept 2 - shows "Tendencies" and "Corrections" from a smaller time frame. For example, If we use the "D1" time frame for the "Trend", then for the tendencies we will have to set the "Moving averages" on the current time frame, and the "Zig-zag" and the "Correction levels" one time frame higher - three "Moving averages" from time frame H1 with periods of 24, 16 and 8 hours, "Zig-zag" and "Correction levels" from time frame H4.
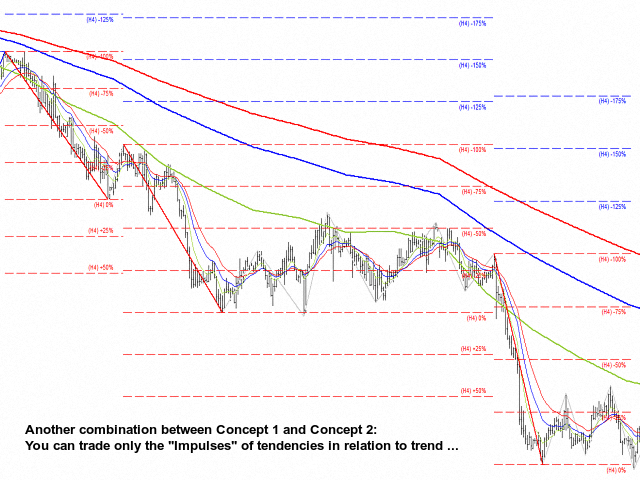
  • The combination of the two concepts provides an opportunity to trade the "Impulses" of tendencies (three H1 "Moving averages" that move in the same direction without crossing over a relatively long period of time) in relation to trend (three D1  "Мoving averages" that move in the same direction without crossing over a relatively long period of time). This way, you can trade "Correction Levels" into "Correction Levels" from a higher time frame.


Since the "MR Trend Corrections" indicator is an auxiliary tool, we recommend using it in combination with our other indicators to confirm trend movement or its reversal.

The features of our indicator are as follows:

  • The indicator shows the "Impulse" movement of the price and their "Corrections". Which "Impulse" movements are important and which are not are determined according to the author's methodology.
  • It shows the distance between the "Correction Levels" in pips, which makes it easier to make decisions about whether to trade the distances between them.
  • The indicator can use each of the nested indicators on its own, allowing you to combine them to meet the many requirements of traders.
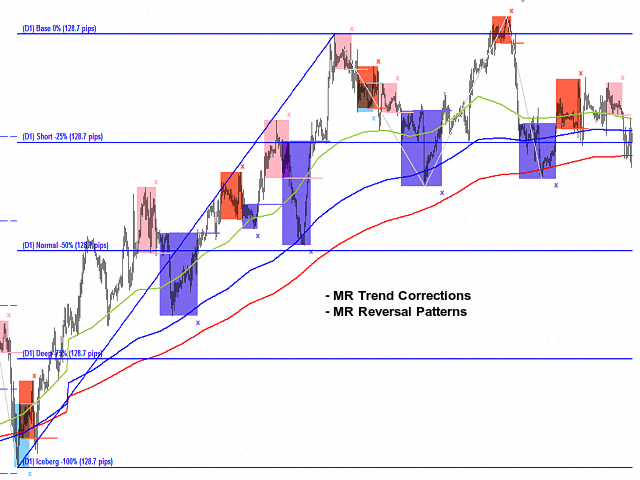
  • In combination with the "MR Reversal Patterns" indicator and its trading models, you can track how the price moves in the "Impulse" and where the price ends its corrections.
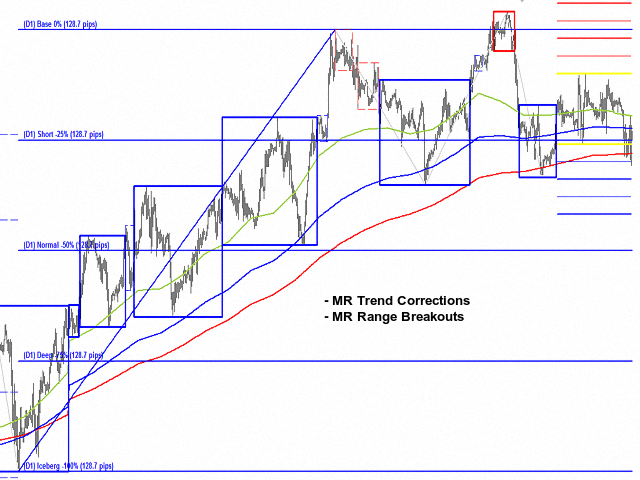
  • In combination with the "MR Range Breakouts" indicator, you can track the places where the volumes accumulate in the "Balances" and "Ranges" along the trend. Then the volumes of these places are absorbed in the "Correction" movements.
  • In combination with the "MR Volume POC Levels" indicator, you can track the places where volumes are absorbed and accumulated. You will notice that in the "Impulse" movements, the volumes participate in the entrainment of the price movement in the direction of the "Impulse", and in the "Corrections" new places arise with volumes that keep the price movement in the range.
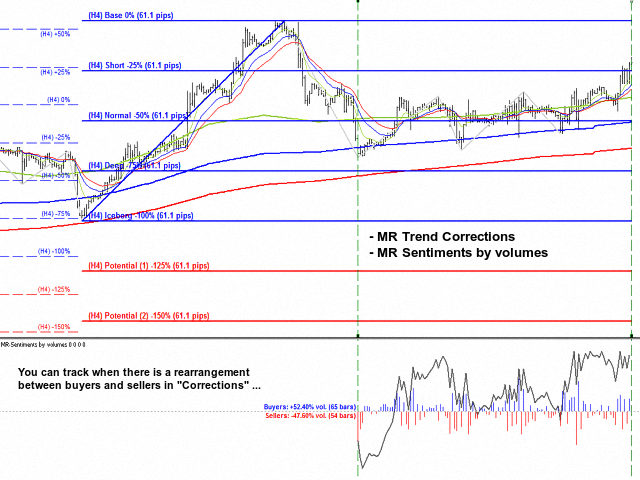
  • Combined with the "MR Sentiments by volumes" indicator, you can track how long the imbalance between buyers and sellers is in favor of the "Impulsive" price movement and when there is a rearrangement between them at the beginning and at the end of "Corrections".


We also use other combinations to trade only the "Impulses" of tendencies in relation to trend.

    • For traders with a "Scalping" trading style, the following combinations are suitable:
    - If you are trading on the M1 time frame, we recommend using - 3 EMAs from time frame M15 (24,16,8) + 3 EMAs from time frame M1 (24,16,8), "Zig-zag" and "Correction levels" from time frame M5.
    - If you are trading on the M5 time frame, we recommend using - 3 EMAs from time frame Н1 (24,16,8) + 3 EMAs from time frame M5 (24,16,8), "Zig-zag" and "Correction levels" from time frame M15.
      • For traders who trade on time frames M15 - H1, the following combinations are suitable - 3 EMAs from time frame D1 (21,14,7) + 3 EMAs from time frame H1 (24,16,8), "Zig-zag" and "Correction levels" from time frame H4.
      • For traders who trade on time frame H4, the following combinations are suitable - 3 EMAs from time frame 1W + 3 EMAs from time frame H4 (21,14,7), "Zig-zag" and "Correction levels" from time frame D1.


      If you liked the indicator, please support our work by giving 5 stars!!!

      For MetaTrader 4 https://www.mql5.com/en/market/product/94053


      Indicator settings:

      Show Multi Time Frame MAs from: - Multi time frame on which to calculate the "Moving Averages". By default, the indicator works with data from time frame D1.
      Bars History for MAs calculation: - Number of bars on which the indicator works from multi time frame D1.
      Show Multi Time Frame Correction from: - Multi time frame on which to calculate the "Zig-Zag" and "Correction Levels". By default, the indicator works with data from time frame D1.
      Bars History for Correction calculation: - Number of bars on which the indicator works from multi time frame D1.

      Section "Visual Trading Styles Settings"
      Style 1: Show Moving Averages - Shows or not "Moving Averages".
      Style 2: Show Zig-Zag - Shows or not "Zig-Zag".
      Style 3: Show Correction Levels - Shows or not "Correction Levels".
      Style 4: Delete inactive Correction Levels - Shows or deletes inactive "Correction Levels". The shows of inactive corrections is for the purpose of researching the history of a financial instrument.
      Style 5: Show active Levels short Info text - Show an abbreviated form of information about "Correction Levels". If not, it shows an expanded form of the "Correction Levels" information.
      Style 6: Show Pips Info text - Shows or not Pips Info text.

      Section "Moving Averages Settings"
      In this section you can set the visual and technical details for "Moving Averages".

      Section "Zig-Zag Settings"
      In this section you can set the visual details for "Zig-Zag".

      Section "Correction Line Settings"
      In this section you can set the visual details for "Correction Line".

      Section "Correction Levels Text Settings"
      In this section you can set the visual and technical details for "Correction Levels Text".

      Section "Pips Info Text Settings"
      Use manual Pips calculation - Allows to choose between manual or automatic mode to calculate the Pips between two corrections. By default, automatic mode is on. We provide this option because different "Brokers" provide different forms of information about the same financial instrument. For example, one "Broker" provides information about the financial instrument "NAS100" with 1 decimal place, and another "Broker" with 2 decimal places. The manual Pips calculation form allows you to make the values for the pips shown in the indicator the same.
      Characters after the decimal point - In manual Pips calculation mode you can choose how many decimal places to calculate pips.

        推荐产品
        Limitless MT5
        Dmitriy Kashevich
        Limitless MT5 is a universal indicator suitable for every beginner and experienced trader. works on all currency pairs, cryptocurrencies, raw stocks Limitless MT5 - already configured and does not require additional configuration And now the main thing Why Limitless MT5? 1 complete lack of redrawing 2 two years of testing by the best specialists in trading 3 the accuracy of correct signals exceeds 80% 4 performed well in trading during news releases Trading rules 1 buy signal - the ap
        Manyal trading system, CovEchoTrend Robot, focuses on reliability and flexibility. By employing statistical analysis methods to study the relationships between the base indicator and market patterns, the system enables a deeper understanding of market processes. Intelligent pattern analysis: The application of statistical data processing helps identify key trend reversal points more accurately, signaling significant market shifts. Informed decision-making is based on the intersection of indicato
        MarketMagnet
        Kelly Adediran Raymond
        Are you ready to take your trading journey to new heights? Look no further than MarketMagnet, this groundbreaking indicator designed to propel your trading success with excitement and accuracy. Powered by the convergence of Momentum and CCI (Commodity Channel Index), MarketMagnet equips traders with the ultimate tool to determine direction and entry prices for a wide range of recommended currency pairs and instruments. It is designed for traders seeking to scalp for a few pips on lower timeframe
        Divergence Detection: The indicator is designed to identify divergences between the price movement and the Stochastics oscillator. This can help traders spot potential trend reversals or trend continuation opportunities. Early Warning System: By capturing divergences, the Stochastics Divergence Indicator can provide an early warning of possible market turning points. This allows traders to take timely action and make informed decisions. Versatility: The indicator can be applied to various finan
        The new update makes this indicator a complete tool for studying, analyzing and operating probabilistic patterns. It includes: On-chart Multi-asset percentage monitor. Configurable martingales. Twenty-one pre-configured patterns, including Mhi patterns and C3. An advanced pattern editor to store up to 5 custom patterns. Backtest mode to test results with loss reports. Trend filter. Hit operational filter. Martingale Cycles option. Various types of strategies and alerts. Confluence between patter
        Cycles Forecast
        Pooriya Alirezaee
        This indicator is based on a mathematical formula and an ANN combined, designed to make a model(using previous prices) of the most recent market condition (any chart*) in order to use the model as a forecasting tool. *This indicator can operate on any chart/timeframe, but it's suggested you use multiple timeframes for each trade because this method relies solely on the time factor, you can not use this indicator to predict price volatility, but if it's fit correctly it will show you when the nex
        Tragos
        David Chokumanyara
        TRAGOS Indicator – The GOAT of All Trading Indicators TRAGOS (Greek for “male goat”) isn’t just a name — it’s the GOAT: Greatest of All Time in trading indicators. Designed for Forex, Indices, Gold, Crypto, and Deriv Synthetic Indices (Boom & Crash, Volatility 75, Step, Jump, etc.), it gives you non-repainting buy, sell, and exit signals with unmatched clarity. Why TRAGOS? Non-Repainting Signals – 100% reliable. Audible, Email & Push Alerts – Never miss a trade. Trend Following – Rid
        Visual Range Directional Force Indicator
        AL MOOSAWI ABDULLAH JAFFER BAQER
        Range Directional Force Indicator – Designed for You to Optimize! The Range Directional Force Indicator is a cutting-edge tool designed to empower traders by visualizing market dynamics and directional strength. Built to offer insights into market trends and reversals, this indicator is an invaluable asset for traders seeking precision in their strategies. However, it is important to note that this indicator is not optimized, leaving room for you to tailor it to your unique trading preferences.
        Introduction to Fractal Pattern Scanner Fractal Indicator refers to the technical indicator that makes use of the fractal geometry found in the financial market. Fractal Pattern Scanner is the advanced Fractal Indicator that brings the latest trading technology after the extensive research and development work in the fractal geometry in the financial market. The most important feature in Fractal Pattern Scanner is the ability to measure the turning point probability as well as the trend probabil
        The Plasma Trend indicator is a simple technical indication that is used to determine the current trend direction in the market. The Plasma Trend indicator is a powerful tool for determining the direction of the trend in the Forex market. It is based on both standard technical indicators and proprietary mathematical calculations, which provides a more accurate and reliable trend determination. Its implementation in the form of lines of two colors simplifies the visual determination of a change
        Market Session Pro
        Kambiz Shahriarynasab
        The  Market Sessions Indicator for MT5 helps you  predict market turnarounds  by detecting major supply and demand areas. These pivot points tend to occur after a new session has started and the previous one is still open. It is also used to gauge how many points or pips the market moves on average during a session. This helps us to place better our take profits and stop losses. The indicator works on all forex pairs, gold, silver, commodities, stocks, indices and any other instrument that your
        The key logic of SignalTech is generated by Artificial Intelligence. The machine learning module should continue optimizing the core logic on the server side to guarantee that SignalTech System can accurately track the market's movement.  SignalTech can generate AI based signals with Buy/Sell Arrows and Pop-Up/Sound Alerts. Each signal has clear Entry and stop Loss levels, which should be automatically flagged on the chart, as well as potential Targets 1, 2, and 3. SignalTech can work on EURU
        Manus Pro
        Itumeleng Mohlouwa Kgotso Tladi
        MANUS PRO EA The Trading Revolution You've Been Waiting For Are you TIRED of watching other traders make consistent profits while your account bleeds red?   The financial markets don't wait for anyone – and neither should you. MANUS PRO isn't just another Expert Advisor... it's your   TICKET TO FINANCIAL FREEDOM . Why MANUS PRO is Different (And Why Everyone's Talking About It) FOR BEGINNERS: Your Trading Mentor That Never Sleeps Zero Learning Curve   – Install, activate, and watch it wo
        ChoppyLenns
        Marius Ovidiu Sunzuiana
        Choppy Market Detector — Trade Smarter, Not Harder Main Statement: 90% of traders lose money — not because they misread trends, but because they trade during choppy, indecisive markets. This premium indicator helps you avoid that trap by detecting when the market is choppy, so you can stay out of low-probability trades and protect your capital. What It Does: Identifies Choppy Conditions: Uses advanced volatility filters and price action analysis to detect sideways or erratic market be
        SyntheticaFX Boom & Crash Multi 指标适用于 MetaTrader 5,是一款先进的交易工具,旨在通过检测潜在的峰值和分析各时间框架的市场趋势来提升您的交易策略。该指标专为 Crash 和 Boom 指数量身定制,提供及时警报和重要的趋势信息,帮助您做出明智的交易决策。 主要特点: 峰值检测: 检测以下指数和时间框架的潜在峰值: Crash 1000、900、600、500、300:3分钟和5-10分钟时间框架 Boom 1000、900、600、500、300:3分钟和5-10分钟时间框架 趋势分析: 显示市场是处于上升趋势还是下降趋势,帮助做出战略性入场和离场决策。 交易入场建议: 建议仅在下降趋势时进行 Crash 入场,仅在上升趋势时进行 Boom 入场。 推荐止损设置: 高风险和中风险入场:5-15(3分钟蜡烛) 入场1和2:5-6(5分钟蜡烛) 利润管理: 当交易进入利润区时,如果峰值触发,可考虑在关闭之前持有几根蜡烛。 如果没有其他峰值出现,确保在盈利时平仓。 使用指南: 结合您的分析以及支撑和阻力使用。 Crash 指数: 监控3分钟和5-
        Introduction to Chart Pattern MT Chart Pattern MT is a chart pattern scanner to detect the triangle pattern, falling wedge pattern, rising wedge pattern, channel pattern and so on. Chart Pattern MT uses highly sophisticated chart pattern detection algorithm. However, we have designed it in the easy to use with intuitive user interface. Chart Pattern MT will show all the patterns in your chart in the most efficient format for your trading. You do not have to do tedious manual pattern detection an
        Rtc ML Ai Predictor
        Muhammad Faisal Sagala
        Product Description Rtc ML Ai Predictor — Futuristic Intelligence for Real-Time Market Decisions Bring robotic precision to your trading. Rtc ML Ai Predictor fuses Machine Learning with SMA-shift dynamics to forecast short-term momentum and trend inflection points with clarity. The model evaluates multi-factor market structure, assigns a confidence score to each signal, and lets you act only when conditions align with your rules. Why traders choose Rtc ML Ai Predictor AI-guided entries: ML infer
        Hello There, Today I want to show you my new researchable fore BUY SELL indicator, it work all asset, and also work Derive Volatility asset! it work all time frame, but i recommend start 5 minute to H1 when you receive a signal just take trade and stay wait for your take profit asset All Major Pair And minor IT WORK ALSO XAUUSD Fantastic results,  for more info,,, message us thank you   
        Mac-Binary option Signals is unique mathematical concept to trade iqoptions,binary,rocketoptions specter or any other binary options company 1 min 5 expiry run robot 30min everyday and fill profit and loss ratios inside mt2iq/mt2binary and run or 1min to 5min expiry ...go to setting in mt2iq robot allow otc and digital options. and select risk 500and profit 300$ per day it can stop automatically after profit or loss... If it can close after loss restart and Reset profit and loss button run again
        Ovenstone Trend Analyser Professional Multi-Timeframe Confluence Indicator Transform Your Trading with Intelligent Confluence Analysis The Ovenstone Trend Analyser is a sophisticated trading indicator that identifies high-probability trading opportunities by analyzing trend confluence across multiple market dimensions. Designed for serious traders who demand precision and clarity in their market analysis. Key Features Multi-Timeframe Intelligence Always uses H4 timeframe data regard
        PipFinite Exit EDGE MT5
        Karlo Wilson Vendiola
        4.86 (29)
        Did You Have A Profitable Trade But Suddenly Reversed? In a solid strategy, exiting a trade is equally important as entering. Exit EDGE helps maximize your current trade profit and avoid turning winning trades to losers. Never Miss An Exit Signal Again Monitor all pairs and timeframes in just 1 chart www.mql5.com/en/blogs/post/726558 How To Trade You can close your open trades as soon as you receive a signal Close your Buy orders if you receive an Exit Buy Signal. Close your Sell orders if
        Trend Turn
        Ivan Simonika
        The implementation of the Trend Turn trend indicator is simple - in the form of lines of two colors. The indicator algorithm is based on standard indicators as well as its own mathematical calculations. The indicator will help users determine the direction of the trend. It will also become an indispensable advisor for entering the market or closing a position. This indicator is recommended for everyone, both beginners and professionals. How to interpret information from the indicator. We sell
        该指标找到AB = CD回撤形态。 AB = CD回调模式是一种4点价格结构,其中初始价格区间被部分回调,然后与回调完成后等距移动,这是所有谐波模式的基本基础。 [ 安装指南 | 更新指南 | 故障排除 | 常见问题 | 所有产品 ] 可定制的图案尺寸 可定制的AC和BD比率 可定制的突破时间 可定制的线条,颜色和大小 它根据CD纤维水平显示SL和TP水平 视觉/声音/推送/邮件警报,用于模式和突破 AB = CD Retracements可以扩展和重新绘制很多内容。为了使事情变得更容易,该指标实施了一个转折:它在向交易发出信号之前等待正确方向的Donchian突破。最终结果是带有非常可靠的交易信号的重新粉刷指示器。输入donchian突破时段作为输入。 看涨回撤是蓝色的 空头回撤是红色的 请注意,价格模式(例如AB = CD)可以扩展,指标必须重新绘制以跟随该模式的扩展。如果图案重涂超出了参数中输入的AC / BD / AB = CD比率,则该图案将消失,因为它将不再有效。要交易这些模式,请求助于donchian突破信号。 输入参数 幅度:AB = CD模式的大小 突围
        Receive notifications for multi-trendline or single trendline breakout. Yes! You heard us right!  You will be notified the moment price crosses any and all the timeframe trendlines that you have chosen.  1.    ADDING MULTIPLE OR SINGLE TRENDLINES IN THE SAME DIRECTION To trigger a stronger trading opportunity you can require that price breaks one or more trend lines of different timeframes in the same direction. To do this navigate to the timeframe for which you want to add a trendline and click
        Fib Auto Trendline
        Nhlanhla Brilliant Mashavha
        INTRODUCTION The  Fib Autotrendline   is a basic tool that analysts use to find out when a security's trend is reversing. By determining the   support and resistance areas , it helps to identify significant changes in price while filtering out short-term fluctuations, thus eliminating the noise of everyday market conditions. It is an excellent tool for any trader who follows indicators that use   swing highs  and   swing lows . How to Use the fib Auto Trendline Indicator The Fib Auto Trendline
        Gann Zone Pro MT5
        Kirill Borovskii
        This indicator identifies and displays zones, as it were areas of strength, where the price will unfold. The indicator can work on any chart, any instrument, at any timeframe. The indicator has two modes. The indicator is equipped with a control panel with buttons for convenience and split into two modes. Manual mode: To work with manual mode, you need to press the NEW button, a segment will appear. This segment is stretched over the movement and the LVL button is pressed. The level is displayed
        ATrend
        Zaha Feiz
        4.82 (17)
        ATREND: 工作原理及使用方法 工作原理 “ATREND”指标针对MT5平台设计,旨在通过结合多种技术分析方法为交易者提供强有力的买卖信号。该指标主要利用平均真实波幅(ATR)来测量波动性,并结合趋势检测算法来识别潜在的市场动向。 购买后请留言,您将获得特别的赠品。 主要特点: - 动态趋势检测:该指标评估市场趋势并相应调整信号,帮助交易者与当前市场条件对齐策略。 - 波动性测量:通过使用ATR,该指标衡量市场波动性,这对于确定最佳止损(SL)和止盈(TP)水平至关重要。 - 信号可视化:该指标在图表上直观地表示买卖信号,增强交易者的决策能力。 操作步骤 输入和设置: - 时间框架:此输入允许您设置指标计算的主要时间框架,默认值为15分钟。 - 时间框架2:此输入可用于定义额外分析的辅助时间框架,默认值为1分钟。 - 移动:此参数允许您将指标的计算向回移动,默认值为0。 - SLATR:此输入定义用于根据ATR计算止损水平的乘数,默认值为2.56。 - TPATR:此输入定义用于根据ATR计算止盈水平的乘数,默认值也为2.56。 - AlertsOn:启用或禁用交易信号的警报,
        My PVSR
        Ashok Kumar Singha
        My PVSR   is based on All Type of Pivot Points. Use this Indicator to get proper Support / Resistance Zone and Trade accordingly.. Recommendation: Use this Indicator along with my another Indicator --->>> Dr. Trend   <<<--- Click Here ; To get the best output result feel free to contact me ; Best of Luck It can be used for: All Pairs: Forex, Cryptocurrencies, Metals, Stocks, Indices etc. All Timeframe All Brokers All type of Trading Style like Scalping, Swing, Intraday, Short-Term, Long-
        A useful scanner/dashboard that shows the RSI values for multiple symbols and Time-frames. It can be easily hidden/displayed with a simple click on the scanner man top left of the dashboard. You can input upper and lower RSI values and the colours can be set to show when above/below these values. The default values are 70 and 30. There are also input colours for when the RSI is above or below 50 (but not exceeding the upper/lower levels Symbols and time-frames are input separated by commas. S
        Reversals Trend
        Vitalii Zakharuk
        The Reversal Trend indicator was created on the basis of the original indicators for searching for extremes, the indicator is well suited for determining a reversal or a large sharp jerk in one direction, thanks to it you will know when this happens, it will notify you by the appearance of a blue dot to buy red to sell. It is based on the process of identifying the rate of change in price growth and allows you to find entry and exit points from the market. a fundamental technical indicator th
        该产品的买家也购买
        RelicusRoad Pro MT5
        Relicus LLC
        5 (22)
        您购买了多少次交易指标,它们拥有 出色的回测, 真实账户表现证明 拥有惊人的数字和 各种统计数据, 但使用后您却 账户爆仓? 您不应该只相信一个信号本身,您需要知道它最初出现的原因,这正是 RelicusRoad Pro 的最佳之处! 用户手册 + 策略 + 培训视频 + 带 VIP 访问权限的私人群组 + 提供移动版本 观察市场的新方式 RelicusRoad 是 全球最强大、最好的交易指标 ,适用于外汇、期货、加密货币、股票和指数,为交易者提供发展账户所需的所有信息和工具。我们提供 技术分析 和 交易计划 ,帮助 每位交易者取得成功 ,无论是 初学者 还是 高级交易者 。 它是一个 关键交易指标 ,提供足够的信息来 预测 未来市场。我们相信一个 完整的解决方案 ,而不是图表上几个没有意义的不同指标。这是一个 一体化指标 ,显示 信号 、 箭头 + 价格行为 信息,这是 无与伦比 且 非常准确的 。   RelicusRoad 利用机器学习 (AI) 技术,为交易者提供必要的信息和工具,帮助他们成为成功的、知情的交易者。   通过领先指标预测未来价格 几乎 所有技术指标都滞后 ,
        TPSpro RFI Levels MT5
        Roman Podpora
        4.53 (19)
        反转区域 - 主要参与者的水平/活跃区域 俄语说明 /   英文 说明 /   MT4 版本 该指标的每位买家   额外 免费 获得: 3个月   从服务中获取交易信号   超级信号     — 根据 TPSproSYSTEM 算法准备的切入点。 3个月   获取定期更新的培训材料 - 沉浸在战略和专业成长中。 工作日每天 24 小时提供支持,并可访问封闭的交易者聊天室 - 沟通、协助和市场情况分析。 主要功能: 显示卖家和买家的活跃区域! 该指标显示所有正确的买入和卖出的初始脉冲水平/区域。当这些水平/区域被激活时,即开始寻找入场点的位置,水平线会改变颜色,并填充特定颜色。此外,还会显示箭头,以便更直观地了解情况。 LOGIC AI - 激活模板时显示用于搜索入口点的区域(圆圈) 为了提高视觉清晰度,添加了使用人工智能搜索入口点的显示区域的功能。 显示更高时间范围内的级别/区域(MTF 模式) 新增使用更高时间间隔显示级别/区域的功能。此外,该指标还具备自动趋势检测功能 (   TPSproTREND PRO   )。 独立的专业分步交易算法 该算法专为顺势和逆势的日内交易而设计。
        AriX
        Temirlan Kdyrkhan
        1 (2)
        AriX Indicator for MT5 A powerful trend-following and signal-evaluation tool AriX is a custom MT5 indicator that combines Moving Averages and ATR-based risk/reward logic to generate clear buy/sell signals. It visualizes dynamic SL/TP levels, evaluates past trade outcomes, and displays win/loss statistics in a clean on-chart panel. Key features include: Buy/Sell signals based on MA crossovers ATR-based SL/TP1/TP2/TP3 levels with visual lines and labels Signal outcome tracking with real-time stat
        “ Dynamic Scalper System MT5 ”指标专为在趋势波内进行剥头皮交易而设计。 已在主要货币对和黄金上进行测试,并可与其他交易工具兼容。 提供顺势短线建仓信号,并提供额外的价格变动支持。 指标原理: 大箭头决定趋势方向。 在趋势波内,我们采用一种生成小箭头形式的剥头皮交易信号的算法。 红色箭头代表看涨方向,蓝色箭头代表看跌方向。 敏感的价格变动线会沿着趋势方向绘制,并与小箭头信号协同作用。 信号运作方式如下:当线在适当时刻出现时,将形成入场信号;在出现线时,持仓;线完成后,平仓。 建议的操作时间范围为M1 - H4。 箭头在当前K线上方形成,如果下一根K线已开仓,则不会重新绘制上一根K线上方的箭头。 输入参数 Trend Wave Period - 趋势方向(大箭头)的周期,改变趋势波的时间间隔。值 1 表示趋势方向的最长持续时间,参数值越大,持续时间越短。 Scalper Arrows Period - 信号箭头(小箭头)的计算周期,改变入场信号的生成频率。值 3 表示最频繁的生成频率,参数值越大,箭头频率越低,准确度越高。 这些参数可以根据不同
        ARICoins
        Temirlan Kdyrkhan
        ARICoin is a powerful trading companion designed to generate high-probability entry signals with dynamic TP/SL/DP levels based on volatility. Built-in performance tracking shows win/loss stats, PP1/PP2 hits, and success rates all updated live. Key Features: Buy/Sell signals with adaptive volatility bands Real-time TP/SL/DP levels based on ATR Built-in MA Filter with optional ATR/StdDev volatility Performance stats panel (Success, Profit/Loss, PP1/PP2) Alerts via popup, sound, push, or email Cust
        ARIPoint
        Temirlan Kdyrkhan
        ARIPoint is a powerful trading companion designed to generate high-probability entry signals with dynamic TP/SL/DP levels based on volatility. Built-in performance tracking shows win/loss stats, PP1/PP2 hits, and success rates all updated live. Key Features: Buy/Sell signals with adaptive volatility bands Real-time TP/SL/DP levels based on ATR Built-in MA Filter with optional ATR/StdDev volatility Performance stats panel (Success, Profit/Loss, PP1/PP2) Alerts via popup, sound, push, or email Cu
        ARIScalping
        Temirlan Kdyrkhan
        ARIScalp is a powerful trading companion designed to generate high-probability entry signals with dynamic TP/SL/DP levels based on volatility. Built-in performance tracking shows win/loss stats, PP1/PP2 hits, and success rates all updated live. Key Features: Buy/Sell signals with adaptive volatility bands Real-time TP/SL/DP levels based on ATR Built-in MA Filter with optional ATR/StdDev volatility Performance stats panel (Success, Profit/Loss, PP1/PP2) Alerts via popup, sound, push, or email Cus
        MetaForecast M5
        Vahidreza Heidar Gholami
        5 (3)
        MetaForecast能够根据价格数据中的谐波来预测和可视化任何市场的未来走势。虽然市场不总是可预测的,但如果价格中存在模式,MetaForecast可以尽可能准确地预测未来。与其他类似产品相比,MetaForecast通过分析市场趋势可以生成更精确的结果。 输入参数 Past size (过去的尺寸) 指定MetaForecast用于创建生成未来预测模型的柱数量。该模型以一条黄色线绘制在所选柱上。 Future size (未来的尺寸) 指定应预测的未来柱数量。预测的未来以粉色线表示,并在其上绘制了蓝色回归线。 Degree (程度) 此输入确定了MetaForecast将在市场上进行的分析级别。 Degree 描述  0 对于程度0,建议使用较大的值来设置“过去的尺寸”输入,以覆盖价格中的所有高峰、低谷和细节。  1 (建议的) 对于程度1,MetaForecast可以理解趋势,并通过较小的“过去的尺寸”生成更好的结果。  2 对于程度2,除了趋势,MetaForecast还可以识别反转点。对于大于1的程度,必须使用较高的“细节”和“噪音减少”输入值。  大于2 不建议使用大于
        Big Player Range
        Thalles Nascimento De Carvalho
        5 (3)
        BigPlayerRange — 适用于沪深300和美元人民币的最佳MT5指标 探索 BigPlayerRange 的强大功能,它被认为是用于 沪深300、上证指数、USD/CNH 等资产的 MetaTrader 5 最佳指标 。该工具能精准识别机构主力的关键区域,帮助交易者进行高精度的技术分析。 指标工作原理: BigPlayerRange 绘制两个水平区域,通过成交量分析反映市场能量: 绿色区域 :买方防守位置,支撑价格。 红色区域 :卖方压制位置,形成阻力。 使用策略: 收盘价突破绿色区域上方 :可能开启上涨趋势,目标为上方区间。 收盘价跌破红色区域下方 :暗示下跌压力增强,目标为下方支撑。 价格停留在区间内 :行情震荡,等待突破信号。 核心优势: 机构活动区域识别 :提前发现主力进出场信号。 自动计算的目标价格 :提供两个明确的止盈位置。 回调概率分析 :优化风险控制,提升稳定性。 参数个性化设置: 自定义交易时间与成交量类型(Tick或真实成交量)。 使用机构逻辑提升日内交易效率。 推荐搭配
        Weis Wave with Alert MT5
        Trade The Volume Waves Single Member P.C.
        4.94 (16)
        Rental/Lifetime Package Options and Privileges  Rent Monthly Six Months   Yearly/Lifetime Weis Wave with Speed with Alert+Speed Index x x x Manual  x x x Quick Set up Video x x x Blog x x x Lifetime Updates x x x Setup and Training Material x x Discord Access Channel "The SI traders"          x Rectangle Break Alert Tool      x How to trade with it:    http://www.tradethevolumewaves.com   ** If you purchase please contact me to setup your  : Training Room and  complete manual access.  Wei
        AI Arrow
        Victor-manuel Lozano Garcia
        QUICK OVERVIEW: Use AI to predict the markets with AI Arrow, the ultimate trading tool, let it manage the probabilities and send you a simple signal in the form of an arrow, ready to trade, no complex configurations. The indicator will analyze the market and let you know when a potential movement will happen, sometimes it takes some extra bars for the movement to happen as it can't predict the exact top/bottom every time. Arrow will appear at the start of a new bar and alert you, so you have ti
        Custom Signal Scanner MT5
        Satya Prakash Mishra
        Custom Indictor Signal Scanner for scan your own any custom indicator and template its one click you can open your desire signals(given time frame alert). Also can open same template with particular input indicator just type name of template your created with given indicator and enjoy all time frame scan with your logical signals  input string s2 = "====== Embedded Indicator Settings ======"; input UseEmbeddedIndicator = false; // Use embedded indicator instead of external file ( don't use its n
        Introduction to X3 Chart Pattern Scanner X3 Cherart Pattern Scanner is the non-repainting and non-lagging indicator detecting X3 chart patterns including Harmonic pattern, Elliott Wave pattern, X3 patterns, and Japanese Candlestick patterns. Historical patterns match with signal patterns. Hence, you can readily develop the solid trading strategy in your chart. More importantly, this superb pattern scanner can detect the optimal pattern of its kind. In addition, you can switch on and off individu
        Pantera Indicator
        Temirlan Kdyrkhan
        5 (1)
        A tool for on-chart strategy backtesting and performance analysis. A utility for developing, debugging, and testing custom trading ideas and indicator functions. An indicator designed to quickly test trading concepts and visualize the effectiveness of different input parameters. An all-in-one sandbox for testing everything from simple crossovers to complex, multi-condition trading systems.
        Boom and Crash Trend Detector is a  Non-Repaint   MT5 trading system usually being sold for 50 0$ . Most people use this for Deriv but can be used to forex too. The boom and crash spike indicator is a spike detecting software, with Multiple features, these features include. Spike Alert ( from 10 to 100-second warning before spike) Continues spike Alert (for double or continuous spikes at a time) supports all Boom/crash Indices M6 time frame works best here . Bigger time frame trend pointer for
        Elliott Wave Trend MT5
        Young Ho Seo
        4 (3)
        Elliott Wave Trend was designed for the scientific wave counting. This tool focuses to get rid of the vagueness of the classic Elliott Wave Counting using the guideline from the template and pattern approach. In doing so, firstly Elliott Wave Trend offers the template for your wave counting. Secondly, it offers Wave Structural Score to assist to identify accurate wave formation. It offers both impulse wave Structural Score and corrective wave Structure Score. Structural Score is the rating to sh
        2025 Spike Killer Dashboard - Advanced Trading Signals & Market Analytics Transform Your Trading with Intelligent Market Insights! The 2025 Spike Killer Dashboard is a powerful MQL5 indicator that combines cutting-edge signal generation with an intuitive crystal dashboard for real-time market analysis. Designed for traders who demand precision and clarity, this all-in-one tool delivers actionable signals and comprehensive market metrics at a glance. Key Features: Dual Signal System Shved S
        TPA True Price Action indicator reveals the true price action of the market makers through 100% non-repainting signals strictly at the close of a candle! TPA shows entries and re-entries, every time the bulls are definitely stronger than the bears and vice versa. Not to confuse with red/green candles. The shift of power gets confirmed at the earliest stage and is ONE exit strategy of several. There are available now two free parts of the TPA User Guide for our customers. The first "The Basics"
        Elliot Waves Analyzer Pro
        Viktor Weidenthal
        2.67 (3)
        Elliot Waves Analyzer Pro calculates Elliot Waves to Help Identify Trend direction and Entry Levels. Mainly for Swing Trading Strategies. Usually one would open a Position in trend direction for Wave 3 or a Correction for Wave C . This Indicator draws Target Levels for the current and next wave. Most important Rules for Elliot Wave Analysis are verified by the Indicator.  The Pro version analyzes Multiple Timeframes and shows the Subwaves and Target-Levels.   For an Overview  " Elliot Waves Anal
        VTrende Pro
        Andrii Diachenko
        5 (1)
        VTrende Pro - MTF indicator for trend trading with a display panel for MT5 *** Videos can be translated into any language using subtitles (video language - Russian) Although the signals of the VTrende Pro indicator can be used as signals of a full-fledged trading system, it is recommended to use them in conjunction with the Bill Williams TS. VTrende Pro is an extended version of the VTrende indicator. Difference between Pro version and VTrende: - Time zones - Signal V - signal 1-2 waves -    S
        WVAP Scalping
        Domantas Juodenis
        Ctrader version available  https://ctrader.com/products/1943   WVAP Scalping Pro – The Ultimate Professional Trading System Revolutionary VWAP + Market Profile Technology for Serious Traders Stop trading blind. WVAP Scalping Pro delivers the most advanced Volume-Weighted Average Price system on MQL5 , combining institutional-grade market profile, triple VWAP confluence, and a professional trading dashboard — all in one powerful tool. This isn’t just another indicator. It’s a complete trading e
        MatadorGate
        Metin Erkamoglu
        MATADOR Signal Suite — Quant Pro v3.57 (Indicator) Signal-only   •   Chart Overlay + Alerts   (Popup/Push/JSON) •   SMC+   (OB/FVG/BOS) +   PA   +   HTF EMA   •   M1 - M5 XAUUSD, EURUSD ...   focused, multi-symbol ready MATADOR_v3_57_User_Manual_Multilingual & Strategy Tester  https://drive.google.com/drive/folders/1fnR-uAx6GnoDai5YnYMwF5WIvsHlE39j?usp=sharing What is it? MATADOR is a   multi-layer signal indicator   with institutional-grade filtering. It does   not   open trades; instead it dr
        Transaction Speed MT5
        Ivan Stefanov
        5 (2)
        当然,以下是翻译成中文(简体)的版本: 该指标标出市场中显现出 交易兴趣 的区域,并随后显示 订单积累区域 。它的工作方式类似于大规模的订单簿。 这是为 大资金 打造的指标,性能卓越。市场中有任何兴趣,你都能通过它清晰看到。 (这是一个 完全重写的自动化版本 —— 不再需要手动分析。) 交易速度 是一个全新的概念指标,它显示了市场上大订单 何时 、 何地 聚集,并揭示了其背后的意义。它可以在 非常早期 就检测到趋势的变化。 在外汇市场,所谓的“交易量”实际上是误导性的,因为那指的是价格在单位时间内的变化,因此真正的名称应是“交易速度”。 一切都取决于我们如何思考、如何行动、如何分析。 改变分析范式至关重要。 该指标完全重构了外汇市场上“交易量”的概念,用逻辑方式重新定义并应用,从而成为一个 独特而精准的工具 。 使用方法: 默认情况下,指标处于 自动模式 ,可独立用于任何时间周期。如果你希望切换到手动模式,只需点击 Auto / Manual Mode 按钮即可。 在 手动模式 下,所有计算从 2025年1月1日 开始。你可以根据需要更改该日期,以查看不同的分析结果。 最优数据周期
        Enigmera MT5
        Ivan Stefanov
        3.67 (3)
        ENIGMERA:市场核心 引言 该指标及交易系统为金融市场提供了一种卓越的方法。ENIGMERA 利用分形周期精确计算支撑位和阻力位,展示真实的积累阶段,并给出方向和目标——无论处于趋势还是回调,系统均能正常运行。 如何工作 指标的大部分功能由图表左侧的按钮控制,可快速应对不同的市场状况。 按钮说明 ON/OFF – 显示或隐藏整个指标。 Support – 趋势的主支撑线。 Ch – 激活支撑通道,标示可接受的偏差范围。 Dev1(第一偏差) – 显示价格在支撑偏差范围内的运动,表明市场盘整或力量积累。 Dev2(第二偏差) – 显示价格在偏差之间的运动,表明趋势正在形成及其方向。 Dev3(第三偏差) – 指示趋势显著加速和高波动性。 45deg(45度) – 显示市场节奏和相对于45线的运动稳定性。 Tgt(目标) – 趋势目标线,标示可平仓的位置。 Tgt Dev – 目标可能波动的通道范围。 Vol(成交量) – 在K线图上显示成交量点,标示市场成交量的显著变化。 X – 当价格到达目标线时显示“X”标记。 RandC(随机颜色) – 将指标线条和标签随机着色,以便更好地
        This indicator is based on the mathematics of the great trader W.D. Ganna. With its help, you can easily find strong levels by analyzing swings to find the optimal entry point. The indicator works on all instruments and all timeframes. The indicator is fully manual and has control buttons. All you need to do is press the NEW button, a segment will appear, which you can place on any movement, swing or even 1 candle that you want to analyze. By placing the segment, press the OK button. A grid (th
        IQ FX Gann Levels a precision trading indicator based on W.D. Gann’s square root methods. It plots real-time, non-repainting support and resistance levels to help traders confidently spot intraday and scalping opportunities with high accuracy. William Delbert Gann (W.D. Gann) was an exceptional market analyst, whose trading technique was based on a complex blend of mathematics, geometry, astrology, and ancient mathematics which proved to be extremely accurate. Download the   Metatrader 4 Version
        获取免费的 AUX 指标、EA 支持和完整指南,请访问 – https://www.mql5.com/en/blogs/post/763955 发现趋势。读取模式。把握入场时机。 三步只需30秒!轻松交易 — 无需分析,您的智能助手已准备好简化您的工作流程 不再因图表信息过载而困扰。 通过智能趋势偏向检测自信交易。 兼容所有货币、加密货币、股票、贵金属、指数及任意时间框架。 只需点击并执行 — 就这么简单。 非常适合希望快速清晰交易的忙碌交易者。 TPTSyncX 是一款强大的全能 MetaTrader 5 指标,可无缝同步 趋势、图形模式 与 K线触发 分析,并以清晰智能的可视化系统呈现。专为追求清晰度、精确性和速度的交易者设计,它通过结合价格行为、结构模式和市场时机工具,帮助识别高概率交易机会。 主要功能: 智能可视化显示: 自动绘制价格结构模式,并清晰标注高点高 (HH)、低点高 (HL)、高点低 (LH) 与低点低 (LL) 于图表上 — 实时展现市场结构变化与潜在反转区域,对识别趋势转换与价格突破至关重要。 动态移动平均线: 根据所选目标K线范围自动调整周期,适用于短线剥
        The indicator is designed to work on any trading platform. The program is based on proprietary algorithms and W.D.Ganna's mathematics, allowing you to calculate target levels of price movement based on three points with the highest degree of certainty. It is a great tool for stock trading. The indicator has three buttons: NEW - call up a triangle for calculation. DEL - delete the selected triangle. DELS - completely remove all constructions. The probability of achieving the goals is more than 80
        Introducing the South African Sniper indicator created by a small group of traders with a few years trading trading the financial market profitably . This is a plug and play indicator that provides you with  BUY and SELL (SNIPER ENTRY) signals with TARGET and trail stops. The indicator Works with all MT5 trading instruments. The indicator uses previous  chart data as receipt to speculate on future market moves.  "The South African Sniper indicator community are very happy with the indicator and
        MonetTrend
        Aliya Bolek
        MonetTrend — Премиум-индикатор для торговли по тренду (M30, H1, H4) MonetTrend — это мощный и визуально понятный трендовый индикатор, созданный для торговли на таймфреймах M30, H1 и H4. Он идеально подходит для работы с волатильными инструментами, такими как: • Золото (XAUUSD) • Криптовалюты (BTCUSD) • Валютные пары (EURUSD, USDJPY и др.) Ключевые особенности MonetTrend: • Автоматическое отображение Take Profit 1 (TP1) и Stop Loss (SL): После появления сигнала индикатор сразу показывает: • TP
        作者的更多信息
        MR Reversal Patterns 4
        Sergey Khramchenkov
        5 (2)
        In the "Masters of Risk" trading system, one of the main concepts is related to places where markets change direction. In fact, this is a change in priority and a violation of the trend structure at the extremes of the market, where supposedly there are or would be stop-losses of "smart" participants who are outside the boundaries of the accumulation of volume. For this reason, we call them "Reversal Patterns" - places with a lot of weight for the start of a new and strong trend. Some of the imp
        "Sentiments of traders" in the financial markets is a topic that has been of interest to us for a long time. In time, we could not find the right formula to define these sentiments. We went through many stages in the search for the right methodology - from taking data from external sources to calculate open positions of buyers and sellers to calculating tick volumes, but still we were not satisfied with the results. The calculation of open positions of buyers and sellers from external sources ha
        MR Range Breakouts 4
        Sergey Khramchenkov
        5 (1)
        " A trading range occurs when a financial instrument trades between constant high and low prices over a period of time. The upper part of the trading range of a financial instrument often provides price resistance, while the lower part of the trading range usually offers price support.  Traders can enter in the direction of a breakout or breakdown from a trading range... " This is the "Classical Theory" understanding of ranges. We have a different understanding of the nature of ranges and the
        MR Trend Corrections 4
        Sergey Khramchenkov
        We publish the indicator as a useful tool in trading and call this indicator the "Swiss Army Knife" because it provides many possibilities and combinations to help understand the material on the "Masters of Risk" trading system. The indicator itself is not part of the tools used in the "Masters of Risk" trading system. The indicator consists of 3 separate multi-timeframe indicators, which in combination with each other help to reduce the "noise" of false signals. The first of the indicators are
        A "Volume Profile" is an advanced charting indicator that displays total volume traded at every price level over a user specified time period. The main components of the volume profile are POC ( Point Of Control - the price level, at which the maximum number of contracts were executed during a selected period), VAH ( Value Area High - the highest price in the Value Area) and VAL ( Value Area Low - the lowest price in the Value Area). When we settled on the original indicator, we spent a lot of
        MR Volume POC Levels 4
        Sergey Khramchenkov
        5 (3)
        The most crucial price level in any "Volume Profile" is the "Point of Control" . Is the price level with the highest traded volume. And mainly, is the level where the big guys start there their positions, so it's an accumulation/distribution level for smart money. The idea of the indicator arose after the "MR Volume Profile Rectangles" indicator was made. When creating the "MR Volume Profile Rectangles" indicator, we spent a lot of time comparing the volumes with those from the volume profile
        MR Dynamic POC 4
        Sergey Khramchenkov
        The most crucial price level in any "Volume Profile" is the "Point of Control" . Is the price level with the highest traded volume. And mainly, is the level where the big guys start there their positions, so it's an accumulation/distribution level for smart money. The idea of the indicator arose after the "MR Volume Profile Rectangles" indicator was made. When creating the "MR Volume Profile Rectangles" indicator, we spent a lot of time comparing the volumes with those from the volume profile
        MR Reversal Patterns 5
        Sergey Khramchenkov
        5 (2)
        In the "Masters of Risk" trading system, one of the main concepts is related to places where markets change direction. In fact, this is a change in priority and a violation of the trend structure at the extremes of the market, where supposedly there are or would be stop-losses of "smart" participants who are outside the boundaries of the accumulation of volume. For this reason, we call them "Reversal Patterns" - places with a lot of weight for the start of a new and strong trend. Some of the imp
        MR Range Breakouts 5
        Sergey Khramchenkov
        5 (2)
        " A trading range occurs when a financial instrument trades between constant high and low prices over a period of time. The upper part of the trading range of a financial instrument often provides price resistance, while the lower part of the trading range usually offers price support.  Traders can enter in the direction of a breakout or breakdown from a trading range... " This is the "Classical Theory" understanding of ranges. We have a different understanding of the nature of ranges and the
        MR Volume POC Levels 5
        Sergey Khramchenkov
        The most crucial price level in any "Volume Profile" is the "Point of Control" . Is the price level with the highest traded volume. And mainly, is the level where the big guys start there their positions, so it's an accumulation/distribution level for smart money. The idea of the indicator arose after the "MR Volume Profile Rectangles" indicator was made. When creating the "MR Volume Profile Rectangles" indicator, we spent a lot of time comparing the volumes with those from the volume profile
        A "Volume Profile" is an advanced charting indicator that displays total volume traded at every price level over a user specified time period. The main components of the volume profile are POC ( Point Of Control - the price level, at which the maximum number of contracts were executed during a selected period), VAH ( Value Area High - the highest price in the Value Area) and VAL ( Value Area Low - the lowest price in the Value Area). When we settled on the original indicator, we spent a lot of
        MR Dynamic POC 5
        Sergey Khramchenkov
        The most crucial price level in any "Volume Profile" is the "Point of Control" . Is the price level with the highest traded volume. And mainly, is the level where the big guys start there their positions, so it's an accumulation/distribution level for smart money. The idea of the indicator arose after the "MR Volume Profile Rectangles" indicator was made. When creating the "MR Volume Profile Rectangles" indicator, we spent a lot of time comparing the volumes with those from the volume profile
        "Sentiments of traders" in the financial markets is a topic that has been of interest to us for a long time. In time, we could not find the right formula to define these sentiments. We went through many stages in the search for the right methodology - from taking data from external sources to calculate open positions of buyers and sellers to calculating tick volumes, but still we were not satisfied with the results. The calculation of open positions of buyers and sellers from external sources ha
        筛选:
        无评论
        回复评论