Bstrend indicator

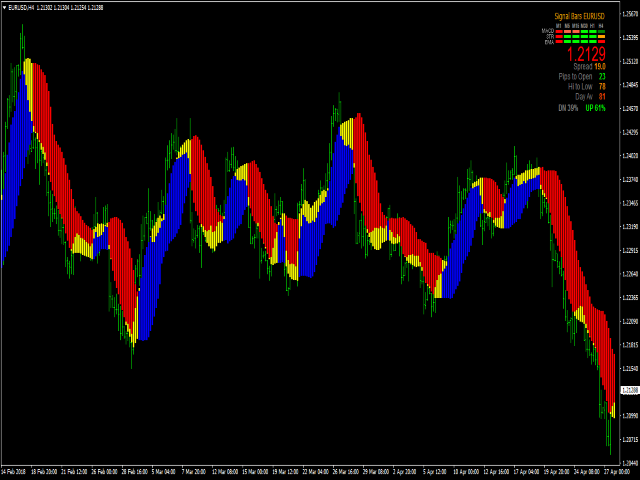
he idea behind its very simple,

We combine the long / short strategy from ichimoku , like cross between lines and below/above cloud together with histogram from MACD for positive/negative level. We use the same criteria for TSI and CMF , to check if its above or below 0 level.
Based on that we have a long or a short entry. The exit happens when the next options triggers, like for example we had long signal, we exit when we receive the short signal and viceversa.


It can be adapted with a risk management to apply a tp/sl level.


推荐产品
Smc Macd
Yutthaphong Hanphayom
SMC MACD – 市场结构与动能分析指标 概述 SMC MACD 是一款技术指标,旨在基于 MACD 动能逻辑 支持 市场结构分析 ,并符合 Smart Money Concept(SMC)理念。 该指标帮助交易者以清晰、简化的方式观察 关键结构区域附近的结构变化和动能行为 。 它被构建为一种 分析与确认工具 ,而非自动交易系统。 核心概念 SMC MACD 专注于在降低图表噪音的同时,提供 清晰的结构化市场背景 。 MACD 动能逻辑 已在指标内部集成 ,用于辅助结构解读。 图表上 不需要额外加载 MACD 指标 。 该指标设计为与以下内容配合使用: 价格行为分析 高时间周期结构 用户自定义确认规则 工作原理 该指标遵循一个确定性的工作流程: 在初始化或时间周期切换时重建市场结构 (基于 MACD 动能推导的 Swing High / Swing Low) 检测 最后一次确认的结构突破(BOS / CHOCH) 确定 市场方向(UP / DOWN) 测量当前有效的结构区间 根据结构方向识别 Premium 和 Discount 区域 该流程为 自主交易规划 提供了一个上下文分析
Free Lotus
Christophe Godart
Due to the huge success of the limited free version, the now low priced LOTUS version will continue being updated in the future. Optimal for Binary Options and Forex. For beginners and intermediates. Lotus is 100% non repaint. The strategy is based on 4 ADX parameters, including pivot points and candle patterns.  It is recommendable to combine the arrow with an moving average, Elliot waves indicator or Parabolic SAR. The main goal was to  keep it as simple as possible ! No useless oscillators.
MACD with two lines and  bar, Predict the price,  moniotr all period,  play sound when it changed. If there is any other need, contact me. MACD = [stockPrices,12]EMA - [stockPrices,26]EMA signal = [MACD,9]EMA divergence = MACD – signal User Inputs Fast EMA Period - Fast moving average line, the default period is 12. Slow EMA Period- Slow moving average line, the default period is 26. Signal SMA Period - set signal period , the default period is 9.
This Indicator is use the ZigZag to calculate the Upper and  Lower Bound and the uptrend and the downtrned. Red for downtrend, Green for uptrend and Yellow is for the horizontal trend this horizontal trend also bookmarked the upper limited and the lower limited the the price swings.  Or in simple the Support and the Resistance level. However, You may use the Heikin Ashi to confirm the trend of the buy sell signal above. I cannot guarantee the win rate, Nevertheless, you must study well the timef
Scalping worm
Andrey Kozak
Scalping Worm is an essential tool for every trader aiming to improve the accuracy of their market entries and exits. With its advanced weighted moving average formula and adaptive smoothing logic, this indicator not only captures the current trend direction but also helps determine its strength and stability. The blue line signals an uptrend, while the red line indicates a downtrend, making analysis highly intuitive and visually straightforward. The main advantage of this indicator is its abili
Scalp88
Andrey Kozak
Scalp88 — 适用于 XAUUSD(M1)的多周期 MTF 剥头皮指标 Scalp88 是一款面向 MetaTrader 4 的专业剥头皮(Scalping)指标,专为 M1(1分钟) 的快速行情读取与顺势交易而设计。该指标融合了 动态趋势逻辑 、 ATR 波动率归一化 与 多周期一致性确认(MTF) ,以直观的箭头信号与强度百分比面板呈现交易方向与机会。 要了解如何购买该指标,请点击此链接: https://www.mql5.com/zh/articles/498 图表上你会看到什么 蓝色箭头(BUY) —— 买入信号 / 多头入场提示 红色箭头(SELL) —— 卖出信号 / 空头入场提示 趋势线(Up/Down) —— 动态趋势结构与趋势阶段切换的可视化 右上角 MTF 面板 : 显示主导方向 BUY/SELL 显示 信号强度百分比 (基于多周期信号一致性) 可选显示各周期细节(M1…W1) 工作原理(技术概述,不公开代码细节) Scalp88 采用 多层信号架构 ,每一层都用于提升过滤质量与信号稳定性: 趋势核心(Trend Core) 指标在设定周期内对局部极值(Hi
Serpent
Volodymyr Hrybachov
The strategy is based on the MACD and Moving Average indicators. It buys when the fast MA is above the slow MA and the MACD histogram is above the signal line. It sells when the fast MA is below the slow MA and the MACD histogram is below the signal line. Designed for 4 and 5-digit quotes, use it on a VPS hosting. Launching the EA It is recommended to launch the EA on several adjacent currency pairs with the same magical numbers. For example: GBP USD , EUR USD , AUD USD , NZD USD ; or USD CAD, U
The Revolution Target Achiever FT -  Auto_Setting 1000 Points  Hi all Investors and traders, We've just updated this EA to a new version 3.0, which has a much more benefits , for Investors who want to run this EA 24 hours using vps can try the Auto_Setting to achieved 1000 Points or 10 %, for traders who have their own set up and target 1-100% can use the manual_setting, THE REVOLUTION Target Achiever is suitable for the investor who want to have a simple and ready to use Expert Advisor (EA). Th
Cloud Stair
Sutthichai Mungdee
Cloud Stair is an Indicator has 2 Cloud (Up Trend and Down Trend). Cloud will turn Red when trend go down. Cloud will turn Blue when trend go up. You can use this indicator as a Support and Resistance level. Trend very strong when there are no opposite side. Open Buy position when the indicator show blue cloud and no red cloud. Open Sell position when the indicator show red cloud and no blue cloud.
A simplistic indicator informing a user on RSI divergence by sending messages to mobile device and email. The indicator draws 2 vertical lines, marking two RSI extrema that formed the divergence. You get the alert, open the charts and make a decision. The indicator does not show past divergences, thus when you attach it to a chart for the first time you see nothing. Graphics and alerts will appear as soon as divergences do. Drop it in Tester to see how it works. Parameters: RSIPeriod - number of
Ruby Scalper EA MT4
Telio Ivan Ezequiel Macie
5 (1)
# Ruby Scalper EA – Automated Trading Robot Ruby Scalper EA is designed for traders who want an automated tool that follows structured trading rules with speed and precision. The system applies a multi-timeframe confirmation process, where entries are aligned across different timeframes for additional confluence. It can be applied to multiple markets, though it has been most frequently used on **Gold (XAU/USD)** on the 1-minute chart with the default settings. --- ### Key Features * **Multi
Trend Indicator This Indicator detects the essential momentum in the market and lets you know when the market has a potential trend Green means we are going higher and Red Means we are going Lower,  You can customise the Line to Any Color.  The alerts come in immediately there is a potential signal Defaults Length : 55 This is the Depth of your averaging calculation. The bigger it is the more noise is filtered.  55 Is the Best Optimum Setting For This Indicator
介绍二元智能系统:您的终极交易伴侣 二元智能系统不仅仅是一个指标,它是一个精心设计的复杂交易工具,为交易者提供精确的交易信号和市场洞察。该系统建立在先进的算法和广泛的技术指标基础上,是您解锁交易成功的关键。 指标组件: 移动平均百分比(MAP):   该组件计算多个移动平均线的加权平均值,为趋势识别提供强大的基础。MAP会根据市场条件动态调整,提供有关当前趋势方向的见解。 商品通道指标(CCI):   CCI通过分析价格偏离平均值来衡量超买和超卖情况。二元智能系统的CCI集成确保了从整体上识别潜在的反转点。 移动平均线收敛/发散(MACD):   系统中的MACD组件超越了简单的价格交叉。它评估MACD线和信号线的收敛和发散,揭示隐藏的交易机会并确认趋势强度。 平均方向指数(ADX):   使用ADX,二元智能系统量化趋势动量。它可以准确地识别强劲的趋势并帮助您避免弱势、不确定的市场阶段,从而增强您的交易决策。 多空力量:   通过这些指标,可以利用多空情绪的综合力量。这对市场情绪的全面了解有助于进行明智的交易入场。 随机指标:   二元智能系统中的随机指标有助于识别超买和超卖情况,并
这是一套原创的、敏捷型、极佳趋势系统。无论您是刚入门的交易新手还是专业级的交易人士,这套指标均可助您快捷及时的追踪市场趋势的最新变化。它具有以下特点: 使用方法极简单,即插即用,且所有趋势分析结果的显示方式一目了然 ; 不需配置 任何功能参数 ,趋势追踪指标将根据市场数据自动分析显示日/周/月级别的趋势大方向; 本日,本周及当前月度的趋势信息同时显示在同一个图表窗口中; 不依赖于任何其他传统/经典指标的数据 ; 支持 MT平台的 所有交易品种; 支持5分钟到日线的各级图表(MT5平台用户没有任何限制); 这套指标 采用特有的市场行为分析算法,以不同于传统趋势分析方法的维度,快速辨识即将形成的趋势。因此您 可以将本指标结合任何其他经典分析方法一起使用,从多方角度衡量您的交易决策。
Blizzard Adaptive
Sergey Likho
5 (1)
Trend indicator based on a combination of moving averages. Symbols : BTCUSD, GBJPJPY, GOLD, GBPUSD Timframes M5-H4 The main advantage: an additional algorithm of auto-optimization. The indicator can adjust its parameters for any financial instrument and any timeframe. During auto-optimization, the indicator calculates tens of thousands of combinations and finds the one that gives the best series of profitable trades. The best parameters are set by default Indicator settings can be chang
訂閱指標注意事項 此信號只支援電腦版MT4 不支援MT5、手機、平板 指標只顯示當日進場箭頭 非直播指標顯示歷史箭頭 (直播為展示用) 指標為交易輔助性質 非EA自動交易 無跟單功能 指標只標示進場位置 無出場(止盈)指示 進場止損點位設定30-50 PIPS 或是前高前低做為防守 止損不需拉太遠 紅色箭頭為多方進場訊號 綠色箭頭為空方進場訊號 撐阻力強度用箭頭大小表示 此指標適用於波段策略 不適合當沖策略盤整 多空反轉時不適用 指標載入後 右下角都會預設顯示盤整 載入指標一小時後 才會顯示多空 加入Youtube頻道會員 可參加每個月一次實體抽獎活動(台灣以外地區,獎品折現金用Paypal匯出) 每月抽獎時間為非農數據公布當週的週末盤勢分析(2100) 得獎者必須抽獎時在線上,逾期不候
Insight Investor: Advanced Multi-Currency Forex Trading Bot Introduction In the fast-paced world of Forex trading, having the right tools can significantly enhance your trading experience. Insight Investor is an advanced multi-currency trading bot designed to automate and optimize your trading operations. This expert advisor employs modern algorithms to analyze market conditions and execute trades, aiming to deliver consistent results while maintaining controlled risk levels. Key Features of Ins
This indicator allows you to see the strength of the trend on all timeframes. It can be used for all currency pairs. The indicator can be displayed in the form of a column (from left to right): status buy / sell / strong buy / strong sell, strength of the trend in percentage, pips last candle, body candle now, remaining time, and the timeframe of M1 to MN. Information contained below (from left to right): total trend percent, sell percent, buy percent.
Impulse fractals indicator - is counter-trend oriented complex market fractal pattern.  Market creates bull/bear impulse, trend starts, fractals on impulsed wave are an agressive pullback signals. Buy arrow is plotted when market is bearish and it's impulse showed up-side fractal, and sell arrow is plotted when market is bullish and it's impulse showed dn-side fractal. Main indicator's adjustable inputs : impulsePeriod - main period of impulse histogram  filterPeriod  - smoothes impulse accordi
" MACD crossover " is a new version of the oscillator indicator. " MACD crossover " draws a red or blue line on the chart. When the line is blue, it means that the MACD indicator is above zero. If the line on the chart is red, it means that the MACD indicator is below zero. Thus, this indicator helps traders determine the MACD position visually on the chart. This information will be especially useful when trading scalping. You can combine this indicator and trend indicators on the chart. If thi
Market Structure Zig Zag
Lesedi Oliver Seilane
4.66 (29)
Free Market structure zig zag to assist in price action trading the screenshots describe how to use and how to spot patterns new version comes with alerts, email alert and  push notification alert can be used on all pairs  can be used on all timeframes  you can add additional confirmation indicators the indicator shows you your higher high and low highs as well as your lower lows and lower highs  the indication makes price action analysis easier to spot.
FREE
RSI Divegence Win Pro  The RSI Drivergent is the best indicator for looking for price reversals. RSI Drivergent Win Pro has used the strengths and best points of RSI to create in a format for traders to understand more easily. Suitable for beginners and professional traders. Case Up Trend : Blue line is below Yellow line. Case Down Trend : Blue line is abve Yellow line. Usage is very easy. 1. Import the indicator into the MT4 chart. 2. Defind Overbought positions and defind oversold positi
Precision Buy Sell Arrows
Muhammad Shariyar Bukhari
Product Description: Buy Sell Arrow Indicator for MT4 Elevate your trading to new heights with the Buy Sell Arrow Indicator for MT4 , a cutting-edge tool crafted to pinpoint high-probability trading opportunities based on advanced candlestick patterns. Tailored for forex traders, especially those targeting GOLD on the 5-minute chart, this MT4 indicator delivers exceptional accuracy with an impressive 85% win rate , empowering you to seize profitable trades with unwavering confidence. Key Fea
Scalper Mars
Igor Bulgakov
3.5 (4)
Scalper Mars EA uses intraday scalping strategy. The Expert Advisor uses standard indicators MACD, RSI, EMA in its trading, does not use martingale and an order grid. A stop order is placed near local extrema, if it does not exceed the maximum value specified by the MaxStopLoss parameter. The EA uses take profit equal to the stop. The Expert Advisor is influenced by news releases. Requirements Recommended for work on the M1 timeframe. It can be traded on any currency pairs, when calculating resu
FREE
TPM cross indicator MT4
Ekaterina Saltykova
TPM Cross (trend power moving cross) - is a trend following strategy based on custom signal points. Indicator consists from main custom moving chart line and trend power line. Indicator defines up and down movements by it's trend power and custom moving direction. When current market's trend looses it's power and opposite trend starts - power trend line  crosses moving and indicator plots an arrow.  Main indicator's adjustable inputs : movingPeriod - period of moving line  trendPeriod  - period
CCI Jurik
Augustine Kamatu
Introducing CCI Jurik—a dynamic indicator designed to elevate your forex trading experience by integrating custom moving averages based on the Commodity Channel Index (CCI) with the MetaTrader 4 indicator, CCI. Jurik moving averages are renowned for their accuracy and reliability in analyzing price movements in the forex market. They offer traders a smoother representation of price action, reducing noise and providing clearer signals for identifying trends and potential reversals. The Commodi
FREE
Introduction to Fractal Pattern Scanner Fractal Indicator refers to the technical indicator that makes use of the fractal geometry found in the financial market. Fractal Pattern Scanner is the advanced Fractal Indicator that brings the latest trading technology after the extensive research and development work in the fractal geometry in the financial market. The most important feature in Fractal Pattern Scanner is the ability to measure the turning point probability as well as the trend probabi
About
Tatiana Savkevych
About - Forex indicator. This trend indicator is used to determine the current trend in price movement, making it clear in which direction it is better to open a position: buy or sell. The About trend indicator is displayed on the chart and moves in parallel with the price. The Forex About trend indicator allows you to determine in time a change in the direction of price movement, thereby minimizing the likelihood of capital loss. In trading practice, various combinations of About and other ind
Power Price Accion PMLE
Felipe Camargo Zamudio
This EA trades using the Heiken Ashi indicator. It perfectly measures the intensity of impulses, one of its main characteristics is to apply price action, it offers many configuration scenarios to measure the strength of a trend and flexible position management, precise inputs to follow the price, in addition to many functions Useful as customizable trading sessions, works for all pairs, especially for:  AUDCHF,AUDUSD,CADCHF,EURGBP,GBPAUD,GBPCHF,GBPJPY,NZDJPY,USDCHF,USDJPY,AUDJPY,CHFJPY,CADJPY •
Moving Pivot Average    The pivot indicator compares the selected period with its counterpart from the previous period. The indicator uses very flexible algorithm for pivot value calculating. It allows you to allocate in days a certain time intervals (custom bars) and calculate the average pivot value based on High, Low and Close prices of these bars. How many custom bars will be taken into account is determined by the "Days" setting. The pivot line can be considered an average trend line and us
该产品的买家也购买
Miraculous 指标 – 100% 不重绘的外汇和二元期权工具,基于江恩九方图 这个视频介绍的 Miraculous 指标 是一款专为外汇和二元期权交易者开发的高精度、强大交易工具。该指标的独特之处在于它建立在传奇的 江恩九方图 和 江恩振动法则 之上,使其成为现代交易中可用的最精确预测工具之一。 Miraculous 指标 完全不重绘 ,这意味着它的信号在 K 线收盘后不会改变或消失——你看到的就是你得到的。这为交易者提供了可靠且一致的基础,让他们能够自信地进出场交易。 主要特点: 基于江恩九方图和江恩理论构建 100% 不重绘的信号系统 适用于所有时间周期(M1、M5、H1、H4、日线、周线) 适用于外汇和二元期权交易 清晰的买卖信号,准确率高 可用于剥头皮、日内交易或波段交易 兼容大多数 MT4 平台 这款工具旨在帮助初学者和专业交易者做出更好、更明智的决策。无论您是交易货币、指数还是二元期权,Miraculous 指标都将为您在市场中提供所需的优势。
Meravith
Ivan Stefanov
5 (2)
做市商工具。 Meravith 将: 分析所有时间周期并显示当前正在运行的趋势。 标注流动性区域(成交量均衡区),即多头与空头成交量相等的位置。 在您的图表上直接显示来自不同时间周期的所有流动性水平。 生成并展示基于文本的市场分析供您参考。 根据当前趋势计算目标位、支撑位和止损位。 计算交易的风险回报比。 根据您的账户余额计算仓位大小,并估算潜在利润。 在市场出现重大变化时,Meravith 还会发出警告。 指标的主要线条: 多头/空头成交量衰竭线 —— 作为目标位使用。 趋势线 —— 指示市场趋势方向。根据市场是多头还是空头而改变颜色,并作为趋势支撑。其颜色主要反映市场情绪。 成交量均衡线(Eq)—— Eq(Volume Equilibrium)是系统的核心。它表示买卖双方成交量的平衡点,即市场流动性所在位置。向上突破 Eq 表示多头倾向,向下突破 Eq 表示空头倾向。突破后,应等待回调——当价格回到相反趋势的偏离线或衰竭线附近时。 使用方法:只需将其添加到图表中。 Meravith 可以分析一切——趋势和回调。 趋势线与某条成交量衰竭线之间的距离越大,说明该方向的成交量越高。 趋
Pulse Scalping Line - an indicator for identifying potential pivot points. Based on this indicator, you can build an effective Martingale system. According to our statistics, the indicator gives a maximum of 4 erroneous pivot points in a series. On average, these are 2 pivot points. That is, the indicator shows a reversal, it is erroneous. This means that the second signal of the indicator will be highly accurate. Based on this information, you can build a trading system based on the Martingale
Bomb Bank Signal
Igor Pereira Calil
5 (1)
炸彈銀行訊號:您對 MetaTrader 4 的信心指標 Bomb Bank Signal 是 MetaTrader 4 的一個強大指標,旨在識別金融市場中最相關的趨勢。如果您正在尋找一種能夠準確預測運動的工具,那麼炸彈庫就是您需要的盟友。 運作原理: 該指標結合了三種不同的方法——成交量分析、蠟燭收盤價和對稱趨勢——來偵測和發出買賣機會訊號。當炸彈銀行識別出買入機會時,它就像一顆「炸彈」;當它偵測到賣出訊號時,它就像一個「頭骨」。 為什麼炸彈銀行不一樣? 完全可靠性:炸彈庫訊號不會刪除訊號。訊號一旦發出,就會一直存在,確保您不會錯過任何機會。 極為準確:炸彈庫不會發出錯誤訊號。它會即時更新您的訊息,隨著市場的變化進行調整,但保持先前訊號的透明度。 即時更新:訊號被即時識別並在必要時更新,使您能夠快速響應市場變化。 最大化您的結果: 炸彈銀行訊號是識別趨勢持續走勢的理想選擇。例如,如果您已經做空並且指標在 M15 發出買入訊號,那麼現在就是平倉或部分下單的最佳時機,反之亦然。 此外,經過仔細分析,我們建議您遵循M30、H1和H4上的訊號,停損僅50點。這使得價格朝著有利
Dynamic Scalper System
Vitalyi Belyh
5 (1)
“ Dynamic Scalper System ”指标专为在趋势波内进行剥头皮交易而设计。 已在主要货币对和黄金上进行测试,并可与其他交易工具兼容。 提供顺势短线建仓信号,并提供额外的价格变动支持。 指标原理: 大箭头决定趋势方向。 在趋势波内,我们采用一种生成小箭头形式的剥头皮交易信号的算法。 红色箭头代表看涨方向,蓝色箭头代表看跌方向。 敏感的价格变动线会沿着趋势方向绘制,并与小箭头信号协同作用。 信号运作方式如下:当线在适当时刻出现时,将形成入场信号;在出现线时,持仓;线完成后,平仓。 建议的操作时间范围为M1 - H4。 箭头在当前K线上方形成,如果下一根K线已开仓,则不会重新绘制上一根K线上方的箭头。 输入参数 Trend Wave Period - 趋势方向(大箭头)的周期,改变趋势波的时间间隔。值 1 表示趋势方向的最长持续时间,参数值越大,持续时间越短。 Scalper Arrows Period - 信号箭头(小箭头)的计算周期,改变入场信号的生成频率。值 3 表示最频繁的生成频率,参数值越大,箭头频率越低,准确度越高。 这些参数可以根据不同的时间范
ConfluencePro v2.0 – 最强多重共振指标|二元期权 & 外汇专用 专业多过滤信号系统|内置智能仪表盘 + 新闻过滤 + 实时统计 ConfluencePro v2.0 是 MQL5 市场有史以来最先进的共振类指标。 它将 17+ 专业过滤器 (趋势、智能资金概念 SMC、市场结构、背离、多周期确认、高影响力新闻、成交量、市场状态检测等)整合成一个直观的 共振分数 0–100% 。 只有最高概率的形态才会出现箭头信号和警报。 完美适用于 二元期权(1–15分钟到期) 和 外汇短线/波段交易 。 核心功能 4种可选基础信号:ZigZag关键点(默认)、RSI交叉、Stochastic交叉、布林带触轨 17个专业过滤器 + 加权共振评分系统 智能仪表盘(实时胜率、连胜、每日盈亏、下一条新闻倒计时、市场状态) 完整视觉套件:箭头、确认点、结果标记(/)、价格标签、到期线 SMC可视化:公平价值缺口 FVG、BOS/CHoCH、订单块 Order Block 价格与RSI的隐藏背离 & 常规背离自动识别 市场状态检测(趋势 / 震荡 / 高波动) 多周期确认(H1/H4/D
介绍 F-16 飞机指标,这是一款领先的 MT4 工具,旨在革新您的交易体验。灵感来自于 F-16 战斗机无与伦比的速度和精准度,该指标结合了先进算法和尖端技术,在金融市场上提供卓越的性能。 通过 F-16 飞机指标,您将在竞争中腾飞,因为它提供实时分析并生成高度准确的交易信号。其动态功能旨在识别各种资产类别上的利润机会,让您能够自信地做出明智的决策。 配备用户友好的界面,F-16 飞机指标与热门的 MetaTrader 4 平台无缝集成,确保交易过程顺畅高效。无论您是初学者还是经验丰富的专业人士,该指标都可以轻松定制,以符合您独特的交易风格和偏好。 感受 F-16 飞机指标的威力,它以精确和敏捷的方式驾驭市场趋势。其先进的图表功能使您能够始终领先,检测关键的入场和出场点以实现最佳时机。掌控您的交易之旅,并凭借 F-16 飞机指标释放稳定盈利的潜力。 准备起飞,以这款出色的 MT4 指标将您的交易表现提升到新的高度。F-16 飞机指标是您在金融市场世界中的终极副驾驶员,让您以速度、精确度和自信取得成功。
每位购买 Scalping signals M1 指标的用户,都将免费获赠一款基于该指标信号自动交易的EA机器人。 Scalping signals M1 — M1趋势剥头皮完整进场系统 Scalping signals M1 将图表变成清晰的操作地图: 彩色趋势通道显示市场方向,箭头提示潜在进场点。 只需跟随通道方向和箭头即可,即使是新手也能轻松使用。 该指标在 M1 上表现最佳,也适用于几乎所有货币对,包括黄金(XAUUSD)、英镑、美元主要货币对和交叉盘。 内置弹窗提醒和电子邮件通知,确保您不会错过任何信号。 核心概念 Scalping signals M1 外观简单,但内部算法复杂。 视觉元素仅包括: – 趋势通道方向 – Buy/Sell 方向箭头 内部算法结合: – 线性回归趋势分析 – 自适应波动率通道 – 通道边缘的反转形态检测 – 振荡指标与趋势强度过滤 – 动态跟随市场节奏的参数调整 简而言之: 先确定趋势 → 等待价格回调至通道边缘并出现反转结构 → 箭头在符合条件时出现。 如何使用 将指标应用于图表(推荐 M1,可用于 M5 以上)。 根据通道判断趋势方向: –
BinaryIndicator
Andrey Spiridonov
BinaryIndicator is a highly accurate indicator for trading binary options. It shows excellent results in scalping. This indicator is based in multifactor analysis of trend indicators, as well as confirmation oscillators, which in the end gives an increased accuracy of signals. Advantages of the indicator Increased accuracy of signals. Excellent results when trading binary options with a short expiration time from M30 to M1 . It works on any timeframes. Works with any trade symbols. Parameters
Gold Channel XAUUSD
Paulo Rocha
5 (4)
Gold Channel is a volatility-based indicator, developed with a specific timing algorithm for the XAUUSD pair, which consists of finding possible corrections in the market. This indicator shows two outer lines, an inner line (retracement line) and an arrow sign, where the theory of the channel is to help identify overbought and oversold conditions in the market. The market price will generally fall between the boundaries of the channel. If prices touch or move outside the channel it is a tradi
Rtc ML Ai Predictor MT4
Muhammad Faisal Sagala
Rtc ML Ai | Predictor CORE MACHINE LEARNING ENGINE Adaptive ML Market Predictor – Multi-Bar Trend & Candle Forecast What This Indicator Does This indicator is a  real-time market prediction engine  designed to analyze price behavior and estimate  future market tendencies . Unlike conventional indicators, this system  does not rely on static parameters or historical curve-fitting , but adapts its internal state dynamically during live market operation. Instead of using static rules, the indic
The Hurricane Indicator
Paul Nicholas Clevett
5 (1)
Currently switched to the 4 hour chart - but use other time frames for confirmation. :-)  I change my main time frame based on the market movement at the time. The Hurricane Forex Indicator is a multi time frame indicator that includes such things as Trade Notifications, Trade Calculator, Momentum Indicator, risk reward and much more. We have a free Trade room for our users as well. Please check out the video for full details of how this indicator works as it has over 15 years worth of developme
FFx Engulfing Setup Alerter gives trade suggestions with Entry, Target 1, Target 2 and StopLoss. Below are the different options available: Entry suggestion - pips to be added over the break for the entry 3 different options to calculate the SL - by pips, by ATR multiplier or at the pattern High/Low 3 different options to calculate the 2 TPs - by pips, by ATR multiplier or at Risk/Reward Offset the dashboard - any place on the chart Remove the suggestion once the price reached the SL line Lines
FFx InsideBar Setup Alerter gives trade suggestions with Entry, Target 1, Target 2 and StopLoss. Below are the different options available: Entry suggestion - pips to be added over the break for the entry Minimum candle size - to avoid too close buy/sell entry suggestions 3 different options to calculate the SL - by pips, by ATR multiplier or at the pattern High/Low 3 different options to calculate the 2 TPs - by pips, by ATR multiplier or at Risk/Reward Offset the dashboard - any place on the c
FFx OutsideBar Setup Alerter gives trade suggestions with Entry, Target 1, Target 2 and StopLoss. Below are the different options available: Entry suggestion - pips to be added over the break for the entry. 3 different options to calculate the SL - by pips, by ATR multiplier or at the pattern High/Low. 3 different options to calculate the 2 TPs - by pips, by ATR multiplier or at Risk/Reward. Offset the dashboard - any place on the chart. Remove the suggestion once the price reached the SL line.
FFx PinBar Setup Alerter gives trade suggestions with Entry, Target 1, Target 2 and StopLoss. Below are the different options available: Entry suggestion - pips to be added over the break for the entry Minimum candle size - to avoid too small candles 3 different options to calculate the SL - by pips, by ATR multiplier or at the pattern High/Low 3 different options to calculate the 2 TPs - by pips, by ATR multiplier or at Risk/Reward Offset the dashboard - any place on the chart Remove the sugges
Lineverse Trendlines
Arkady Segal
5 (1)
Automatic, live & interactive picture of all trendlines. Assign push, email and sound alerts to the lines of your choice and be informed about price rollback, breakout, rollback after breakout, number of rollbacks, line expiration by double breakout. Correct, drag or delete the lines and interactively tune the line system. https://youtu.be/EJUo9pYiHFA . Chart examples https: //www.mql5.com/en/users/efficientforex Price Interaction Events All events are effective immediately and only after one
FFx MACD Divergences
Eric Venturi-Bloxs
The purpose of this new version of the MT4 standard indicator provided in your platform is to display in a sub-window multiple timeframes of the same indicator with its divergences. See the example shown in the picture below. But the display isn't like a simple MTF indicator. This is the real display of the indicator on its timeframe. Here's the options available in the FFx divergences indicator: Select the timeframes to be displayed (M1 to Monthly) Define the width (number of bars) for each tim
FFx RSI Divergences
Eric Venturi-Bloxs
The purpose of this new version of the MT4 standard indicator provided in your platform is to display in a sub-window multiple timeframes of the same indicator with its divergences. See the example shown in the picture below. But the display isn't like a simple MTF indicator. This is the real display of the indicator on its timeframe. Here's the options available in the FFx divergences indicator: Select the timeframes to be displayed (M1 to Monthly) Define the width (number of bars) for each tim
FFx CCI Divergences
Eric Venturi-Bloxs
The purpose of this new version of the MT4 standard indicator provided in your platform is to display in a sub-window multiple timeframes of the same indicator with its divergences. See the example shown in the picture below. But the display isn't like a simple MTF indicator. This is the real display of the indicator on its timeframe. Here's the options available in the FFx divergences indicator: Select the timeframes to be displayed (M1 to Monthly). Define the width (number of bars) for each ti
The FFx Dashboard MTF alerter will show you on a single chart all the timeframes (M1 to Monthly) with their own status for the indicator. 2 Alert Options: Single timeframe: each selected timeframe alert separately when a signal occurs Multi timeframes: all selected timeframes must agree for an alert to be triggered Both options have an input to select the timeframes to be used for the alert(s). How to Understand the Status: Green/Red square: histogram above/below 0 line Green square + Red bord
The FFx Dashboard MTF alerter will show you on a single chart all the timeframes (M1 to Monthly) with their own status for the indicator. 2 Alert Options: Single timeframe: each selected timeframe alert separately when a signal occurs Multi timeframes: all selected timeframes must agree for an alert to be triggered Both options have an input to select the timeframes to be used for the alert(s). How to understand the status: Green/Red square: RSI above/below 50 line Green square + Red border: R
The FFx Dashboard MTF alerter will show you on a single chart all the timeframes (M1 to Monthly) with their own status for the indicator. 2 Alert Options: Single timeframe: each selected timeframe alert separately when a signal occurs Multi timeframes: all selected timeframes must agree for an alert to be triggered Both options have an input to select the timeframes to be used for the alert(s). How to understand the status: Green/Red square: Stoch above/below 50 line Green square + Red border:
The FFx Dashboard MTF alerter will show you on a single chart all the timeframes (M1 to Monthly) with their own status for the indicator. 2 Alert Options: Single timeframe: each selected timeframe alert separately when a signal occurs Multi timeframes: all selected timeframes must agree for an alert to be triggered Both options have an input to select the timeframes to be used for the alert(s). How to understand the status: Green/Red square: Price above/below Cloud (Kumo) Green square + Red bo
The FFx Dashboard MTF alerter will show you on a single chart all the timeframes (M1 to Monthly) with their own status for the indicator. 2 Alert Options: Single timeframe: each selected timeframe alert separately when a signal occurs Multi timeframes: all selected timeframes must agree for an alert to be triggered Both options have an input to select the timeframes to be used for the alert(s). How to understand the status: Green/Red square: MA pointing Up/Down Green square + Red border: MA po
The FFx Dashboard MTF alerter will show you on a single chart all the timeframes (M1 to Monthly) with their own status for the indicator. 2 Alert Options: Single timeframe: each selected timeframe alert separately when a signal occurs. Multi timeframes: all selected timeframes must agree for an alert to be triggered. Both options have an input to select the timeframes to be used for the alert(s). How to understand the status: Green square: Price above PSAR Red square: Price below PSAR Options
The FFx Dashboard MTF alerter will show you on a single chart all the timeframes (M1 to Monthly) with their own status for the indicator. 2 Alert Options: Single timeframe: each selected timeframe alert separately when a signal occurs Multi timeframes: all selected timeframes must agree for an alert to be triggered Both options have an input to select the timeframes to be used for the alert(s). How to understand the status: Green/Red square: CCI above/below levels (ie. 100/-100) Grey square: C
The FFx Dashboard MTF alerter will show you on a single chart all the timeframes (M1 to Monthly) with their own status for the indicator. 2 Alert Options: Single timeframe: each selected timeframe alert separately when a signal occurs Multi timeframes: all selected timeframes must agree for an alert to be triggered Both options have an input to select the timeframes to be used for the alert(s). How to understand the status: Green/Red square: ADX above level Grey square: ADX below level Red bor
筛选:
无评论
回复评论