Pro Trend Lucem
- 指标
- 版本: 1.0
- 激活: 5

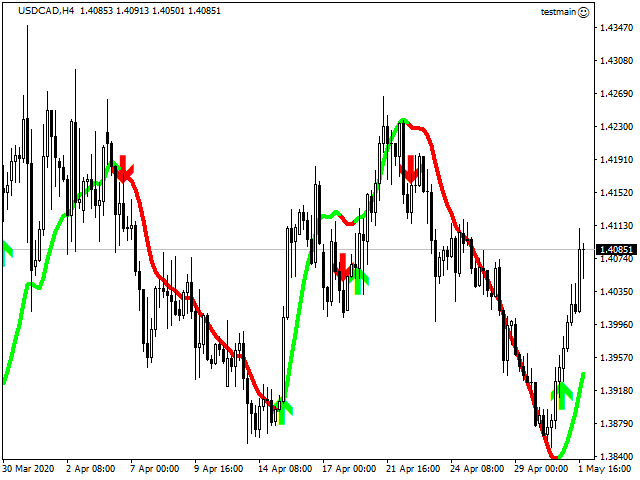
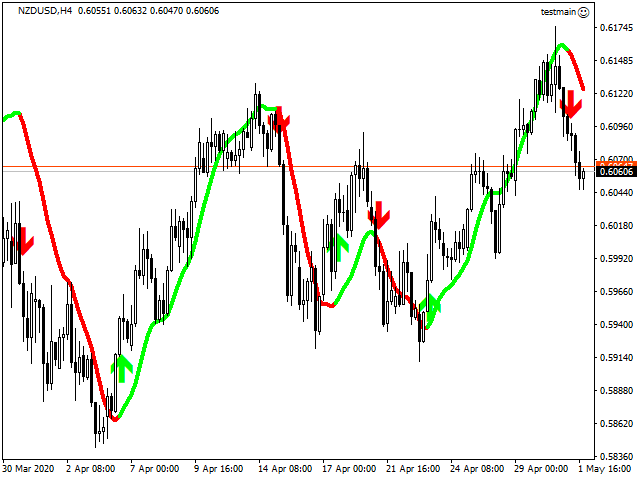
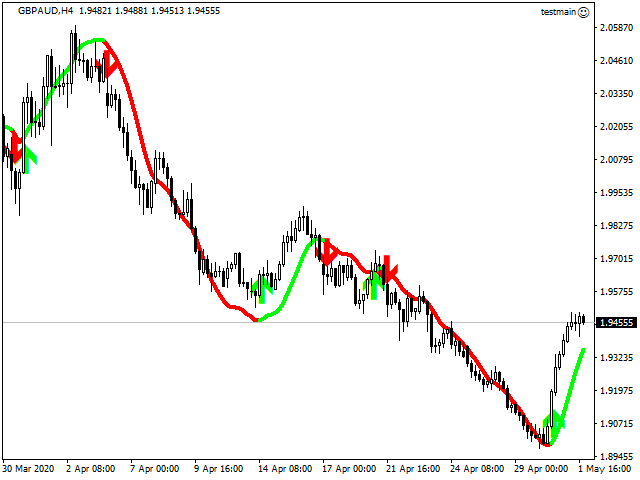
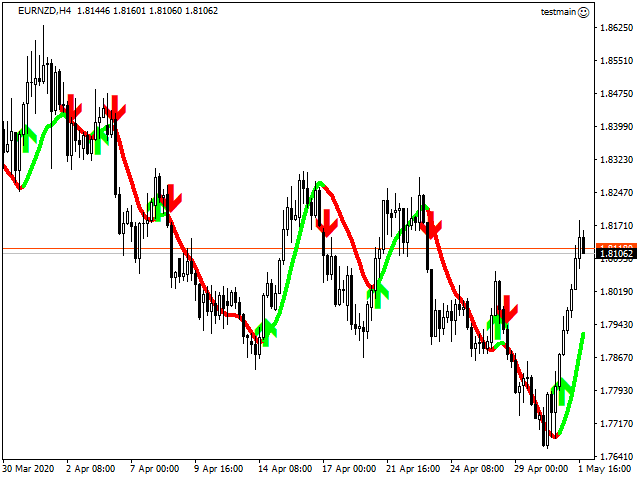
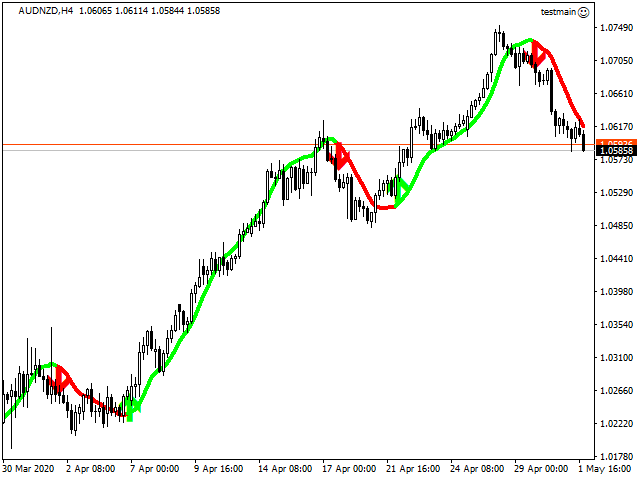
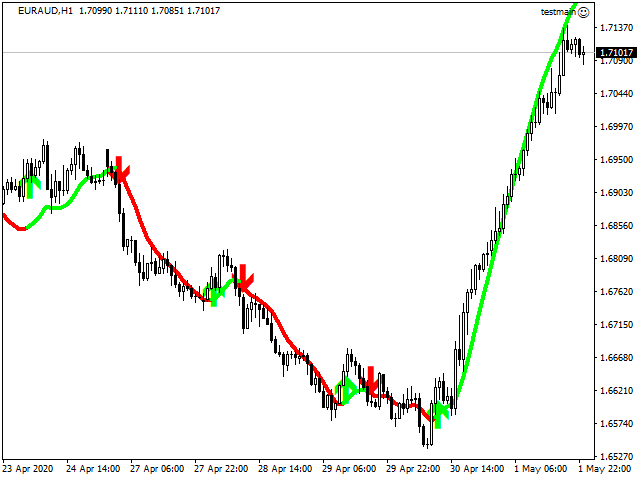
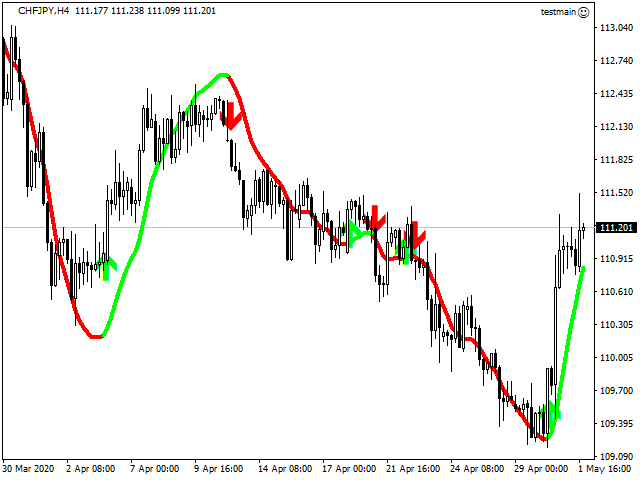
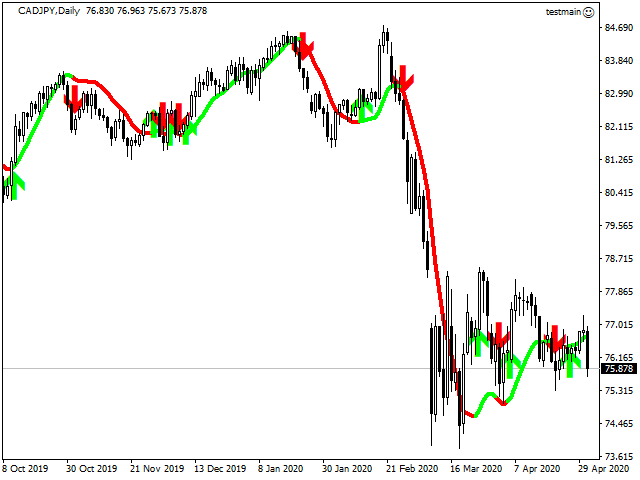
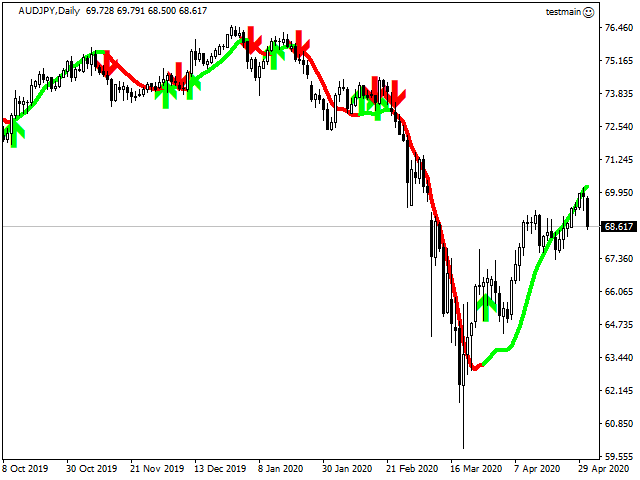
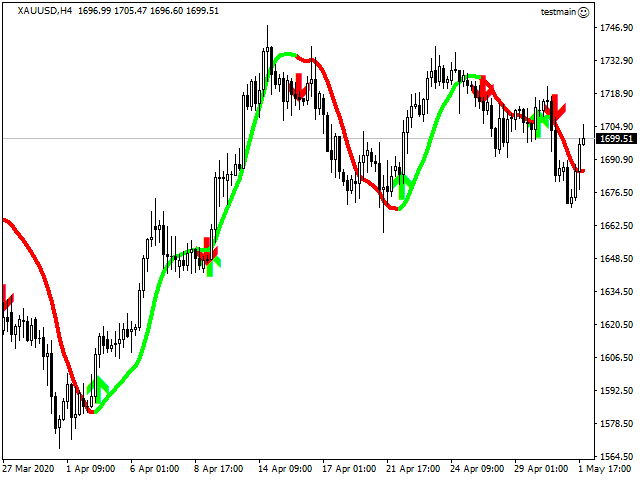
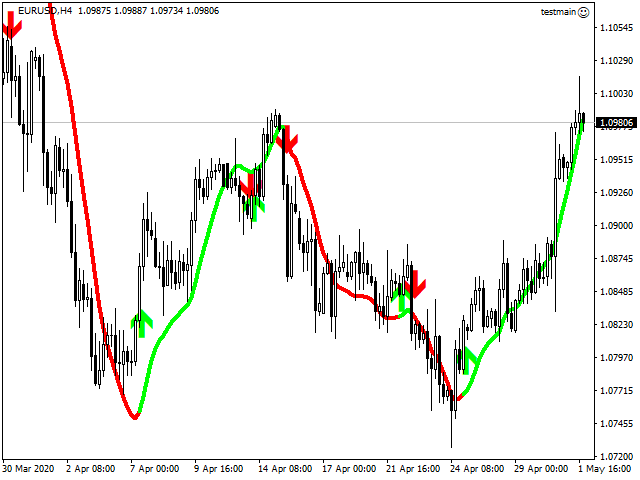
Trend Indicator
This Indicator detects the essential momentum in the market and lets you know when the market has a potential trend
Green
means we are going higher and Red Means we are going Lower,
You can customise the Line to Any Color.
The alerts come
in immediately there is a potential signal
Defaults Length : 55
This is the Depth of your averaging calculation. The bigger it is the more noise is filtered.
55 Is the
Best Optimum Setting For This Indicator