Fast VWAP

  • 指标
  • Jeffrey Lloyd Lauzon
    Jeffrey Lloyd Lauzon
    Welcome to themt4developer!
    I am a C++ systems programmer and specialized MQL4 developer focused on building professional-grade trading utilities, custom indicators, automated Expert Advisors, and advanced chart dashboards for MetaTrader.
  • 版本: 1.0
Fast VWAP  (Highly Optimized Intraday Dashboard)

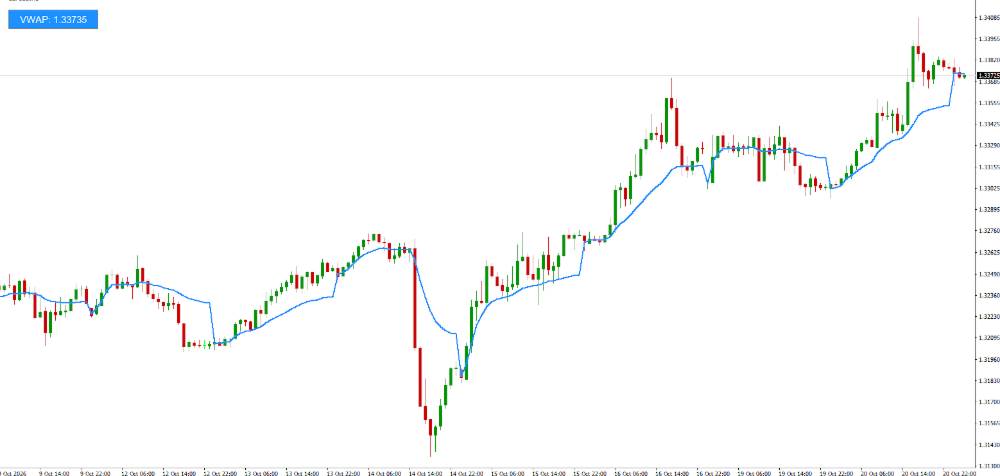
The Fast VWAP Matrix is an institutional-grade technical overlay designed to isolate volume-weighted fair value and intraday structural balance across active execution cycles. By processing price action dynamically through volume-weighting thresholds, this utility completely eliminates calculation delay and gives traders an instant visual panel of asset distribution on a single window.

Utilizing specialized single-pass memory arrays, this matrix tracks volume accumulation loops relative to selected session anchors. It transforms complex computational weight metrics into clean visual states, helping traders spot volume premium and discount zones long before standard moving averages react.

Core Technical Features
* True Multi-Period Anchor Reset: Simultaneously processes pricing calculations across Daily, Weekly, or Monthly session boundaries to match your structural strategy.
* Volume Fair Value Detection: Automatically flags institutional accumulation and dynamic support/resistance zones using tick volume distribution.
* Intuitive Color-Coded State Machine: Instantly adapts indicator buffer rendering to contrast flawlessly with the main chart workspace.
* Actionable Value Panel Output: Translates the final volume-weighted average price into an explicit numeric dashboard readout configured down to the fractional pip.
* Institutional Solid Workspace Panel: Includes a flat background container option that avoids overlapping UI artifacts and outlines your data cleanly on a sleek, modern layout.
* Zero Terminal Lag / High Performance Architecture: Engineered with an optimized single-pass linear O(N) loop execution that runs smoothly, completely avoiding terminal lag on Linux/Wine, VPS, or native Windows setups.

Interactive Status & Interpretation Logic
The dashboard tracks real-time data calculations and formats the active metric readout based on asset decimal precision automatically:
* Dynamic Line Plotting: Draws a chronological, volume-weighted fair value baseline directly across asset candles to serve as a mean-reversion anchor.
* Centered Value Overlay: Formats and displays the live value calculation string explicitly within a flat panel box, utilizing a clean layout structure.
* Solid Flat Geometry: Employs a flat container layout frame that removes messy frames, drop-shadow margins, or traditional sunken borders.

Adjustable Input Parameters
Tailor the calculation matrix completely to your personalized risk strategy directly through the input dashboard:
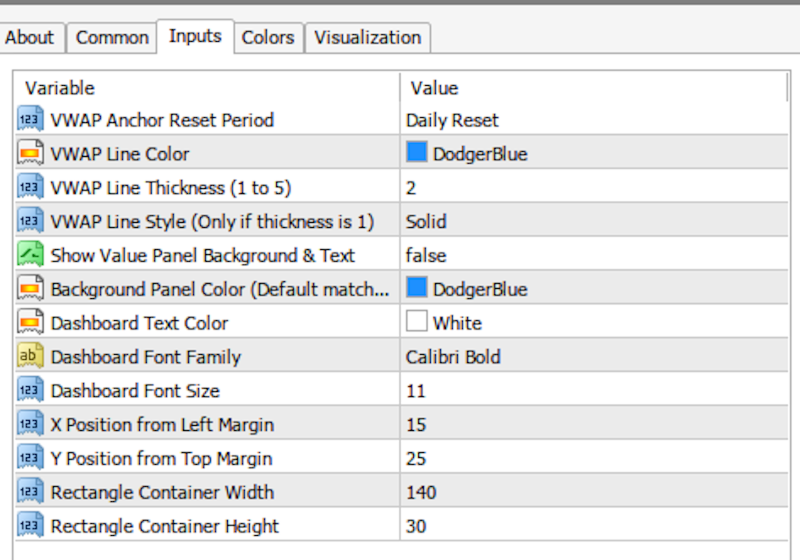
* InpAnchorPeriod (Default: Daily Reset): Adjusts the lookback accumulation barrier for volume loops.
* InpLineColor (Default: DodgerBlue): Sets your primary dynamic tracking trendline color.
* InpLineWidth (Default: 2): Modifies line thickness for instant visual clarity.
* InpLineStyle (Default: Solid): Selects custom dotted or dashed line variations (applicable when line width is set to 1).
* InpShowPanel (Default: true): Turns the visual text dashboard box and solid background rectangle on or off.
* InpBgColor (Default: DodgerBlue): Sets the background panel box color to match user preferences.
* InpLabelColor (Default: White): Changes the typography fill color inside the metric container.
* InpLabelFont (Default: Calibri Bold): Dictates your preferred charting typography family.
* InpLabelSize (Default: 11): Scales font size readability within the active metrics block.
* InpXOffset / InpYOffset (Default: 15 / 25): Fine-tune pixel layout coordinate positions from screen boundaries.
* InpPanelWidth / InpPanelHeight (Default: 140 / 30): Scale metric container sizes seamlessly on your screen interface.
推荐产品
RSI with Bands
Amirhossein Ghasemi Moroodi
经过7年的发展,我决定免费发布我自己的一些指标和专家顾问(EA)。 如果您觉得它们有用,请给予 五星好评支持!您的反馈激励我继续提供免费工具。 也探索我的其他免费工具 这里 。 _________________________________ "带带子的RSI"指标 —— 更好的交易决策 "带带子的RSI"指标将经典的RSI与简单的带子相结合,更清楚地指示何时买入或卖出。它旨在帮助您发现进入和离开市场的最佳时机。 主要优势: 精准超买和超卖分析 : 通过添加带子来增强RSI,突出显示市场的真正极端,避免常见的误导信号。 清晰信号 : 轻松识别价格过高或过低的时刻,从而做出交易决策。 更好的时机 : 带子为常规RSI提供额外信息,帮助您找到采取行动的正确时刻。 如何使用: 用户友好设置 ️: 轻松将其添加到您的Metatrader 4中。几下点击即可根据您的需求进行调整。 易于阅读 : 关注指标,并用它来指导您何时买入或卖出。 "带带子的RSI"指标非常适合希望更智能而不是更辛苦交易的人,使用易于理解的信号。 联系方式 有问题或需要帮
FREE
ATR with Bands
Amirhossein Ghasemi Moroodi
经过7年的发展,我决定免费分享我的一些指标和专家顾问(EA)。 如果您觉得它们有用,请给予 五星评价支持!您的反馈将激励我继续提供免费工具。 查看我的其他免费工具 这里 _________________________________ 带有上下边界的ATR指标,用于提升外汇市场波动性分析 介绍MQL5开发的带有上下边界的ATR指标,旨在将您的外汇市场分析提升到新的水平。这一创新工具将平均真实范围(ATR)与可定制的上下边界相结合,提供对市场波动性的细致理解。 主要特点: 波动性测量: 利用ATR准确衡量市场波动性,为市场状况提供关键见解。 可定制边界: 通过调整上下边界来直观显示波动性极值和市场趋势。 突破和整固检测: 帮助识别潜在的突破或整固,促进战略性交易决策。 加强市场分析️: 通过研究波动性与市场趋势的关系,提供全面的分析工具。 使用及信号解读: 轻松集成️: 将带有上下边界的ATR指标无缝集成到您的Metatrader 5平台中。根据您的交易偏好自定义边界。 波动性趋势监控: 持续监控指标,以评估市场波动性及其对价格动向的潜
FREE
Blahtech VWAP
Blahtech Limited
5 (3)
Blahtech VWAP - Volume Weighted Average Price (VWAP) is the ratio of price to total volume. It provides an average price over a specified time interval.  Links [  Install  |  Update  |  Documentation   ] Feature Highlights Configurable VWAP Line Sessions, intervals, anchored or continuous Previous day settlement line Standard Deviation bands Alerts at bar close or real time Automatic Broker or Tick volumes Significantly reduced CPU usage Input Parameters Expert Advisor Mode  - Reserved for iC
FREE
This is the original, simpler version of our core EURUSD algorithm (it calculates and displays 2 lines rather than 3), but it is still capable of detecting levels in the market where EURUSD will likely move to. These levels are indicated by unusual large gaps, formed by the two lines. Detailed guidance is given to users.  All in all it works on the very short term,  and more importantly on the daily chart. The differences between this and our top EURUSD indicator, is that this one only displays
FREE
CCI Colored
Zaky Hamdoun
New Release! Hello Everyone! I've just released Acronix, a new bot with live 2025 AND 2026 results. Find more about it here:  https://www.mql5.com/en/market/product/201513 . Introduction and Description The commodity channel index (CCI) is an oscillator originally introduced by Donald Lambert in 1980. Since its introduction, the indicator has grown in popularity and is now a very common tool for traders in identifying cyclical trends not only in commodities but also equities and currencies. The
FREE
Malik Naveed Volume — Better Volume Multi Timeframe Malik Naveed Volume shows you what the volume is really doing. It reads each candle's volume and price range, splits it into buying vs selling pressure, and colours the bars so you can instantly see climax moves, absorption (churn), and low-volume exhaustion. It then draws support/resistance levels from those key bars and alerts you when price breaks and retests them — across six timeframes at once, on any symbol. Works on ANY symbol and ANY
FREE
Features: 1- Get OB/OS Levels from Golden MA Levels 2- Wait for Buy/Sell Start Level Cross 3- Optional: Should price cross Mid Level in earlier bars 4- Optional: Crossing bar High/Medium Volume 5- Optional: MA Stacked to check up/down trend for current TF 6- Optional: NRTR higher timeframes aligned Check Detailed blog post explained: https://www.mql5.com/en/blogs/post/758457 Levels with Buffers available here: Golden MA Levels Indicator: https://www.mql5.com/en/market/product/119515 Note: Arr
FREE
QuantumAlert Stoch Navigator is a free indicator available for MT4/MT5 platforms, its work is to provide "alerts" when the market is inside "overbought and oversold" regions in the form of "buy or sell" signals. This indicator comes with many customization options mentioned in the parameter section below, user can customise these parameters as needful. Join our   MQL5 group , where we share important news and updates. You are also welcome to join our private channel as well, contact me for the p
FREE
关于 Range Explosion Range Explosion 是一款功能强大且免费的交易工具,用于检测市场震荡区间、绘制精确的支撑和阻力,并以高精度和精美的视觉效果识别突破机会。 它是 Break Out Explosion 项目的一部分,为初学者和专业交易者提供可靠且先进的解决方案。 此产品的 MT5 版本可在此获取: https://www.mql5.com/en/market/product/153004 \如果您对突破交易概念感兴趣,请查看这款用于检测趋势线突破的高级工具: https://www.mql5.com/en/market/product/155132 您想要一个根据此指标箭头进行交易的智能交易系统(EA)吗?您只需通过以下链接以 $30 创建一个直接任务,我将为您制作: https://www.mql5.com/en/job/new?prefered=eeecad 加入我的 MQL5 频道,获取最新更新和新产品发布信息。: Join 主要功能 自动区间检测 – 实时识别市场震荡区。 智能突破信号 – 等待价格突破支撑或阻力并标记买卖信号。 清晰的可视化设
FREE
QuantumAlert RSI Navigator is a free indicator available for MT4/MT5 platforms, its work is to provide "alerts" when the market is inside "overbought and oversold" regions in the form of "buy or sell" signals. This indicator comes with many customization options mentioned in the parameter section below, user can customise these parameters as needful. Join our   MQL5 group , where we share important news and updates. You are also welcome to join our private channel as well, contact me for the pri
FREE
Gemini EA
Peter Roy Sorenson
4.5 (2)
NEW VERSION of Gemini:   Changes with signal combinations, SL/TP values and amount of pairs and TF’s available.   Please make sure you download V 1.1 and ONLY use set files for each pair and TF given!   Signal has been updated with this new version. Gemini  is a complex Expert Advisor that uses Awesome Oscillator closing bar price, ATR Ranges and Bar Pattern combinations for opening trades with managing and closing trades based on Bollinger Band Width Ratio’s.   Though the algorithms are consta
FREE
NIGHTCrusher Lite FREE
Christian Opperskalski
4.5 (2)
NIGHTCRUSHER is a fully automated expert advisor, designed for scalping on quite market situation. The Lite - Version is limited to minimal Lot per Pair and dont has lot mulitplier and dynamic function you can also run different strategies like swing trading or grid different Trade Entry Signals different Exit Strategies included (MA Cut / Signal Change / Trailing TP) clever Risk & Money management - Balance based - Longrun trades tracking You can also use a Grid function or Lot multipier, if ne
FREE
HN levels
Hosamnasr Noshy
5 (1)
this indicator Construction on  Gann angles and it,s very effective .you can use it as (Support and resistance) it,s very successful and easy to use.if candle Cross through level thats mean price is going ti next level but with on condition. The price cames from a previous level There is a variable of  angles for frames the best is 1h frame and stander variable.........
FREE
我在学习 Rob Smith 的 TheStrat 时创建了这个简单的指标,发现它非常有用,我想与您分享。如果您觉得它有用,请查看我在 MQL5 上发布的其他指标。 该指标只是在图表上绘制一条线,显示您从较高时间范围内选择的价格水平。 使用设置,您可以完全控制它显示的时间范围,但默认 情况下,它会自己计算更高的时间范围,只是将刻度向上移动一级。例如,如果您打开 H1 图表,它将显示 H4 图表中的数据。 设置 跟踪时间表 选择绘制价格水平的时间范围。如果您将其保留为当前的默认设置,它将为您选择合适的时间范围。如果您正在查看图表并在时间范围之间进行更改,这将非常有用,因为该线将始终向上调整。 跟踪值 您可以从以下标准价格值中选择一个。默认为开盘价。 PRICE_CLOSE 收盘价 PRICE_OPEN 开盘价 PRICE_HIGH 期间最高价 价格_低 期间最低价 PRICE_MEDIAN 中位数价格,(高 + 低)/2 PRICE_TYPICAL 典型价格,(最高价+最低价+收盘价)/3 PRICE_WEIGHTED 加权收盘价,(最高价+最低价+收盘价+收盘价)/4
FREE
High Low Open Close MT4
Alexandre Borela
4.81 (21)
如果你象这个项目一样,就有5个饥饿审查。 这项指标采用了既定价格的公开、高、低价和关闭价格 可以对特定时间区加以调整。 许多机构和专业人士都认为这些是重要的。 贸易商可以为你了解他们可能更进一步的地点, 积极。 现有期间为: 前一日。 前一星期。 曾任Month。 曾任。 前一年。 或: 目前日。 目前周。 目前 Month。 目前配额。 今年。
FREE
BoxProfile MT4
Evgeny Shevtsov
4.92 (12)
The indicator displays volume profiles based on the nesting principle. Profiles periods are pre-set so that each subsequent profile has a length twice as long as the length of the previous profile. In addition to profiles, the indicator displays volume clusters sorted by color, depending on the volume they contain. Indicator operation features The indicator works on typical timeframes from M5 to MN, but for calculations uses historical data from smaller timeframes: M1 - for timeframes from M5
FREE
Market Volume Profile Modes MT4 是一款分析型指标,直接在图表上显示成交量在各价格水平上的分布。对于选定的价格区间,它将纵向价格范围划分为可配置的若干行,把 tick 成交量累加到每一行,再以横向柱状图呈现结果。每一行会根据对应K线收阳还是收阴,拆分为多头部分和空头部分,从而分别显示各价位上买方与卖方的活动占比。 该指标通过单个输入参数提供八种计算模式。固定范围模式会在图表上添加一个可点击的按钮,用于创建可拖动的矩形,你移动或调整方框大小后,指标会针对其覆盖的K线重新计算分布,便于研究某一段特定的波段或盘整。可见范围模式根据图表窗口中当前显示的K线构建分布,并在你滚动或缩放时更新。其余模式会按周期自动为每个周期绘制一份分布:日内(Session)、周、月、小时、四小时,以及按你指定的固定K线数量分组的自定义模式。最大分布数量参数限制绘制多少个近期周期,可选的分隔线用于标示一个周期与下一个周期的交界处。 指标从累积分布中推导出三条参考水平线。控制点(POC)标示成交量最高的价格行。价值区上沿(VAH)与价值区下沿(VAL)界定中间那一段合计占总成交量指定百分
FREE
Range Filter - BreakOut EA What is the Range Filter? The   Range Filter   is an innovative tool designed to smooth out market noise and highlight meaningful price movements. Rather than focusing on every small fluctuation, the Range Filter eliminates insignificant activity, allowing traders to see trends more clearly. The idea comes from the QQE’s volatility filter, but instead of applying it to RSI, this approach is applied directly to price action. Here’s how it works: A smoothed average of t
FREE
QuantumAlert CCI Navigator is a free indicator available for MT4/MT5 platforms, its work is to provide "alerts" when the market is inside "overbought and oversold" regions in the form of "buy or sell" signals. This indicator comes with many customization options mentioned in the parameter section below, user can customise these parameters as needful. Join our   MQL5 group , where we share important news and updates. You are also welcome to join our private channel as well, contact me for the pri
FREE
Adaptive Volume Profile
Volodymyr Lytvyniuk
Adaptive Volume Profile 直接在图表上绘制最近 K 线的成交量分布(Volume Profile):控制点(POC)、价值区域(VAH / VAL)、高成交量节点(HVN)、低成交量节点(LVN),以及可选的成交量直方图。价格行的大小会根据当前波动率(ATR)自适应,因此在任何品种和周期上都清晰易读。 功能特点 POC - 窗口内成交量最大的价格水平 Value Area (VAH / VAL) - 包含所选成交量比例的价格区间(默认 70%) HVN / LVN - 高成交量和低成交量节点(价格倾向于停留或快速穿过的水平),根据档位的平均成交量进行统计判定;相邻的价格行会合并为一个区域,使图表保持整洁 自适应价格行宽度 - 价格行根据 ATR 确定大小,并受最大行数限制 实时滚动档位 - 每根新 K 线根据最近 N 根 K 线重新计算 固定日期档位 - 构建截止于所选日期的档位(例如开仓时刻),查看当时的价位水平 独立的档位周期 - 例如在 M15 图表上使用 H4 档位 两种成交量分配模式 - 每根 K 线的成交量分布在其最高-最低价范围内(默认),或放在收盘
FREE
Multi Timeframe ZigZag Indicator
Salman A A A T Bakhash
5 (2)
Description: This indicator draw ZigZag Line in multiple time frame also search for Harmonic patterns before completion of the pattern. Features: Five instances of ZigZag indicators can be configured to any desired timeframe and inputs. Draw Harmonic pattern before pattern completion. Display Fibonacci retracement ratios. Configurable Fibonacci retracement ratios. Draw AB=CD based on Fibonacci retracement you define. You can define margin of error allowed in Harmonic or Fibonacci calculations
FREE
MT Supply Demand
Issara Seeboonrueang
4 (4)
We provide indicators tailored to better meet your trading requirements.       >>  MT Magical  << MT Supply Demand : It is an indicator created to find supply and demand, which will be important support and resistance levels for the price.  Supply Zone   is a zone where the price has reached, it is often resisted. In other words, when the price reaches this zone, there will be more selling power to push the price back down. Demand Zone   is a zone where the price has reached, it is ofte
FREE
Automated Timeframe cycling with Symbols centered.  Force every timeframe onto one clock window, so the story you see on Daily is the same story you are slicing on H4, H1, and M1.  Traders usually flip timeframes and lose the span. A Daily chart shows a few weeks, then M15 shows a few hours, and the eye treats them as different markets. TASSERACT locks the window to N bars of the highest enabled timeframe — default 10 Daily — and maps every lower timeframe to that same stretch. You stay inside o
FREE
SpreadFix
Oleg Shangin
This indicator collects and organizes spread data. It is an organic add-on to my news robot, ExpertNews , which can be downloaded here . You can also watch a video about news trading using the ExpertNews robot. It is available on youtube . Unfortunately, it is not possible to place the robot in the mql5.com store, because the automatic validation of ExpertNews by the mql5 service ends in failure. In reality, there are no errors in the robot. Testing fails due to the fact that the advisor is

FREE
CCZ is an objective support/resistance zones built from consecutive candle-overlap through same price range, on any base timeframe   "From the maker of Risk Sentinel — risk-first position sizing that keeps your risk fixed as you drag the stop:   https://www.mql5.com/en/market/product/185979 " ================================================================================================================================================= The Main Concept: Classic support and resistance measures 
FREE
Check my paid tools they work great and I share Ea's based on them for free please r ate The Dual Timeframe RSI (Relative Strength Index) indicator is a novel trading tool that allows traders to monitor RSI readings from two different timeframes on a single chart. This dual perspective enables traders to identify potential trend confirmations and divergences more effectively. For instance, a trader might use a 1-hour RSI alongside a daily RSI to ensure that short-term trades align with the broa
FREE
XAUUSd Reaper Mt4
Ibrahim Aljaref
XAUUSD Reaper 是一款专为 MetaTrader 4 上的黄金(XAUUSD)开发的交易指标。 该指标旨在通过直接在图表上显示清晰的 BUY 和 SELL 信号,简化图表分析。它为交易者提供一个有条理的可视化环境,用于跟踪 XAUUSD 的价格走势,并识别市场方向可能发生的变化。 XAUUSD Reaper 可用于任何时间周期。 推荐时间周期:M15 建议在一般使用中采用 M15 时间周期,因为它能够提供实用的黄金日内走势视图,同时保留足够的市场结构用于信号分析。 XAUUSD Reaper 的工作方式 XAUUSD Reaper 会持续分析 XAUUSD 的价格状况,并在其内部条件得到确认时显示信号。 BUY 和 SELL 信号会以可视化方式直接显示在图表上,使交易者无需持续监控每一次价格波动,也能识别所检测到的市场方向。 该指标适用于手动交易和市场分析。它不会自动开仓或管理交易。 最终是否进入或退出市场的决定始终由交易者自行作出。 主要功能 • 专为黄金 / XAUUSD 开发 • 适用于 MetaTrader 4 • 支持所有时间周期 • 推荐时间周期:M15 •
FREE
Enigma scalper fx
Yonny Pascal Ekwa Mezui
Enigma Scalper Pro Breakout - EURUSD ONLY Overview Enigma Scalper Pro Breakout is a multi-filter breakout indicator designed to help traders identify high-probability trading opportunities by combining price action with multiple technical confirmations. The indicator uses a proprietary 3-Bar Breakout pattern together with optional Higher Timeframe, Bollinger Bands, RSI, and EMA filters to reduce low-quality signals and improve trade accuracy. How It Works The indicator waits for a valid breakout
FREE
Mirror chart
Salavat Yulamanov
4.5 (2)
該指標在一張圖表上顯示兩個不同的貨幣對,旨在簡化顯示的信息,   能夠使用終端機中幾乎所有可用的工具(不僅是貨幣對,還包括金屬和原料)。 對任何貨幣對使用視覺關聯方法的特點 子符號。 貨幣對以彩色蠟燭顯示在螢幕上。 這是同一相關對。 鏡像。 輔助貨幣。 此指標反映了兩種類型的相關性。 設定 子交易品種 = "美元兌瑞郎";   BullBarColor = 橘紅;   BearBarColor = 黃色;   顏色網格顏色=白色;   鏡像=假; The indicator displays two different pairs on one chart, designed to simplify the displayed information,   Capable of working with almost all instruments available in the terminal (not only currency pairs, but also metals and raw materials). Feature of using a visual c
FREE
️ Real Flow Defense Levels:真实流防御水平 Real Flow Defense Levels 指标是一个专有工具,旨在直接在您的主交易图表上识别和绘制 重要、高可信度的价格区域 。它使用动态的、基于成交量的分析,来确定市场先前展示出 最强防御或活动集中 的位置。 这些绘制的线条充当 动态的支撑和阻力位 ,突出显示了主要参与者最有可能进场或捍卫其头寸的价格。与静态的水平线不同,这些水平线会随着时间调整,根据近期的高影响力活动反映出当前的市场结构。 主要特点 动态支撑与阻力 自动识别并绘制多达 四个关键防御水平 ,这些水平曾发生过强烈的成交量活动,标志着市场关注的关键区域。 实时相关性 该指标持续监控最近的交易活动,以确保所绘制的水平线与 当前市场环境保持相关性 。 可配置的权重 包含 可选的加权因子 ,允许交易者强调发生在 一天中特定时间 或具有 更高成交量影响 的水平。 视觉优先级和水平层级 四个水平中的每一个都被分配了独特且可自定义的颜色,以帮助交易者确定其重要性。这些水平根据市场活动强度进行排名: 一级 代表 最强 的防御区域(最高成交量/影响)
FREE
该产品的买家也购买
Trend SniperX MT4
Sarvarbek Abduvoxobov
5 (5)
Trend Sniper X 是一款用于 MetaTrader 5 的多周期趋势追踪指标,旨在帮助交易者清晰、精准地识别趋势方向及潜在的反转点。 适用于 MT5: https://www.mql5.com/en/market/product/181101 价格信息: 当前价格为促销价,随着后续更新和新功能的推出,价格可能会发生变动。 Code2Profit 频道 通过多周期分析掌控市场! 如何使用 Trend Sniper X 最大化胜率:关键规则与交易时段技巧 技术规格 交易平台 MetaTrader 5 指标类型 多周期趋势指标 运行时间周期 任意图表周期,支持独立选择更高周期(M1–MN1) 主要交易品种 外汇、黄金 (XAUUSD) 及其他 CFD 差价合约 推荐账户 任何账户类型 可视化呈现 彩色趋势 K 线(买入/卖出/弱势/转变)+ 买入/卖出信号箭头 附加模块 市场交易时段框(悉尼、东京、伦敦、纽约) 核心功能 多周期趋势分析: 将更高周期的趋势方向直接投影到当前图表上,提供清晰的宏观视角。 弱势/不确定 K 线检测: 高亮显示趋势状况不明确的 K 线,帮助交易者远离震
AW Prime Oscillator
AW Trading Software Limited
5 (1)
两个振荡器的组合。第一个显示入场点,第二个显示当前趋势。该指标可以通过两种模式的箭头显示振荡信号,所有快速振荡信号或仅在当前趋势方向的信号。它具有多时间范围面板和三种类型的信号通知。 好处: 适合当日交易和倒卖交易 趋势过滤 简单而灵敏的设置 多时间框架面板 适合融入顾问。 适用于任何交易品种和任何时间范围 三种类型的通知 MT5 version ->  HERE  / Problem solving ->  HERE 指标策略 该指标由两个不同的振荡器组成: 慢趋势线(粗) - 当指标的最高水平从上到下交叉时,它是下降趋势的指标,当较低的水平水平(指标的低水平)从下到上交叉时,它是下降趋势的指标上升趋势。此外,在较低区域找到一条慢线表明当前趋势是下降趋势,反之亦然,在上方区域找到一条慢线表明当前趋势是上升趋势。这就是该指标确定当前市场趋势的方式。 快速入场线(细):识别从下到上与下线相交处的入场点,这是买入信号,在从上到下穿越上线时,这是卖出信号。除了振荡线之外,调整指标线也很重要,因为这会影响信号的数量和准确性。 本产品使用不同的振荡器来显示慢线和快线,每个振荡器必须单独调整。 为
SR Liquidity
Oleg Rodin
5 (2)
SR Liquidity 是一款旨在揭示市场流动性高度集中且价格反应最剧烈的隐蔽区域的交易指标。这些特殊的流动性区域充当着强有力的支撑位与阻力位,为您清晰呈现市场最可能发生反转的位置。 SR Liquidity 指标并非简单地绘制常规的支撑/阻力线,而是通过分析实际的价格行为,识别买卖压力积聚的区域。这些区域实际上是推动市场真实波动的流动性池。通过在图表上直观呈现这些区域,该指标能助您在价格反应发生前预判走势——这意味着它实际上能够预测价格方向可能发生的变化。它将原始的价格行为转化为清晰且具实操价值的市场蓝图,标示出那些可能成为市场转折点的关键价位。 该指标适用于任何交易品种和时间周期——包括外汇、指数、金属、加密货币等。支持任意时间周期。 购买后请联系我,以获取交易指南及免费赠送的优质附加指标!
Zoryk Gold mt4
Reda El Koutbane
5 (2)
折扣将在 24 小时后结束——下一价格为 69 美元 联系我获取推荐设置 首发名额有限 ZORYK — MetaTrader 4 专业 XAUUSD 黄金信号与交易计划系统 你一定经历过这种感觉。 你花时间分析黄金,等待入场,终于打开交易后,价格却立即向相反方向移动。你过早平仓,移动止损,或者因为犹豫几秒而错过机会。随后市场在没有你的情况下,准确到达你最初预期的目标。 问题并不总是方向错误。 真正的问题是不确定性。 你不知道真正的入场位置在哪里,不知道交易逻辑在什么位置失效,也不知道应该先保护较小的利润,还是继续等待更大的行情。你甚至不知道当前信号是否足够强,还是自己只是在勉强寻找一笔交易。 黄金移动速度非常快。没有明确计划的正确判断,也可能在几秒钟内变成错误决定。 ZORYK 正是为了解决这个问题而开发。 什么是 ZORYK ZORYK 是一套专门为 MetaTrader 4 和 XAUUSD M5 周期开发的完整黄金信号与交易计划系统。 它不是一个只显示 BUY 或 SELL 箭头,然后让你独自处理所有后续决定的普通指标。 每个确认信号都可以在图表上显示
M1 Sniper
Oleg Rodin
4.97 (30)
M1 SNIPER 是一款易于使用的交易指标系统。它是一个专为 M1 时间框架设计的箭头指标。该指标可以作为独立的系统在 M1 时间框架下进行剥头皮交易,也可以作为您现有交易系统的一部分使用。虽然该交易系统专为 M1 时间框架交易而设计,但它也可以用于其他时间框架。我最初设计此方法是为了交易 XAUUSD 和 BTCUSD。但我发现这种方法在其他市场交易中也同样有用。 指标信号既可以顺势交易,也可以逆势交易。我教授一种特殊的交易技巧,帮助您利用指标信号进行双向交易。该方法基于使用特殊的动态支撑位和阻力位区域。 购买后,您可以立即下载 M1 SNIPER 箭头指标。此外,我还为所有 M1 SNIPER 工具用户免费提供下方屏幕截图所示的 Apollo Dynamic SR 指标!这两个指标的组合可以帮助您更轻松、更准确地利用 M1 时间框架进行交易。 购买后请联系我,免费获取交易提示和奖励指标! 祝您交易成功!
Trend Lines PRO
Roman Podpora
5 (1)
TREND LINES PRO 帮助您了解市场真正的方向转变点。该指标显示真实的趋势反转点以及主要参与者重新入场的时机。 您可以看到 BOS线、 趋势变化和更高时间框架的关键水平——无需复杂的设置或不必要的干扰。信号不会重绘,并在K线收盘后仍然保留在图表上。 VERSION MT 5    -   与……搭配使用时,可发挥其最大潜力   RFI LEVELS PRO 指示器 该指标显示的内容: 实际变化 趋势(BOS 线) 一旦信号出现,它就始终有效!这与会重绘的指标有着重要的区别,后者可能会发出信号后又改变信号,从而导致资金损失。现在,您可以更精准、更准确地进入市场。此外,还有一个功能,会在箭头出现后为K线着色,直到达到目标价位(止盈)或出现反转信号为止。 重复条目   以及主要玩家的充值 为了提高寻找入场点时的视觉清晰度,我们创建了一个模块,该模块首先显示买入/卖出区域,并在该区域内寻找最佳入场点。此外,我们还加入了智能逻辑来管理止损位,该逻辑会随着时间的推移逐步降低止损位的大小,从而降低入场交易时的初始风险(移动止损位)。 信号强度水平(BOS) 该指标采用三个显著性等级来衡量
Atomic Analyst
Issam Kassas
5 (14)
Atomic Analyst — MetaTrader 4 如有产品、设置或技术支持方面的问题,请直接在 MQL5 上给我发消息。 该指标将复杂的市场计算转换为简单的视觉信号、彩色K线、趋势读数、止损水平和多个止盈区域,使交易者能够快速理解并应用于真实市场环境。 主要交易用途: 剥头皮和日内交易: 专为快速决策、清晰箭头、提醒、K线颜色和结构化进出场区域而设计。 日内交易和波段交易: 帮助交易者利用趋势方向、强度、动能和多周期分析跟随更大的市场波动。 主要功能: • 价格行为、强度和动能分析 • 多周期趋势扫描器 • 总体趋势百分比计算 • 买入和卖出箭头 • 止损和多个止盈水平 • 最多 5 个基于斐波那契的止盈水平 • 移动止损逻辑 • 用于趋势和动能的彩色K线 • 实时提醒到终端、手机和电子邮件 • 现代化用户友好面板 • 实时交易监控 • 买入和卖出潜力显示 • 总交易数量显示 • 每日、每周和总利润显示 • 每日佣金计算 • Bid、Ask 和点差显示 • K线计时器、本地时间和服务器时间 • 终端连接状态 • 账户货币显示 • 可直接从面板控制时间周期 • 可手动使用,
Smart Trend Trading System
Issam Kassas
4.8 (10)
Smart Trend Trading System 是适用于 MetaTrader 4 的图表指标,将趋势信息、入场和出场信号以及价格水平集中呈现在同一图表上。 它将 10 多种交易工具 整合到一个系统中,包括趋势检测、反转区域、Smart Cloud、移动止损逻辑、支撑与阻力、K线着色、提醒以及多周期分析。 该系统旨在帮助您应对不同的市场环境: 趋势市场: 识别主要趋势,发现回调,跟随动能,并通过止损指导和移动止损选项寻找更清晰的入场机会。 震荡市场: 识别区间震荡状态,寻找价格反应区域,并在价格触及重要水平时获得更清晰的信号。 剥头皮和日内交易: 使用快速信号、K线颜色、提醒和多周期确认,辅助短线交易决策。 主要功能: • 10 多个指标整合为一个交易系统 • 7 多种策略和信号组合 • 趋势跟随、反转、剥头皮、日内交易和波段交易模式 • 入场和出场箭头 • Smart Cloud • Smart Reversal Zones • 支撑和阻力水平 • Smart Trailing Stop • 多周期趋势分析 • 成交量、趋势和反转K线着色 • 手机、电子邮件和终端提醒 •
Tokyo mt4 Indicator
Vasiliy Strukov
5 (9)
Tokyo Indicator(东京指标)直观地展示了趋势方向、潜在交易信号及市场状况。 其采用颜色编码的阶梯式趋势线,以蓝色标识看涨阶段,以洋红色标识看跌阶段。配套的方向箭头会在趋势发生变化时,标示出潜在的买入与卖出机会。 内置的综合仪表盘将当前信号、市场倾向、动能、波动率及信号质量整合于同一视图中,方便交易者在观察价格走势的同时评估指标数据,无需在不同面板间切换。 凭借清晰的图表显示和简洁的市场概览,Tokyo Indicator 支持以系统化的方式进行趋势分析与交易确认。 适用于任何时间周期及各类交易品种,尤其适合黄金交易。 购买后请立即联系我,以获取专属赠品!您可以免费获得我们的“强力支撑与趋势扫描”(Strong Support and Trend Scanner)指标,请私信我! 设置说明与使用手册请见此处。 请注意:我不会在 Telegram 上出售我的 EA 或特殊参数设置(set files);我的 EA 仅在 Mql5 平台上提供,而参数设置文件仅在我的博客(此处链接)上发布。请务必警惕诈骗,切勿从他人处购买任何参数设置! 设置 ShowHUD —— 在图表上显示
PRO Renko System
Oleg Rodin
5 (31)
PRO Renko Arrow Based System for trading renko charts.  准确的信号交易任何外汇工具. 另外,我将免费提供系统的附加模块! PRO Renko系统是RENKO图表上高度准确的交易系统。该系统是通用的。 该交易系统可应用于各种交易工具。 该系统有效地中和了所谓的市场噪音,打开了获得准确反转信号的通道。 该指标易于使用,只有一个参数负责产生信号。 您可以很容易地使算法适应您感兴趣的交易工具和renko酒吧的大小。 我很乐意通过提供任何咨询支持来帮助所有客户有效地使用该指标。 祝您交易成功!购买后,立即写信给我! 我将与您分享我的建议和我的renko发电机。 另外,我将免费提供系统的附加模块!
Currency Strength Wizard
Oleg Rodin
4.85 (61)
货币强度向导是一个非常强大的指标,为您提供成功交易的一体化解决方案。该指标使用多个时间范围内所有货币的数据来计算这个或那个外汇对的力量。此数据以易于使用的货币指数和货币电力线的形式表示,您可以使用它们来查看这种或那种货币的力量。 您所需要的只是将指标附加到您要交易的图表上,该指标将向您显示您交易的货币的真实强度。该指标还向您显示买卖量压力的极值,您可以在顺势交易时利用这些压力。该指标还显示了基于斐波那契的可能目标。该指标可用于各种交易时间范围。该指标支持各种货币对的交易。 该指标为您提供所有类型的警报,包括推送通知。 购买后请联系我。我将与您分享我的交易技巧,并免费为您提供丰厚的红利指标! 祝您交易愉快,获利丰厚!
Advanced Currency Strength28 Indicator
Bernhard Schweigert
4.91 (659)
目前40%的折扣 任何新手或专家交易者的最佳解决方案! 这个指标是一个独特的、高质量的、可负担得起的交易工具,因为我们纳入了一些专有的功能和一个新的公式。只需一个图表,你就可以读出28个外汇对的货币强度!想象一下,你的交易将如何得到改善,因为你的交易是在你的手中进行的。想象一下,你的交易将如何改善,因为你能够准确地确定新趋势或剥头皮机会的触发点? 用户手册:点击这里  https://www.mql5.com/en/blogs/post/697384 这是第一本,原版的! 不要买一个毫无价值的崇拜者的克隆品。 特别的 子窗口中的箭头显示强劲的货币势头GAP将指导你的交易! 当基础货币或报价货币处于超卖/超买区域(外盘斐波那契水平)时,在个人图表的主窗口中出现警告信号。 当货币力量从外围区间回落时,回撤/反转警报。 十字星模式的特别警报 可选择多个时间框架,以快速查看趋势! 货币强度线在所有的时间框架中都非常平稳,当使用较高的时间框架来识别总体趋势,然后使用较短的时间框架来确定精确的入口时,效果非常好。你可以根据自己的意愿选择任何时间框架。每个时间框架都由其自身进行了优化。
Scalper Vault
Oleg Rodin
5 (40)
Scalper Vault 是一套功能强大且配置完善的交易系统,专为追求日内交易稳定性的交易者而设计。 作为一套完整且独立的交易系统,该高精度指标能够为外汇和二元期权交易者提供机构级的市场分析。 购买后请联系我,获取我的独家交易技巧以及一份超值赠品! Scalper Vault 能够消除凭感觉交易和复杂的各种手动分析,让您只需专注于执行交易,并运用简单易行的交易技巧进行操作。 精准的顺势交易信号:其核心算法通过分析市场结构,仅在市场主导趋势的方向上提供高胜率信号,从而大幅减少错误的入场操作。 精确的顶部与底部探测:系统能够识别市场动能耗尽的状态,从而锁定潜在的反转区域。 基于江恩(Gann)理论的买卖区域:系统会自动绘制江恩数学市场点位,让您能清晰洞察大型机构交易者在何处寻求买入或卖出。 100% 不会重绘(Non-Repainting):一旦K线收盘,生成的信号便会永久固定在图表上。绝无动态偏移,绝无虚假信号——您在历史数据中所见,即为该指标的真实表现。 广泛的市场适用性:适用于各类货币对、黄金、指数以及加密货币交易。
Liquidity Scalper System
Stanislav Konin
5 (1)
Liquidity Scalper System: 基于流动性的指标形式交易系统。 大多数指标只显示一个箭头,止损放在哪里、目标在哪里、信号是否可信,都要交易者自己判断。Liquidity Scalper System 覆盖完整的交易周期:寻找流动性池,在其被突破时给出信号,立即计算 Entry、Stop Loss 和三个目标,并在面板上显示统计数据以及新数据上的验证结果。系统自行选择设置,并每天更新。 工作原理 1. 系统寻找流动性池:市场参与者止损单聚集的价位。 2. 当价格突破流动性池,且突破经由动能(必要时还经由成交量)确认后,图表上出现 BUY 或 SELL 箭头。 3. 立即绘制 Entry、Stop Loss、TP1、TP2 和 TP3 水平,并填充区域。 4. 右侧构建流动性分布图:可以看到价格上方和下方大成交量集中的位置。 与众不同之处 • 自动优化取代手动调参。 系统在历史数据上测试 32 种设置组合,为当前品种和周期选出最佳组合。优化目标可选:Win Rate、净利润或盈利因子。 • 新数据验证。 设置在一部分历史上训练,并在优化器未见过的更新数据上检验(out
Currency Strength Exotics
Bernhard Schweigert
4.88 (33)
目前8折优惠! 对任何新手或专家交易者来说都是最好的解决方案! 这个指标是专门用来显示任何符号的货币强度,如异国货币对、商品、指数或期货。它是同类产品中的第一个,任何符号都可以添加到第9行,以显示黄金、白银、石油、DAX、US30、MXN、TRY、CNH等的真实货币强度。这是一个独特的、高质量的、负担得起的交易工具,因为我们已经纳入了一些专有的功能和一个新的公式。想象一下,你的交易将如何改善,因为你能够准确地确定新趋势或剥头皮机会的触发点? 用户手册:点击这里   https://www.mql5.com/en/blogs/post/708876 它适用于所有时间框架。你将很快能够看到TREND! 根据新的基础算法设计,它使识别和确认潜在交易变得更加容易。这是因为它以图形方式显示了8种主要货币和一种符号的强弱。 该指标显示了8种主要货币(澳元加元瑞士法郎欧元英镑日元新西兰美元)的强弱线,再加上一个符号! 该指标显示了符号的真实价值。例如:对于XAUUSD(黄金):价格以美元报价。如果黄金在上涨,你怎么能知道是黄金的强势还是美元的弱势?只有当黄金走强时,我们才会进行交易。该指
Scalper Inside PRO
Alexey Minkov
4.74 (69)
Scalper Inside PRO 帮你分析日内趋势,在入场前就把交易规划好。核心是三套专属策略,让你更精准地读懂市场。信号一出现,指标就自动判断行情方向并计算关键价位,你能提前看到潜在入场点、预期的止损以及多个止盈位。详尽的绩效统计会展示不同品种和策略在历史上的表现,帮你根据当前行情挑选合适的资产。它既可以作为独立的剥头皮工具,也可以融入你的系统,或者作为你自己 EA 的基础。运行于 MetaTrader 4 平台。 指标会直接在图表上标出入场、三个止盈位 - TP1、TP2、TP3 以及一个可选止损。你甚至可以接入自己的箭头指标,检验它们的统计数据和盈利能力。 购买后请直接联系我,即可获得指标的专属附赠 add-ons、更多关于实盘运用的说明,以及把它正确接入你自己交易系统和 EA 的帮助。 指标主要功能 内置三套专属交易策略,可即时切换。 箭头信号出现后即时计算价位:入场以及 TP1、TP2、TP3 多级目标立刻显示,方便你提前规划交易。开启手动或自动计算后,会显示止损位。 三套策略均内置优化模块:自动把参数适配到当前品种和周期,帮你快速筛选资产(仅在实时状态下可用)。 HTF
Trend Catcher ind
Ramil Minniakhmetov
5 (11)
趨勢捕捉指標 趨勢捕捉指標結合了作者獨有的客製化自適應趨勢分析指標,用於分析市場價格趨勢。它透過過濾掉短期噪音,並專注於潛在的動能強度、波動性擴張和價格結構行為,來識別真實的市場方向。此外,它還結合了平滑和趨勢過濾等客製化指標,例如移動平均線、相對強弱指標 (RSI) 和波動率過濾器。 您可以在這裡查看實際運行情況以及我的其他產品: https://www.mql5.com/en/users/mechanic/seller 請注意,我不會在 Telegram 上出售 EA 或任何設置,那是騙局。所有設定都可以在我的部落格上免費取得。 重要提示!購買後請立即聯繫我,以獲取使用說明和額外獎勵! 請注意,我不會在 Telegram 上出售 EA 或任何設置,那是騙局。所有設定都可以在我的部落格上免費取得。
Miraculous Indicator Binary & Forex v3 StrategySafe Miraculous Indicator Binary & Forex v3 StrategySafe 是一款专业交易指标,适合希望获得清晰信号、强大确认工具以及结构化交易方式的 Binary 和 Forex 交易者。 v3 版本加入了 MIR Dashboard、Miraculous Confirmation Dashboard、GANN Law、Square of 9 水平线、GANN 角度以及更强的 Forex 分析模式。 核心功能 同时支持 Binary 和 Forex 交易模式。 MIR Dashboard 可快速读取市场状态。 Miraculous Confirmation Dashboard 用于确认交易机会。 GANN Law drawing lines 用于 Forex 市场结构分析。 Square of 9 线条、方向和关键价格水平。 1x1 GANN Angle 用于判断趋势压力。 Entry Information TP 帮助寻找合理止盈区域。 Strateg
ICT Pro 4
Robby Suhendrawan
Ultimate AIO ICT Concept Indicator for MT4:自动掌握 Smart Money Concepts 您是否厌倦了每天花费数小时手动绘制图表?AIO ICT Concept 指标是您掌握 Smart Money Concepts 的一体化完整解决方案。这款强大的算法工具旨在消除手动技术分析的猜测和情绪疲劳,自动在您的图表上绘制出最关键的价格行为元素。 掌握市场方向和高级时间框架偏见 (High Timeframe Bias): 知道市场走向就成功了一半。借助我们先进的 Market Structure 映射和 Change in State of Delivery (CISD) 检测,您可以立即识别真实的市场趋势。一目了然地轻松确定您的每日和每周方向偏见。对于波段交易者和日内交易者来说,该指标在 H4、H1 和 M15 时间框架上绝对是游戏规则的改变者。它帮助您建立高度准确的 ICT 叙事并预测未来的价格行为,而无需您自己费力地绘制线条和区域。 在较低时间框架上进行精准的盘口解读 (Tape Reading): 到了执行的时候,AIO ICT Con
Volume Orderflow Profile
Suvashish Halder
5 (2)
Introducing Volume Orderflow Profile , a versatile tool designed to help traders visualize and understand the dynamics of buying and selling pressure within a specified lookback period. Perfect for those looking to gain deeper insights into volume-based market behavior! MT5 Version -  https://www.mql5.com/en/market/product/122657 The indicator gathers data on high and low prices, along with buy and sell volumes, over a user-defined period. It calculates the maximum and minimum prices during this
"The Squeeze indicator attempts to identify periods of consolidation in a market. In general the market is either in a period of quiet consolidation or vertical price discovery. By identifying these calm periods, we have a better opportunity of getting into trades with the potential for larger moves. Once a market enters into a "squeeze," we watch the overall market momentum to help forecast the market direction and await a release of market energy." Modified TTM Squeeze Indicator is a modifica
This is a professional chart indicator designed for traders focused on stability and clear price action. It helps filter market noise and provides clear visual entry and exit zones for your trading decisions. Core Features: Strictly Non-Repainting: The system is built with strict non-repaint logic. What you see on the chart is the true historical performance. Confirmed Signals: Signals are triggered and confirmed only after the candle closes . Once a trading arrow appears on a closed candle, it
Gann Made Easy
Oleg Rodin
4.84 (172)
Gann Made Easy 是一个专业且易于使用的外汇交易系统,它基于使用先生理论的最佳交易原则。 W.D.江恩。该指标提供准确的买入和卖出信号,包括止损和获利水平。您甚至可以使用推送通知在旅途中进行交易。 购买后请联系我,即可免费获得交易指导和超棒的额外指标! 您可能已经多次听说过江恩交易方法。通常 Gann 的理论不仅对于新手交易者而且对于那些已经有一定交易经验的人来说都是非常复杂的东西。这是因为江恩的交易方法在理论上并不那么容易应用。我花了几年时间来完善这些知识,并将最好的原则应用到我的外汇指标中。 该指标非常易于应用。您所需要的只是将其附加到您的图表并遵循简单的交易建议。该指标不断进行市场分析工作并寻找交易机会。当它检测到一个好的入口点时,它会为您提供一个箭头信号。该指标还显示止损和获利水平。 换句话说,当您像先生一样进行交易时,该指标会为您提供最佳江恩建议。江恩亲自告诉你此时此刻该做什么。但最好的部分是您不需要了解任何有关江恩交易原则的知识,因为该指标会为您完成整个市场分析工作。
Break and Retest Hunter MT4 is a powerful MetaTrader 5 indicator designed to automatically identify support and resistance levels, breakout structures, and potential retest opportunities in real time. Bonus Indicator: After purchasing Break and Retest Hunter , contact me to receive Trade Indicator Assistant EA completely free as a bonus utility. $65 for the next 10 copies . Next price is $120.  Combining adaptive market analysis, clear BUY/SELL signals, Fibonacci-based profit targets, and a pre
ZONEFUSION PRO INSTITUTIONAL CLUSTER SYSTEM ZoneFusion Pro 是一款专业级外汇交易系统,专为追求精准、结构化和稳定交易的交易者打造,基于真实的机构交易逻辑。 该系统专为严肃的外汇交易者、道具账户(Prop Firm)挑战者以及 SMC 交易者设计,消除交易中的猜测,用清晰、规则化的执行框架取而代之。 它将多时间框架市场结构、供需区以及移动平均线共振整合为一体,帮助你精准识别高概率入场机会。 核心功能 多时间框架市场结构 自动识别 D1 和 H4 的机构供需区 标记价格最有可能产生反应的关键流动性区域 随着市场结构变化动态更新 双移动平均系统 通过快慢均线判断真实趋势方向 过滤低质量和逆趋势交易 确保交易顺应机构动能 多时间框架趋势确认 通过 H1 和 H4 的趋势一致性确认方向 避免假突破和市场陷阱 提升入场时机和准确性 集群信号引擎 仅在多重条件共振时生成买卖信号 条件越多,信号越强 帮助捕捉早期突破和反转机会 区间强度逻辑 当卖出区合并并变为蓝色时,表示强力卖出区 这意味着机构正在进行强势派发 当需求区合并并变为亮绿色时,表示
Dinapoli Package MT4
Samil Bozuyuk
5 (1)
All in One package includes the  Oscillator Predictor ,  MACD Predictor ,  Thrust Scanner  and  Advanced Fibonacci  indicators which are mandatory for applying  Dinapoli  trade plans.  Please visit below links for detailed explanations of indicators. Advanced Fibonacci Indicator =>  https://www.mql5.com/en/market/product/52834 Thrust Scanner Indicator => https://www.mql5.com/en/market/product/52830 Overbought /Oversold Predictor indicator => https://www.mql5.com/en/market/product/52621 Macd P
Indicator plots price cycle blocks and sends signals with smart volume confirmation. Price cycles and fractals are combined to determine the demand/supply blocks. The indicator can be used alone or combined with other Cycle Indicators Inputs: Period: Recommended value is between 35 and 55( Which are Set 1 and Set 2 periods of cycle sniper ) Engulfing: If true, you will be able to see the engulfing bar confirmation. Volume Filter: True (The  arrow comes with volume confirmation ) Videos with dif
Neuro Poseidon MT4
Daria Rezueva
4.74 (46)
Neuro Poseidon is a new indicator by Daria Rezueva. It combines precise trading signals with adaptive TP/SL levels - creating best possible trades as a result! Message me and get  Neuro Poseidon Assistant  as a gift to automize your trading process! What makes it stand out? 1. Proven profitability on all assets and timeframes 2. Only confirmed BUY and SELL signals present on the chart 3. Adaptive TP & SL levels generated by the software for each trade 4. Easy to understand - suitable for all
GoldRush Trend Arrow Signal
Kirk Lee Holloway
5 (2)
GoldRush 趨勢箭頭信號 GoldRush 趨勢箭頭信號 指標為 XAU/USD 中的高速、短期短線交易者提供精確、實時的趨勢分析。 專為1分鐘時間框架設計,此工具顯示方向箭頭以明確顯示入場點,使短線交易者能在波動市場中自信操作。 該指標包含主要和次要警示箭頭。主要信號為白色和黑色方向箭頭,用於指示趨勢方向的轉變;次要信號為藍色和紅色箭頭,用於確認主要箭頭指示的方向並提示潛在交易入場點。 注意:當趨勢方向發生變化後僅出現一個主要警報箭頭時,請注意可能會出現多個次要藍/紅箭頭。次要信號將在滿足信號標準的任何蠟燭圖後出現,因此在長期趨勢移動中,螢幕上將顯示大量次要箭頭(如附帶的截圖所示)。您可在設置中開啟或關閉任一箭頭類型。 以下是我使用此指標進行交易的方式: - 對於買入入場,我會耐心等待白箭頭在蠟燭收盤時出現,並在下一根可用蠟燭收盤時出現藍箭頭時進行買入交易。 - 對於賣出入場,我會耐心等待黑箭頭在蠟燭收盤時出現,並在下一根可用蠟燭收盤時出現紅箭頭時進行賣出交易。 - 獲利了結/止損設置由使用者自行負責,但我個人使用最低R:R為1:2,並發現這在倫敦/紐約開盤等
對稱三角形圖表模式代表價格被迫向上突破或崩盤之前的一段收縮和盤整期。向下趨勢線的突破標誌著新的看跌趨勢的開始,而從上部趨勢線的突破則表明新的看漲趨勢的開始。 獲取儀表板以立即監控您為對稱三角形模式交易的所有工具和時間範圍! https://www.mql5.com/en/market/product/69169/ 此處提供 MT5 版本: https://www.mql5.com/en/market/product/70006/ 該指標識別這些模式並在 4 個關鍵點形成且價格再次回落至三角形時提醒您,以便您為潛在的突破做好準備。對稱三角形並不總是完全對稱的,價格可以向上或向下突破,但通常最成功的突破是在形成三角形第一個點的高點或低點的方向上。因此,該指標為我們提供了對突破的看漲或看跌偏見,並採用顏色編碼並針對該特定方向發出警報。沒有必要只在一個方向進行交易,但是因為任何一個方向的突破都是可能的,但是當突破與第一個點趨勢一致時,您往往會獲得更大更快的價格變動和更好的風險回報。 輸入和配置選項: 開始搜索蠟燭 - 指標將開始尋找多少根蠟燭來尋找已完成的形態 Fib Max Ret
作者的更多信息
MTF DeMarker Exhaustion Matrix (Free Advanced Exhaustion Dashboard) The Multi-Timeframe DeMarker Exhaustion Matrix is an institutional-grade technical scanner designed to isolate subtle price exhaustion zones and impending market reversals across multiple execution cycles simultaneously. By monitoring the M15, H1, H4, and D1 intervals concurrently[cite: 4], this utility completely eliminates multi-chart cluttering and gives traders an instant executive matrix of trend exhaustion and structural
FREE
Master Trading Matrix
Jeffrey Lloyd Lauzon
Master Trading Matrix (Free Advanced Multi-Indicator Dashboard) The Master Trading Matrix is an institutional-grade technical convergence scanner designed to combine 10 foundational momentum, trend, and exhaustion engines into a single, unified execution display. By integrating RSI, Stochastic, CCI, Williams %R, DeMarker, Momentum, RVI, Chande Momentum, Rate of Change, and Ultimate Oscillator into an executive matrix, this utility eliminates multi-window clutter and provides a complete, real-ti
FREE
MTF Momentum Oscillator Matrix (Free Advanced Velocity Dashboard) The Multi-Timeframe Momentum Oscillator Matrix is an institutional-grade technical scanner designed to map out the velocity of price change across clean rolling history blocks simultaneously. By monitoring the M15, H1, H4, and D1 intervals concurrently, this utility completely eliminates multi-chart cluttering and gives traders an instant executive matrix of trend speed and directional acceleration on a single window. Instead of
FREE
Rate of Change Matrix
Jeffrey Lloyd Lauzon
MTF Rate of Change (ROC) Matrix (Free Advanced Price Velocity Dashboard) The Multi-Timeframe Rate of Change (ROC) Matrix is an institutional-grade technical scanner designed to evaluate pure historical price velocity across 4 distinct execution timeframes simultaneously. By monitoring the M15, H1, H4, and D1 intervals concurrently[cite: 18], this utility completely eliminates multi-chart cluttering and gives traders an instant executive matrix of momentum acceleration and structural trend force
FREE
MTF Ultimate Oscillator Matrix (Free Advanced Multi-Timeframe Dashboard) The Multi-Timeframe Ultimate Oscillator Matrix is an institutional-grade technical scanner designed to evaluate momentum convergence across three distinct lookback horizons on four execution timeframes simultaneously. By monitoring the M15, H1, H4, and D1 intervals concurrently, this utility completely eliminates multi-chart cluttering and gives traders an instant executive matrix of weighted momentum expansion and overbou
FREE
CMO Monitor
Jeffrey Lloyd Lauzon
MTF Chande Momentum Matrix (Free Advanced Momentum Dashboard) The Multi-Timeframe Chande Momentum Matrix is an institutional-grade technical scanner designed to isolate raw market momentum and structural exhaustion across multiple execution cycles simultaneously. By monitoring the M15, H1, H4, and D1 intervals concurrently, this utility completely eliminates multi-chart cluttering and gives traders an instant executive matrix of trend structural health on a single window. Unlike common smoothe
FREE
RSI Monitors
Jeffrey Lloyd Lauzon
MTF Relative Strength Index (RSI) Matrix (Free Advanced Momentum Dashboard) The Multi-Timeframe Relative Strength Index (RSI) Matrix is an institutional-grade technical scanner designed to evaluate momentum and overbought/oversold conditions across 4 distinct execution timeframes simultaneously[cite: 5, 6]. By monitoring the M15, H1, H4, and D1 intervals concurrently[cite: 5, 6], this utility completely eliminates multi-chart cluttering and gives traders an instant executive matrix of momentum
FREE
Williams Monitor
Jeffrey Lloyd Lauzon
MTF Williams %R Matrix (Free Advanced Multi-Timeframe Dashboard) The Multi-Timeframe Williams %R Matrix is an institutional-grade technical scanner designed to evaluate momentum extremes and key boundary dynamics across four execution timeframes simultaneously[cite: 5, 6]. By monitoring the M15, H1, H4, and D1 intervals concurrently, this utility completely eliminates multi-chart cluttering and gives traders an instant executive matrix of price relative to recent high-low ranges on a single win
FREE
RVI Monitor
Jeffrey Lloyd Lauzon
MTF Relative Vigor Index (RVI) Matrix (Free Advanced Trend Health Dashboard) The Multi-Timeframe Relative Vigor Index (RVI) Matrix is an institutional-grade technical scanner designed to evaluate directional trend vigor and conviction across 4 distinct execution timeframes simultaneously[cite: 10, 11]. By monitoring the M15, H1, H4, and D1 intervals concurrently[cite: 10, 11], this utility completely eliminates multi-chart cluttering and gives traders an instant executive matrix of trend health
FREE
Stochastic Monitor
Jeffrey Lloyd Lauzon
MTF Stochastic Matrix (Free Advanced Momentum Crossover Dashboard) The Multi-Timeframe Stochastic Matrix is an institutional-grade technical scanner designed to evaluate momentum cycles, %K/%D line crossovers, and extreme overbought/oversold boundaries across 4 distinct execution timeframes simultaneously[cite: 14, 15]. By monitoring the M15, H1, H4, and D1 intervals concurrently[cite: 14, 15], this utility completely eliminates multi-chart cluttering and gives traders an instant executive matr
FREE
CCI Trend Monitor
Jeffrey Lloyd Lauzon
MTF Commodity Channel Index (CCI) Matrix (Free Advanced Trend Scanner Dashboard) The Multi-Timeframe Commodity Channel Index (CCI) Matrix is an institutional-grade technical scanner designed to evaluate cyclical trend momentum and structural threshold breakouts across 4 distinct execution timeframes simultaneously[cite: 18, 19]. By monitoring the M15, H1, H4, and D1 intervals concurrently[cite: 18, 19], this utility completely eliminates multi-chart cluttering and gives traders an instant execu
FREE
MTF Simple Moving Average
Jeffrey Lloyd Lauzon
MTF Simple Moving Average (Free Institutional Moving Average Overlay) The Multi-Timeframe Simple Moving Average (MTF SMA) is an institutional-grade technical utility designed to project higher-timeframe trend baselines directly onto your lower-timeframe execution charts. Developed by a C++ systems programmer specializing in high-speed MQL4 architecture, this indicator provides traders with seamless market structure visibility without requiring multiple open windows or manual chart toggling.
FREE
筛选:
无评论
回复评论