Adaptive trend metrix indicator
- 指标
- 版本: 1.1
- 更新: 18 二月 2025
- 激活: 5

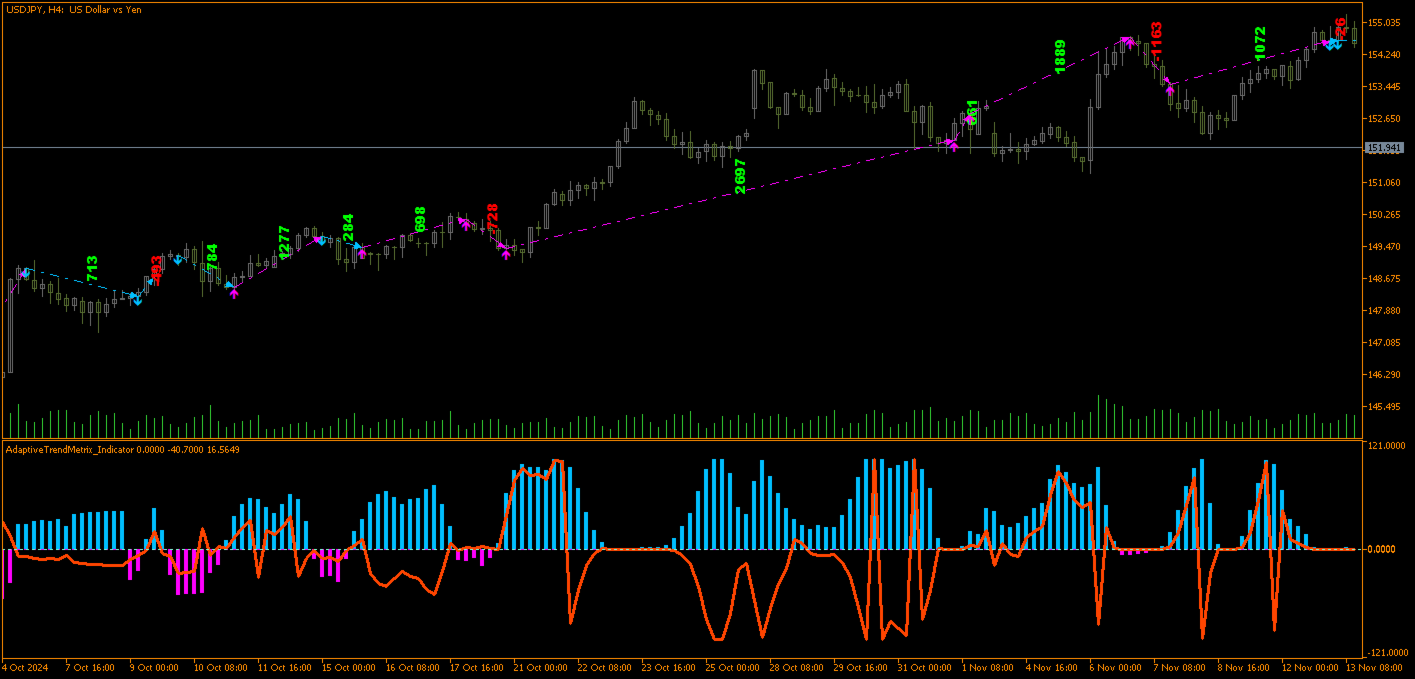
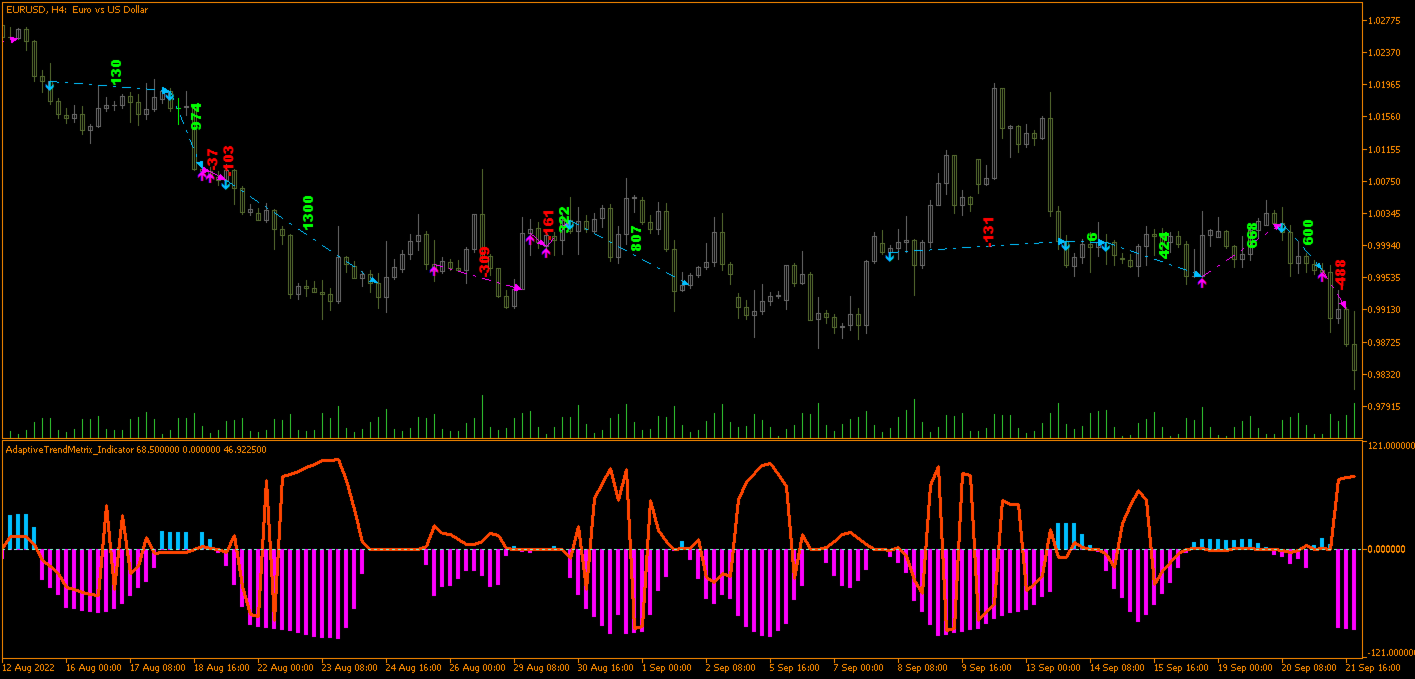
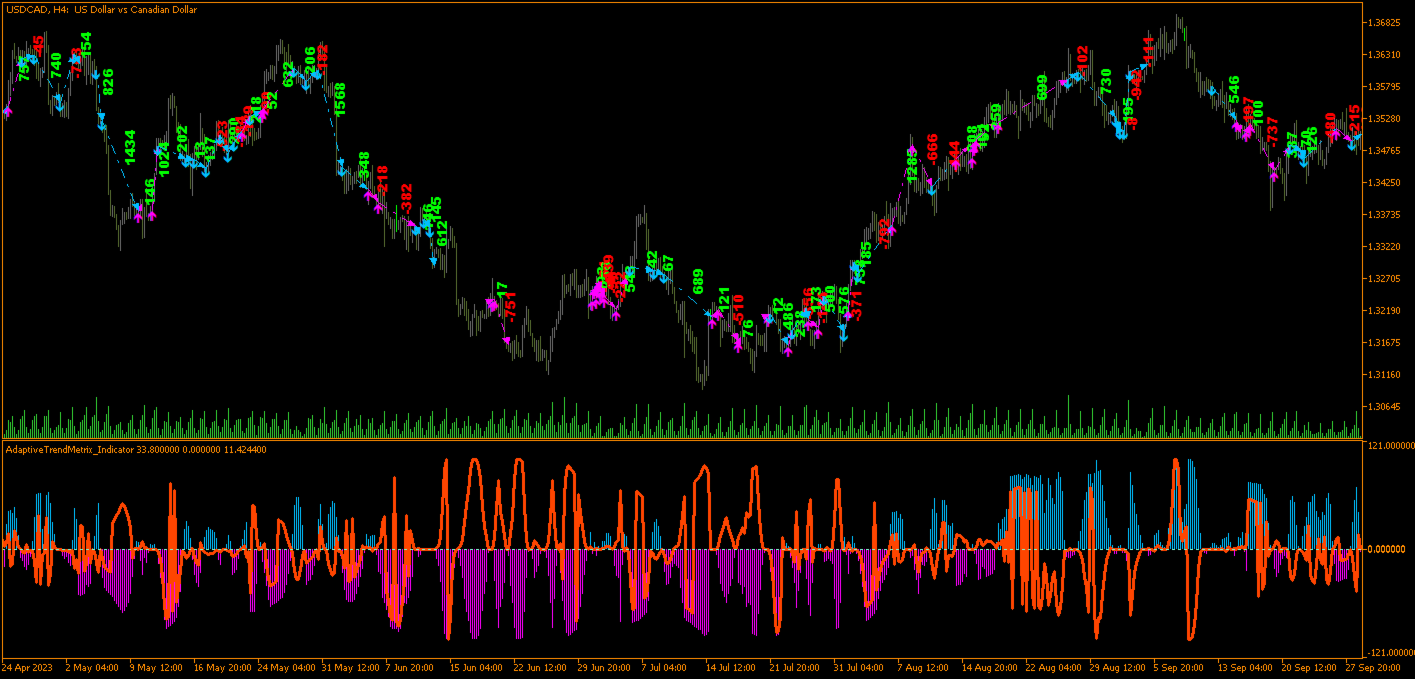
Adaptive Trend Metrix
Adaptive Trend Metrix is a fxtool for assessing the current state of the market that adapts to changes in volatility, helping to determine the direction and strength of the trend by taking into account price dynamics. One aspect of this strategy is its ability to change and use different parameters based on price behavior. For example, it takes into account the current market volatility to adjust sensitivity to price fluctuations and identify entry and exit points. Adaptive Trend Metrix aims to minimize false trading signals caused by sharp price swings.
Key features of the strategy:
-
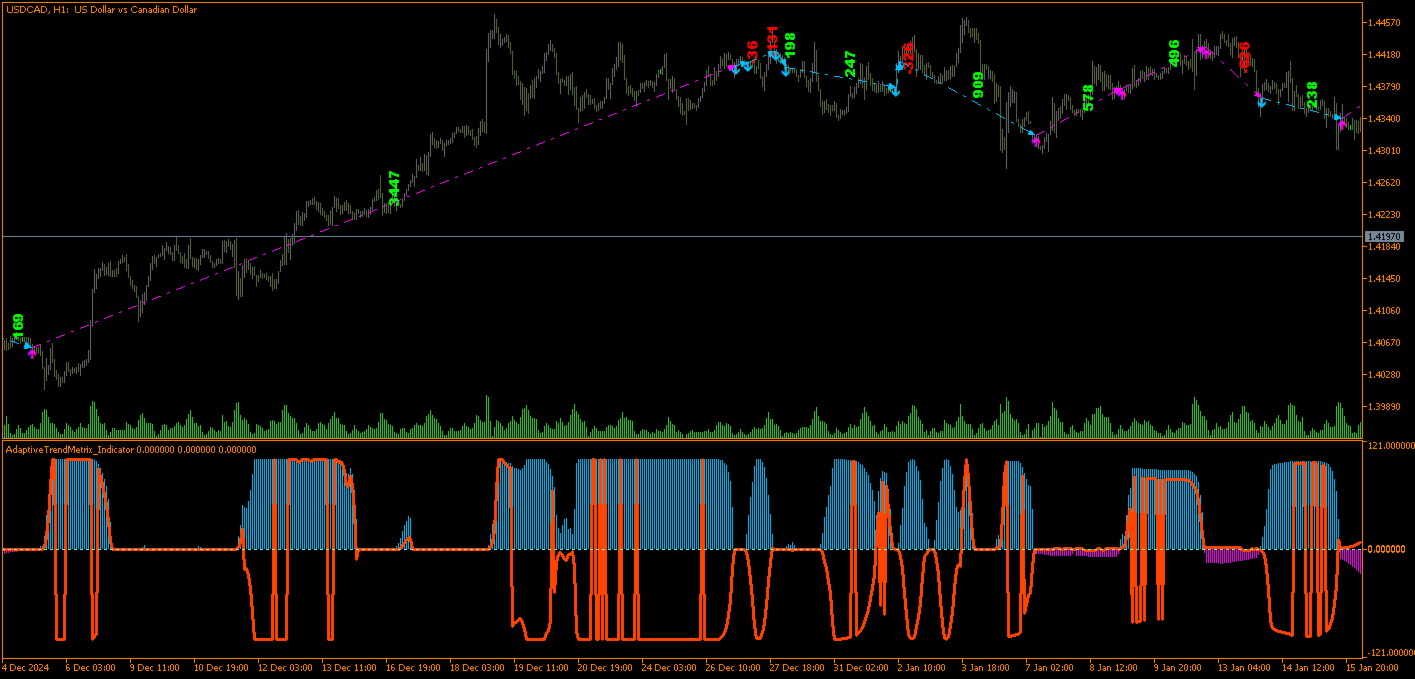
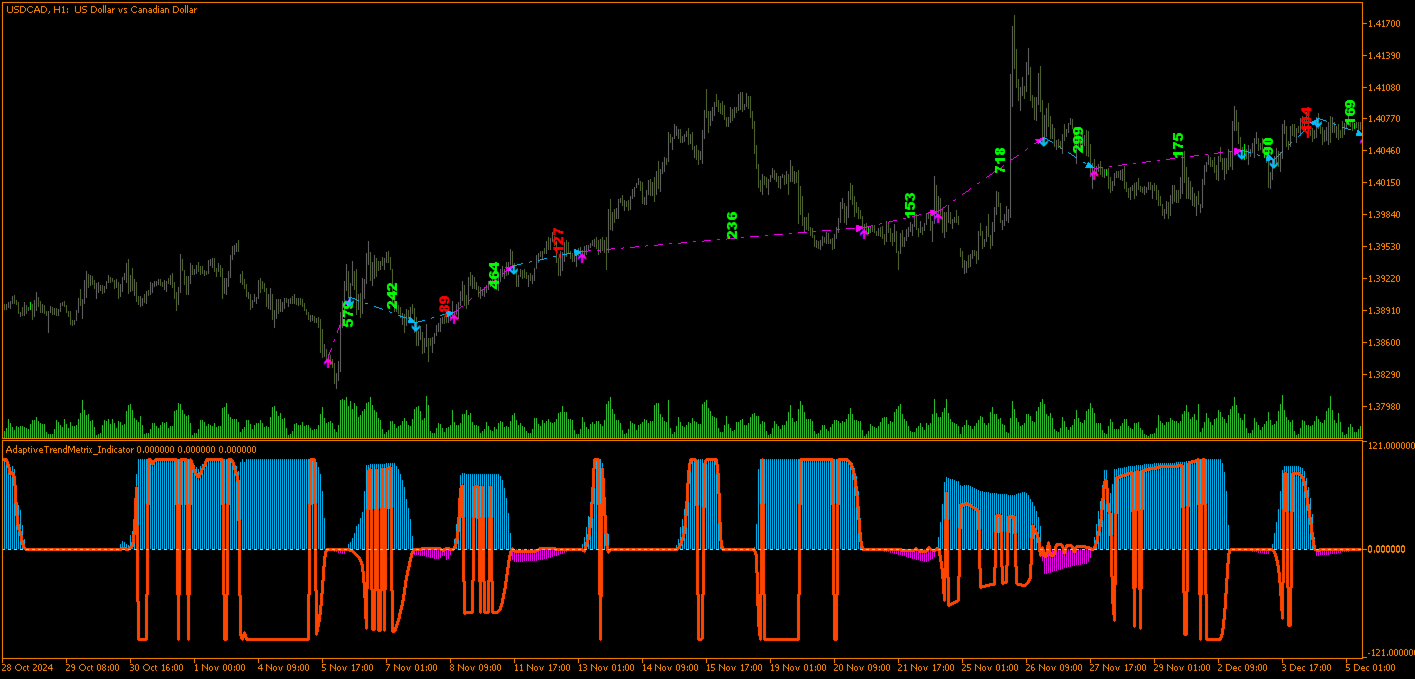
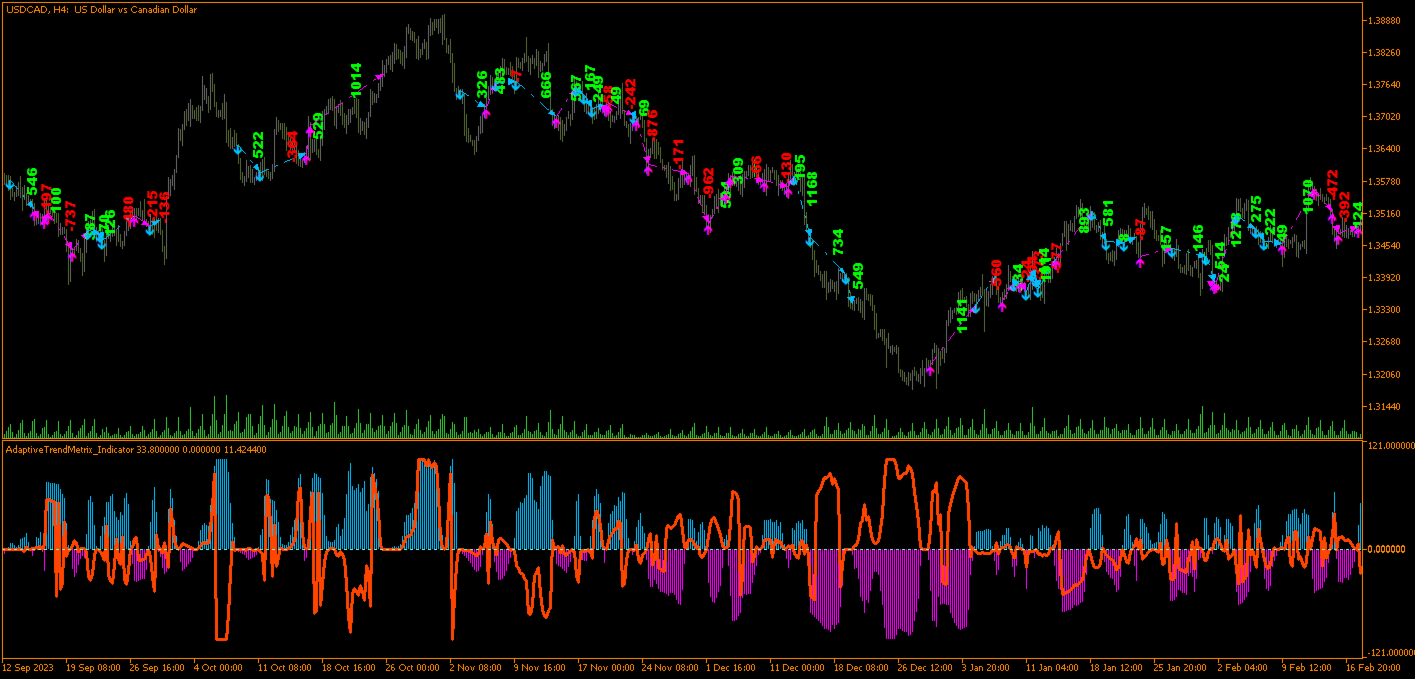
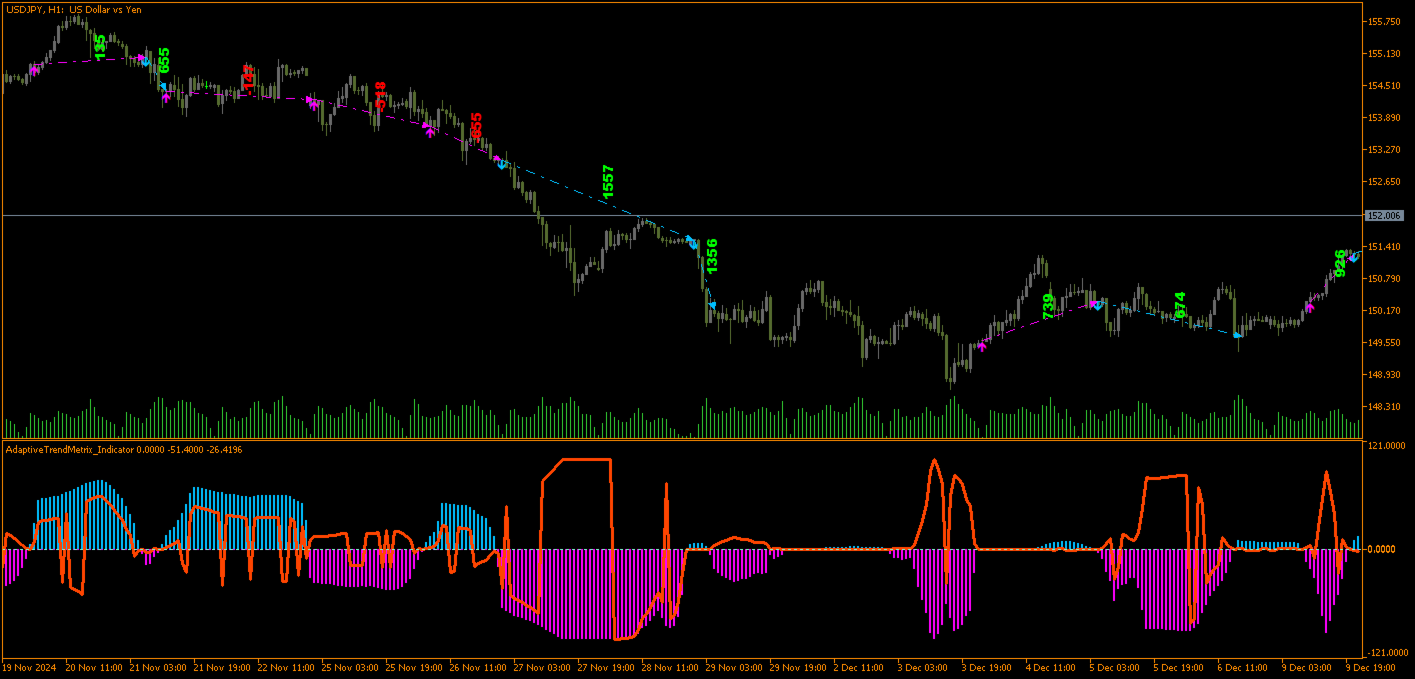
Works well with medium-volatile pairs with low spreads: USDCAD, USDCHF, and AUDUSD;
-
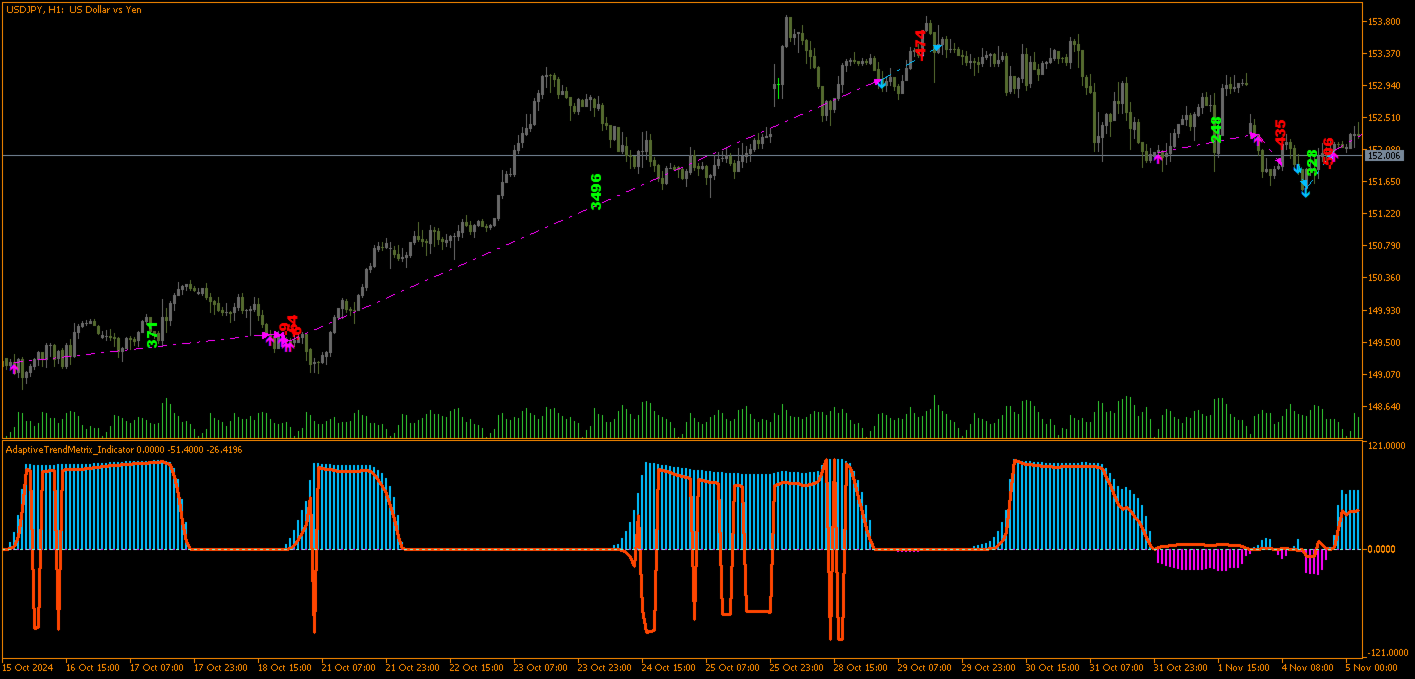
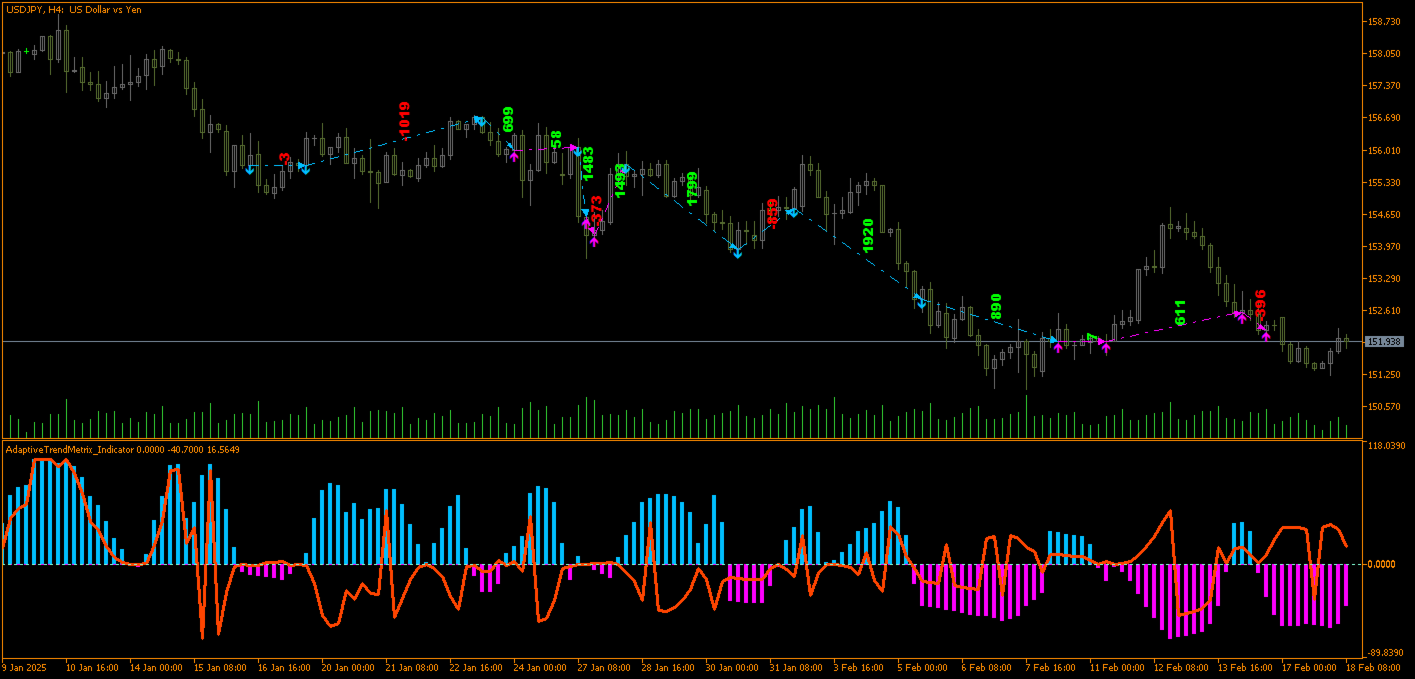
Can be used across timeframes: M30, H1, H2, H3, H4;
-
Stable performance across various time intervals: The system demonstrates good results on different timeframes, allowing you to choose an optimal interval depending on current market conditions.
-
Easy to use and configure: Intuitive settings make the advisor user-friendly for a wide range of users.
Features Identified During Testing:
-
Low drawdown levels: In many cases, the maximum drawdown remains at an acceptably low level, indicating the advisor's ability to minimize risks.
-
High recovery factor: This indicator shows the indicator’s capability to quickly recover losses, making the strategy resilient even during temporary setbacks.
-
Good correlation between profit and potential profit: This means that indicator effectively utilizes market opportunities, maximizing gains from favorable price movements.
-
Variety of successful strategies across different timeframes: The system performs positively both on short and longer timeframes, enabling adaptation to varying market conditions.
-
Balanced risk-to-reward ratio: The Sharpe Ratio indicates a good balance between risk and potential return. This means the system operates with a reasonable level of risk while delivering stable results even amidst market uncertainty.