Old School Reversal Zones

I'll keep it Short and to the point.  Let Your Backtest Results Speak for Themselves.

After much deliberation, we’ve decided to release the foundational logic behind our process for public use.
This isn’t about changing the way you trade—because we know that’s unique to you. The best ways to enter a position? Those have always been confidential !

What we can share is the first of three essential steps we use before entering any trade.

This tool is designed to keep you on the right side of the markets—ALWAYS.

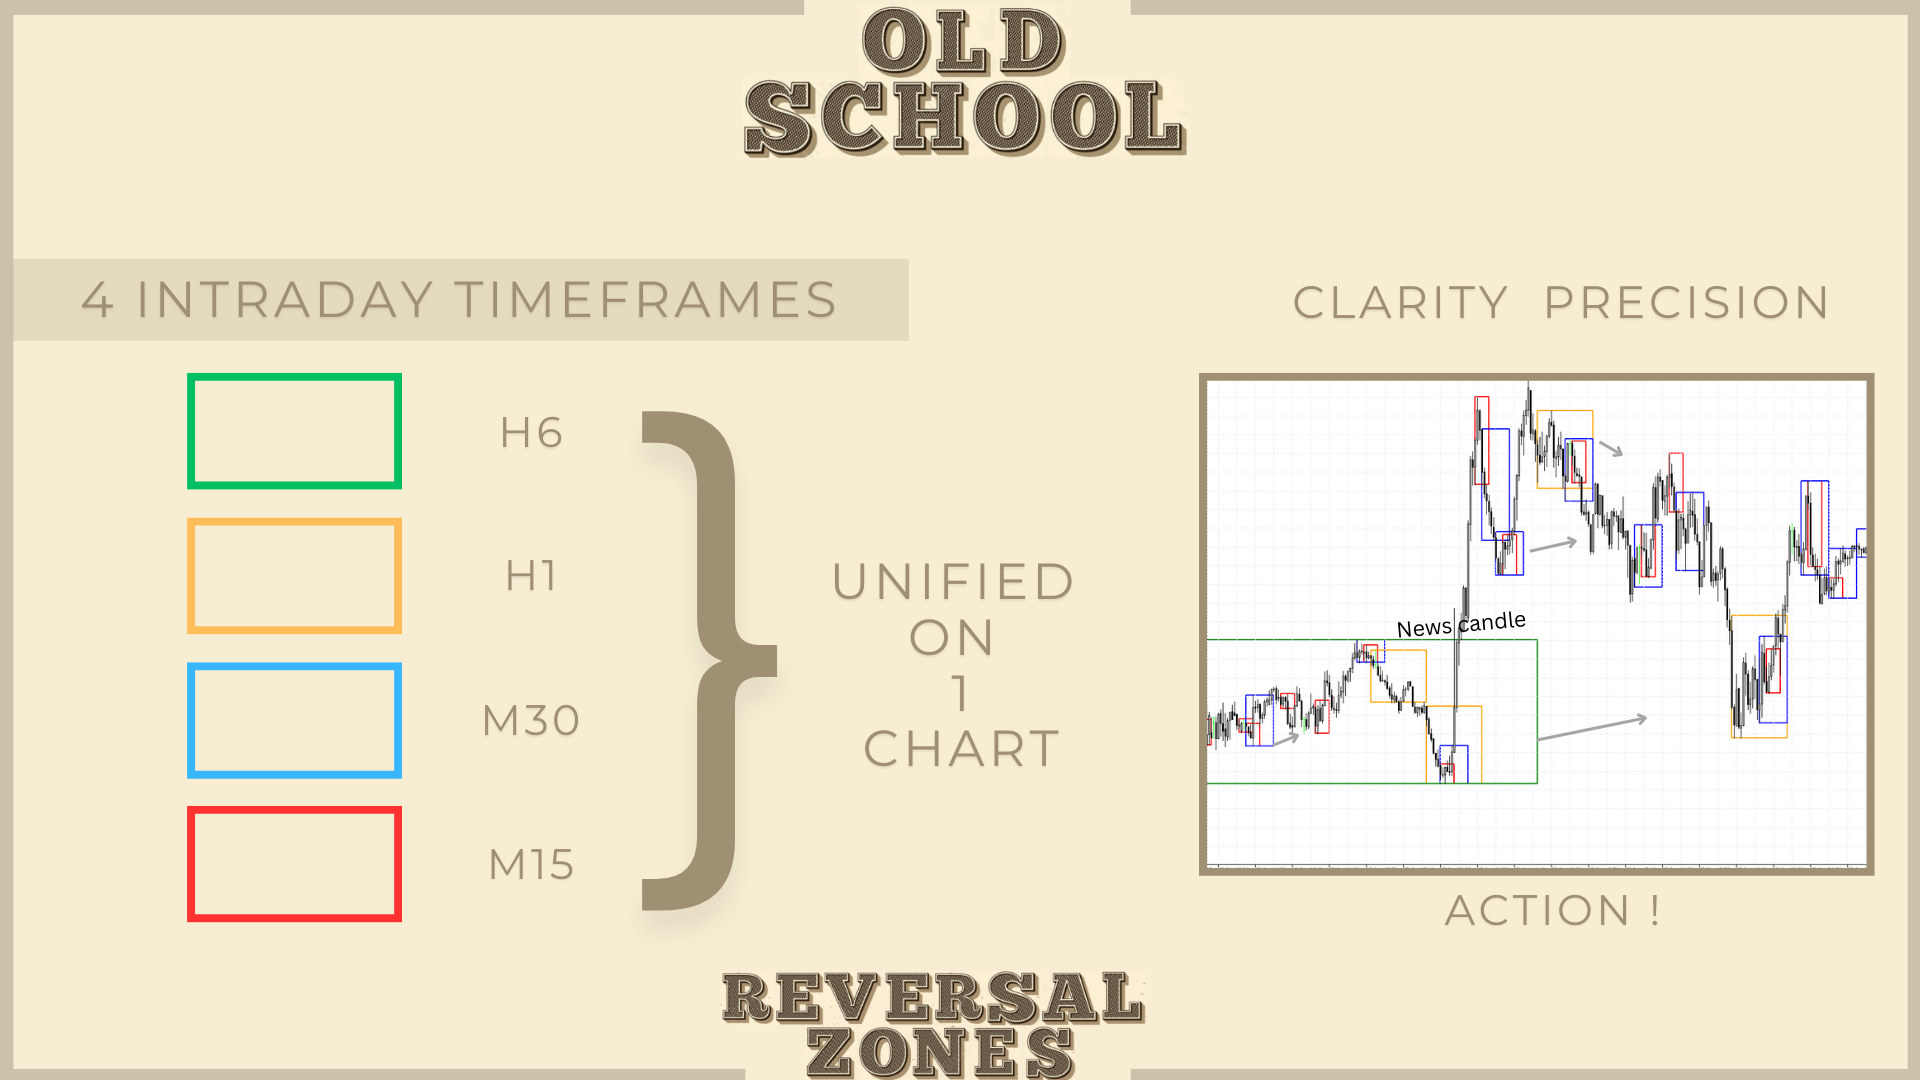
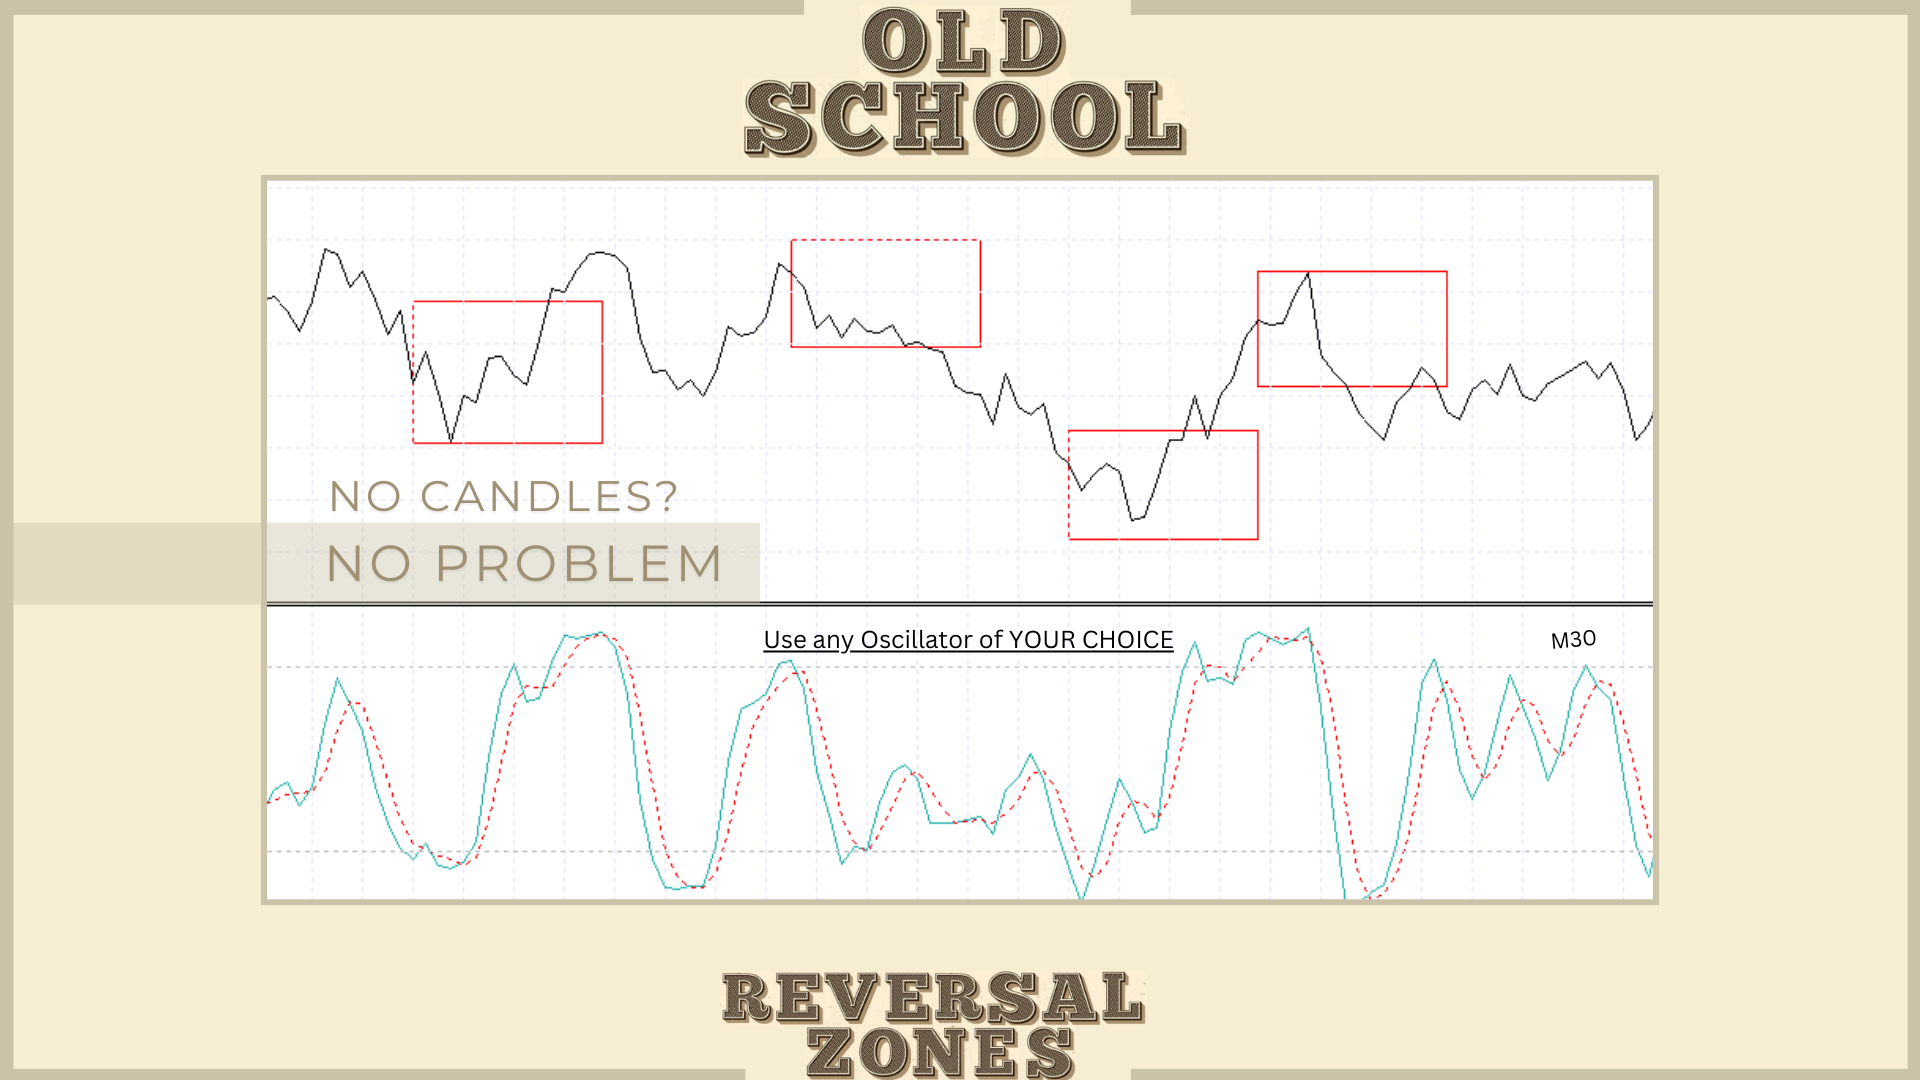
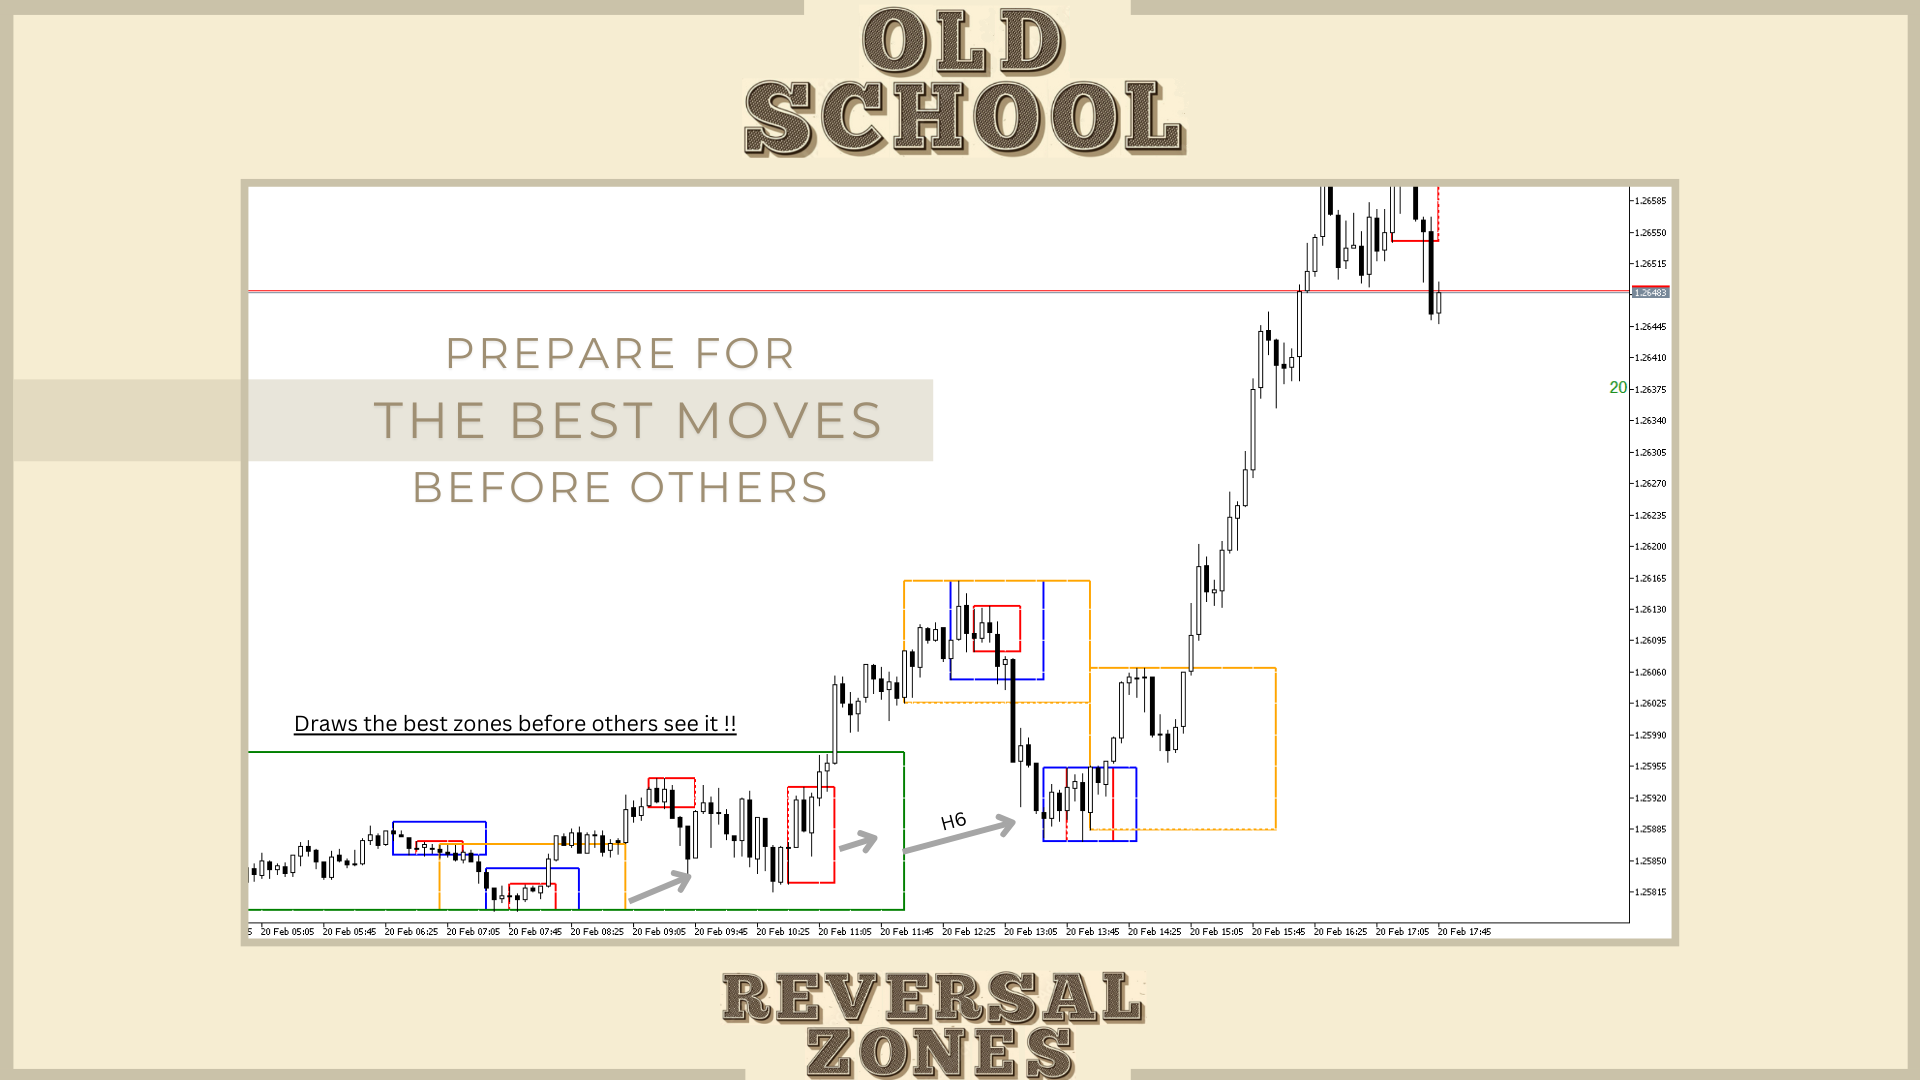
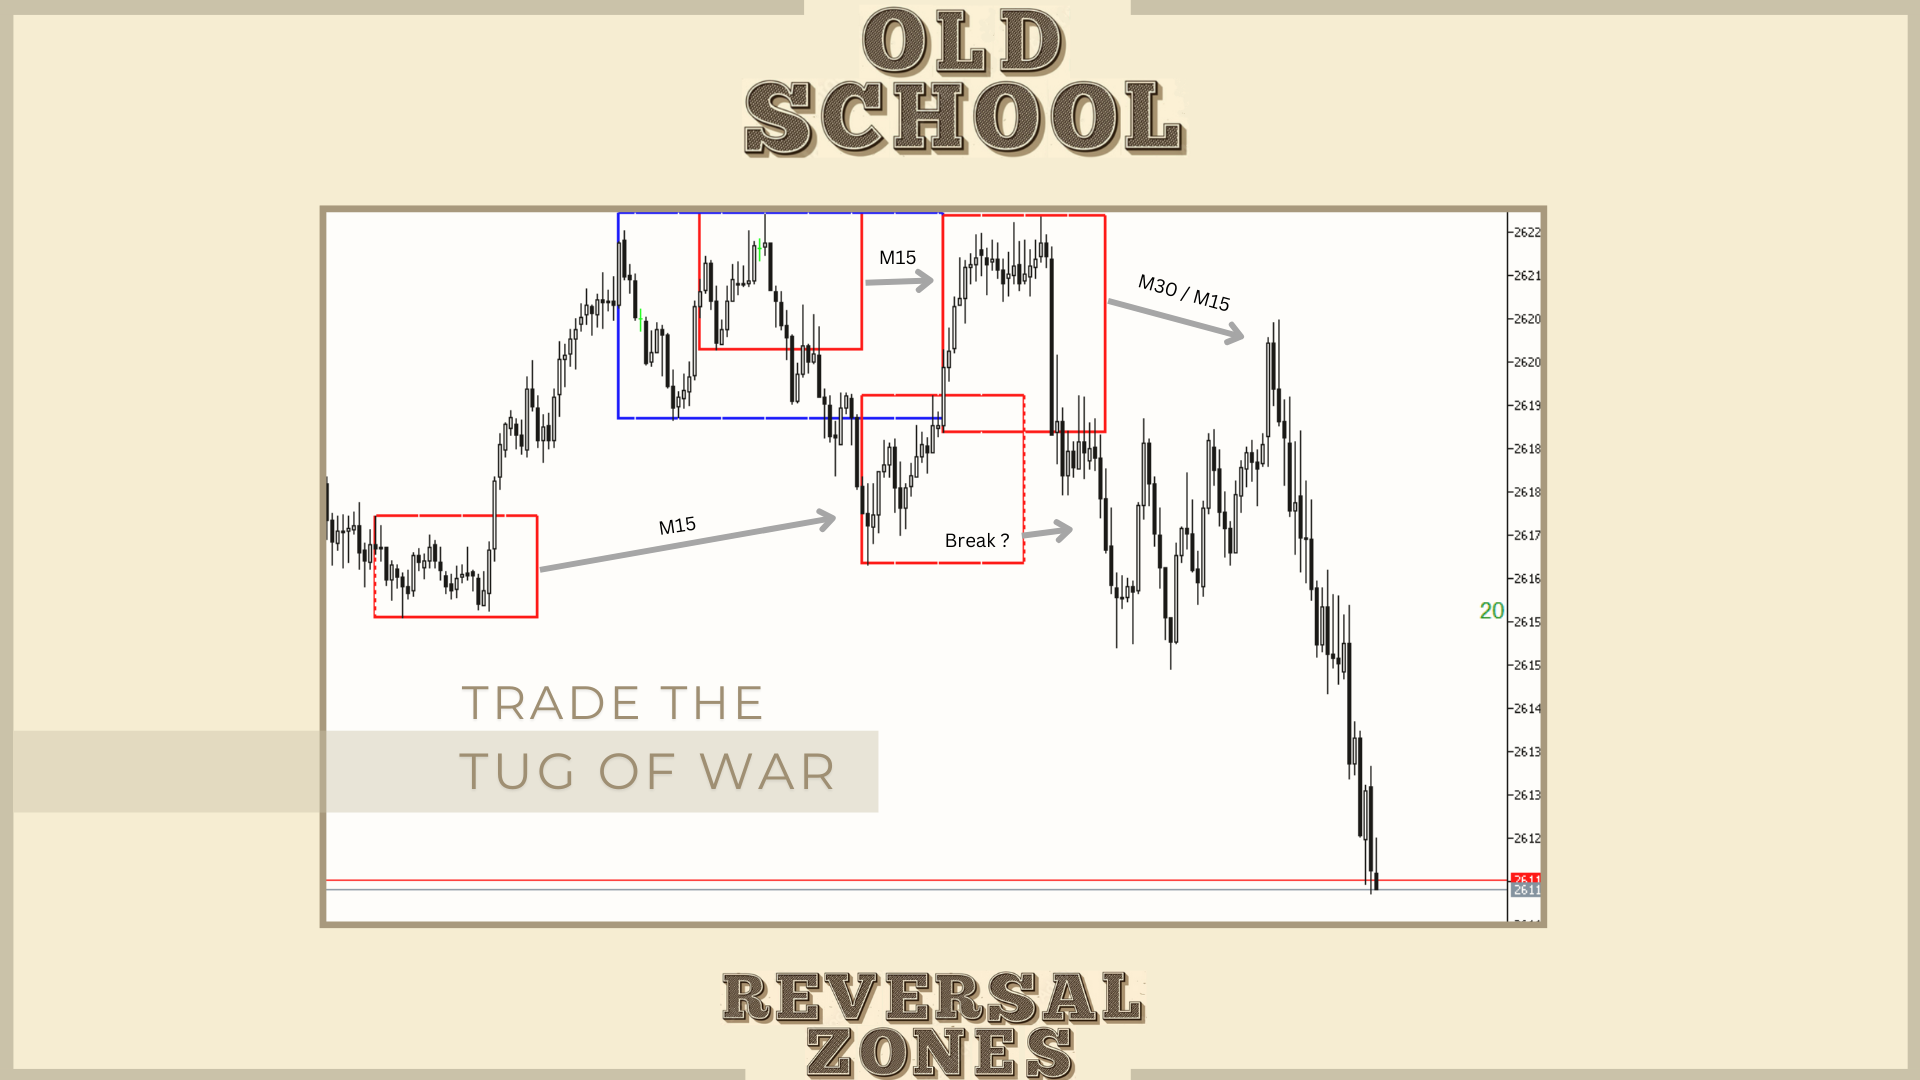
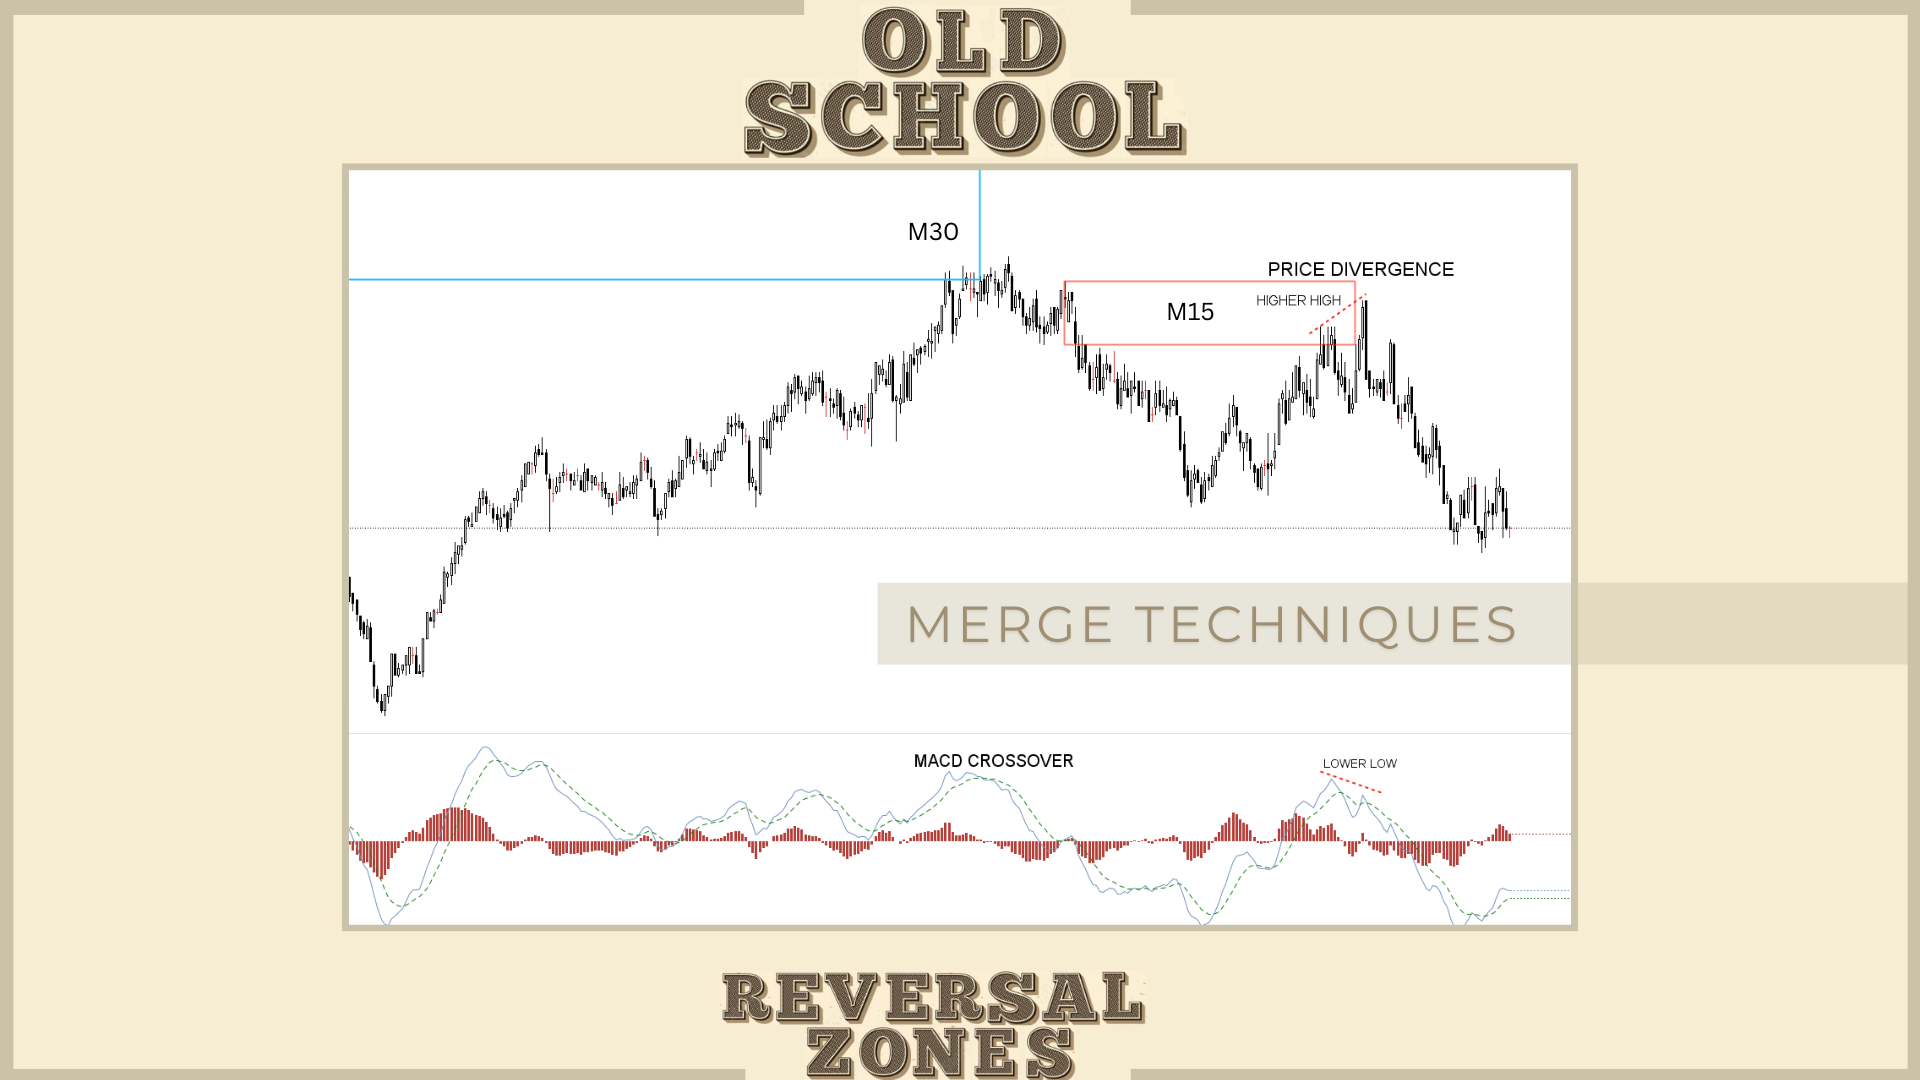
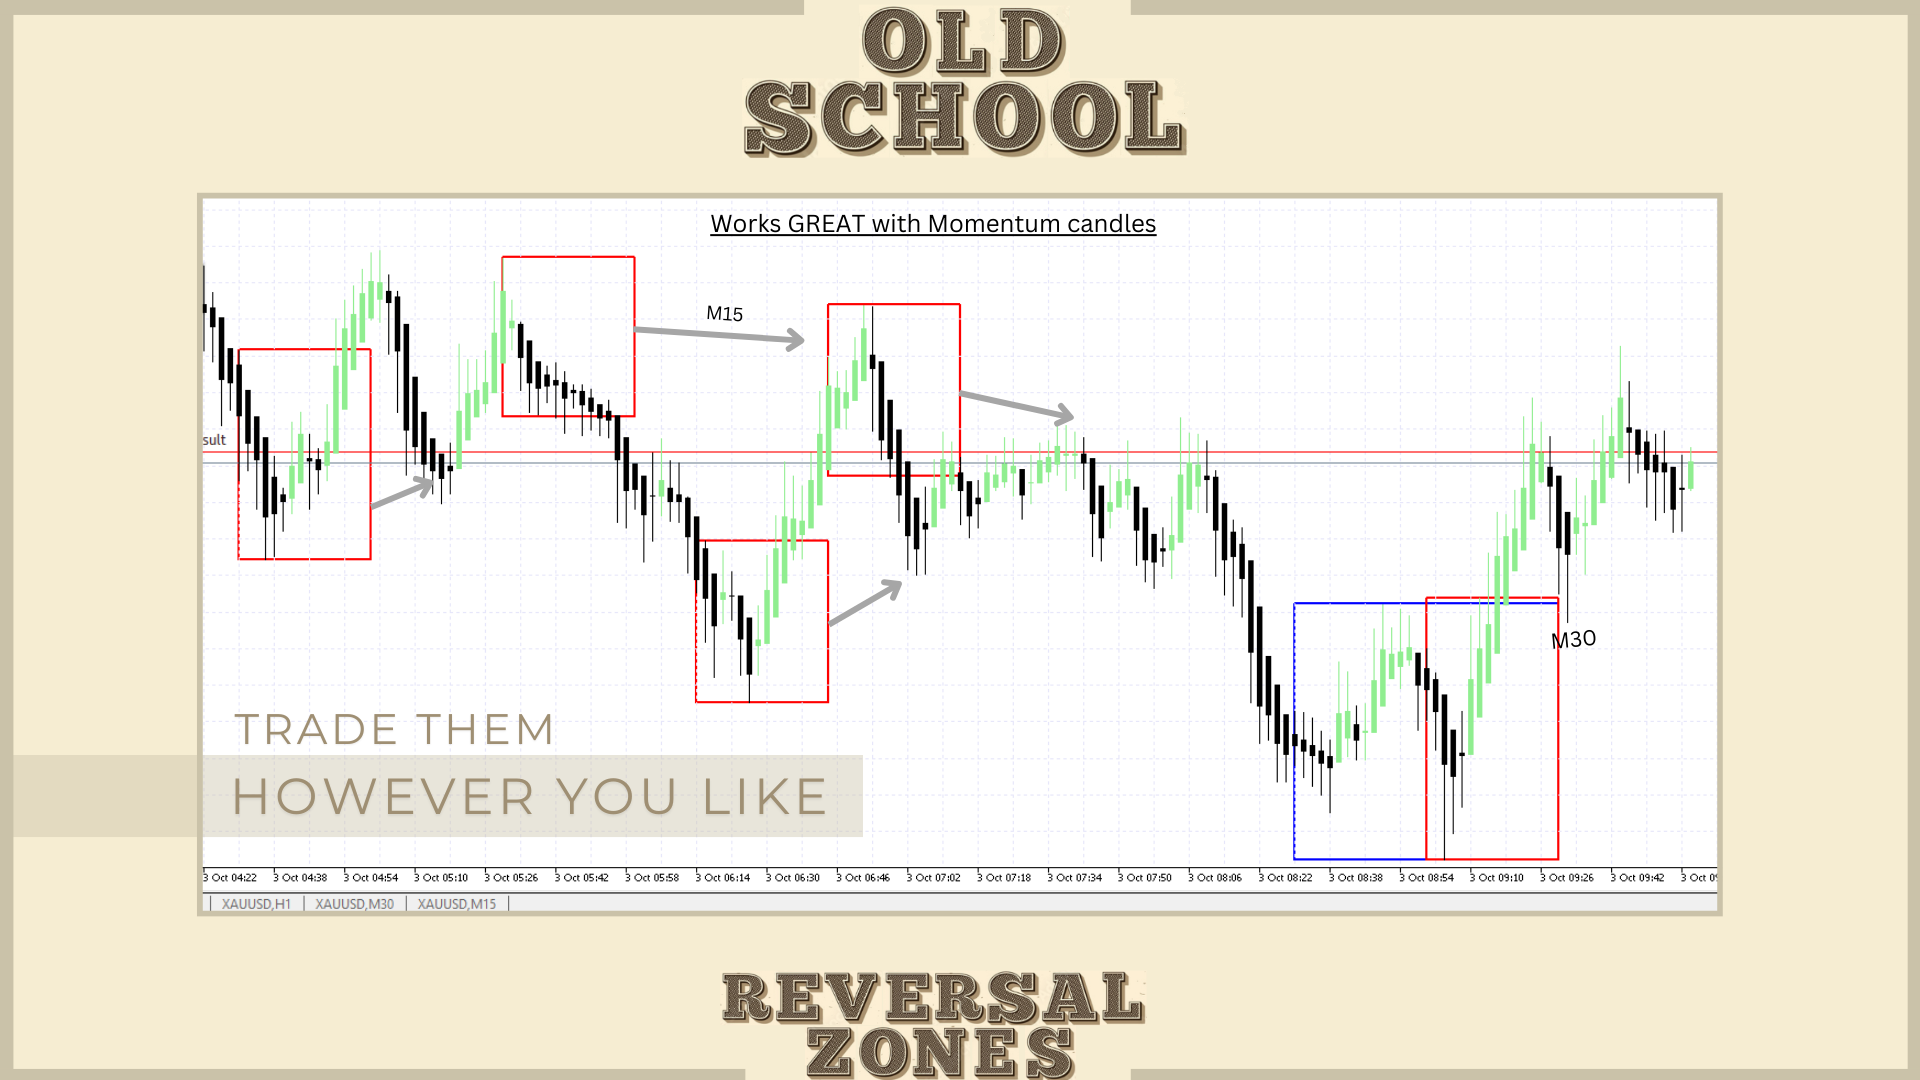
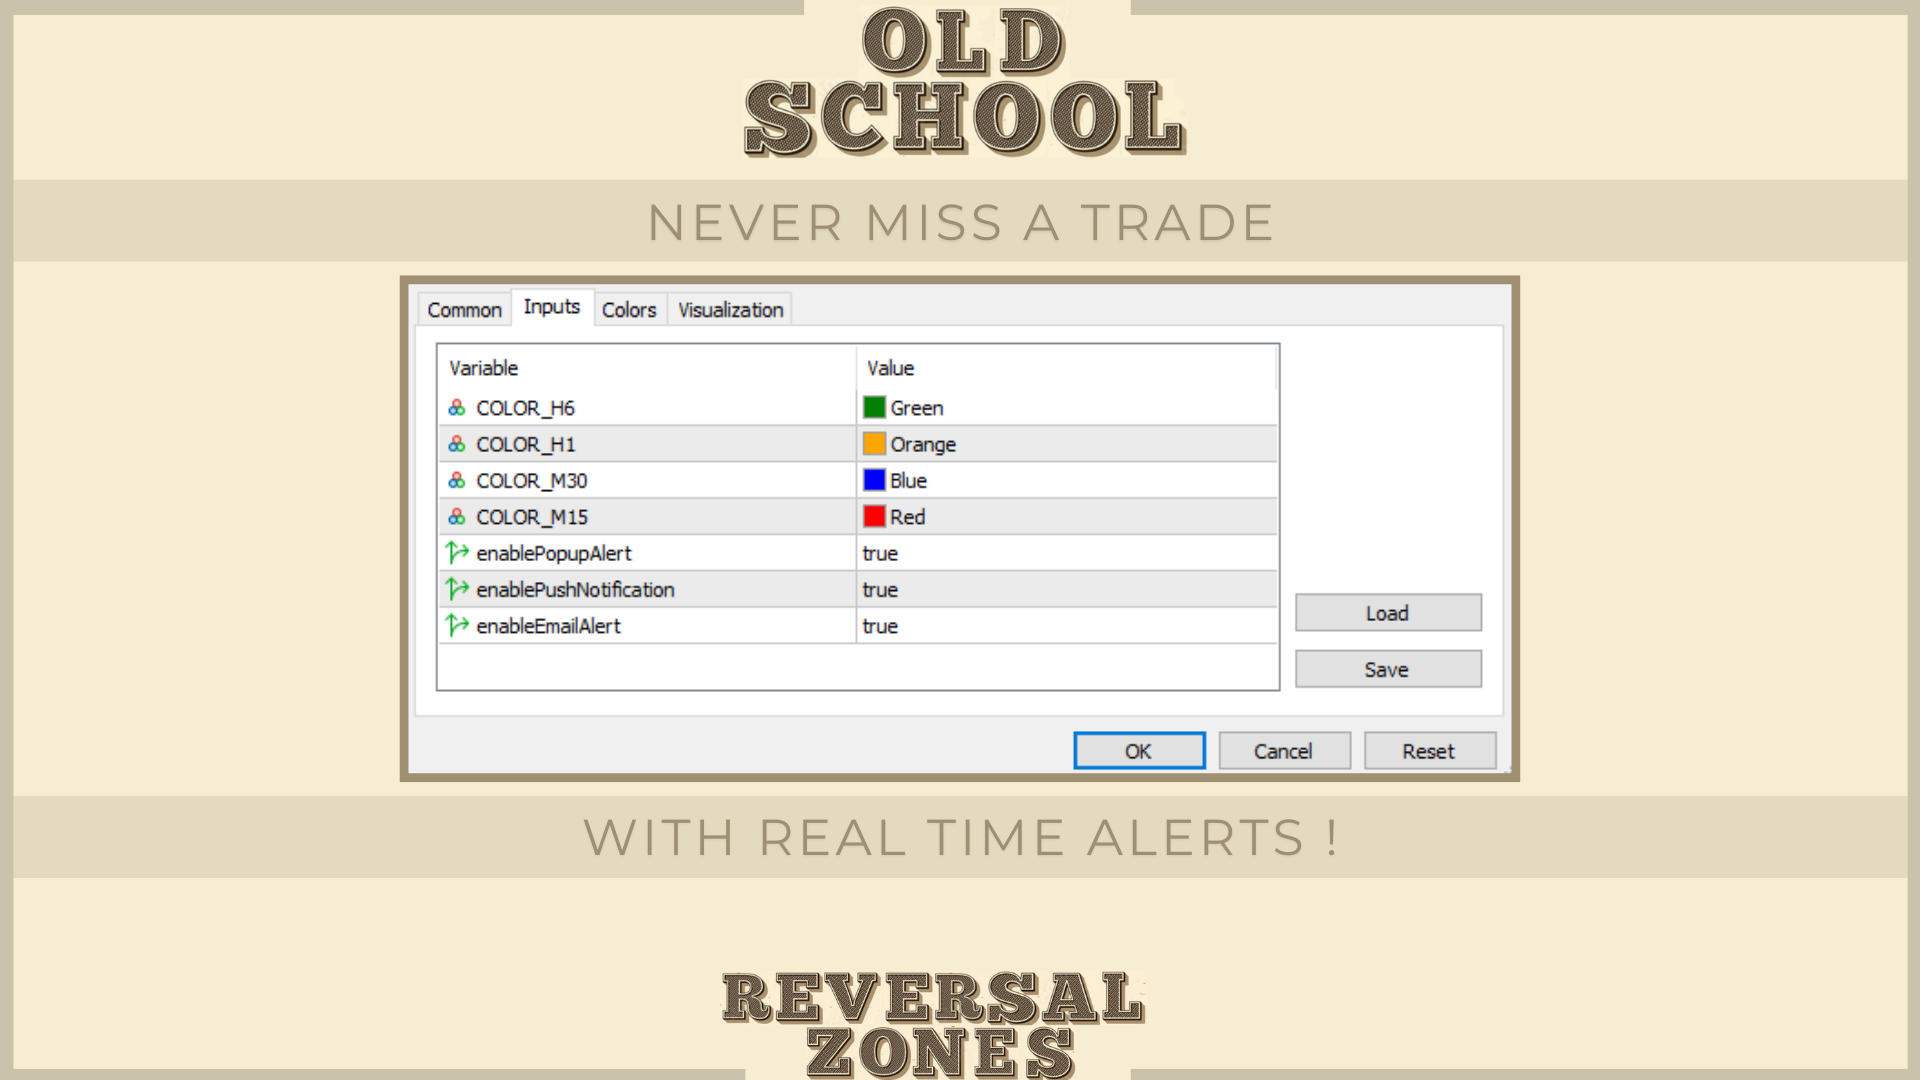
It works relentlessly, scanning every tick in real time, identifying reversal zones the old, proven way on the most critical intraday timeframes: M15, M30, H1, and H6.
Yes, H6, not H4. Forget the overhyped H4 timeframe—it’s been misrepresented for the masses. The true quarterly daily timeframe is H6, dividing the 24-hour cycle into its proper quarters.

Say goodbye to subjective guesswork.
Let this tool do the heavy lifting—for you, the CORRECT WAY.

Stay on the right side of the market, my friend.
Trade smarter. 
All the best with the backtest. We hope you find all the answers you are looking for.



推荐产品
GDS Renko Pip ST Chart - Pip-Based Renko Chart Indicator for MetaTrader 5 GDS Renko Pip ST Chart is a pip-based Renko chart indicator for MetaTrader 5. It helps traders build and study cleaner Renko price movement using a practical fixed pip or point-based brick structure. This tool is designed as a Renko chart foundation for manual analysis. It does not predict the market, does not generate buy or sell signals and does not decide whether a trade should be opened. Renko EDGE EA Golden Delta | A
RBreaker
Zhong Long Wu
RBreaker Gold Indicators 是黄金期货一种短线日内交易策略,它结合了趋势跟踪和日内反转两种交易方式,既能捕捉趋势行情的利润,又能在行情反转时及时止盈并顺势反手。 该策略曾连续15年被美国《Futures Truth》杂志评选为前十大最赚钱的交易策略之一,具有很长的生命周期,至今仍在国内外普遍使用与研究。 本指标结合了2026年期货黄金的走势,依据14日ATR指标,分别定义了突破系数A,观察系数B,反转系数R更合理的数值,非常不错的指标,已实现年稳定盈利,值得推荐~ 以上指标适合高波动品种,参数适合期货黄金,股指期货等,如果需要其他品种行情,需要单独设定 突破系数A,观察系数B,反转系数R,进行回测才能使用。 欢迎指标售后有问题可以加+V:504282029
Manyal trading system, CovEchoTrend Robot, focuses on reliability and flexibility. By employing statistical analysis methods to study the relationships between the base indicator and market patterns, the system enables a deeper understanding of market processes. Intelligent pattern analysis: The application of statistical data processing helps identify key trend reversal points more accurately, signaling significant market shifts. Informed decision-making is based on the intersection of indicato
CosmiCLab FIBO
Kirils Subins
CosmiCLab SMC FIBO CosmiCLab SMC FIBO is a professional trading indicator designed for traders who use Smart Money Concepts (SMC), market structure analysis and Fibonacci retracement levels. The indicator automatically detects market swings and builds Fibonacci levels based on the latest impulse movement. It also identifies market structure changes such as BOS (Break of Structure) and CHOCH (Change of Character), helping traders understand the current market direction. CosmiCLab SMC FIBO also pr
Enigmera MT5
Ivan Stefanov
3.67 (3)
Enigmera 是一款用于 MetaTrader 5 的手动指标与交易系统。它利用分形周期计算支撑与阻力位,标记积累阶段,并绘制当前走势的方向与目标。该分析在趋势行情与回调行情中均适用。 该指标通过图表上的按钮手动操作。可以在 MetaTrader 策略测试器的可视模式下运行,在购买前查看它在历史数据上的表现;部分由按钮控制的功能在测试器中的表现可能与实盘图表不同。 工作原理 指标根据品种的分形周期推导出当前趋势的支撑线、支撑线周围的允许偏离通道、三个偏离水平以及目标线。支撑线定义了市场状态:价格保持在其上方时趋势延续,跌破该线则表示趋势改变。已经绘制的线条不会重绘。 大部分功能通过图表左侧的按钮控制,因此可以在市场状况变化时快速调整显示内容。 按钮 ON/OFF:显示或隐藏整个指标。 Support:趋势的主支撑线。 Ch:启用支撑通道,显示允许的偏离范围。 Dev1:价格在支撑偏离范围内运行,表示盘整或积累。 Dev2:价格在各偏离水平之间运行,表示趋势形成及其方向。 Dev3:价格运行显示趋势加速与波动加大。 45deg:显示市场相对于 45 度线的运行速度。 Tgt:趋势的目
PatternDetector
Thien Thanh Tran
PatternScope — Multi-Pattern Recognition for MT5 PatternScope is a multi-pattern recognition indicator for MetaTrader 5. It scans price action for classic chart patterns, confirms breakouts, and draws clear   Entry, Stop Loss and Take Profit   levels. A compact dashboard shows the latest pattern, bias and Risk:Reward. Patterns:   Double Top/Bottom, Triple Top/Bottom, Head and Shoulders (and inverted), Bullish & Bearish Flag, Pennant, Rising & Falling Wedge, Triangle, Rectangle, Cup and Handle —
MercariaPattern1-2-3 відстежує рух ціни, знаходить трьоххвильові структури 1-2-3 та підсвічує момент, коли сценарій підтверджується пробоєм ключового рівня. MercariaPattern1-2-3 tracks price movement, detects three-leg 1-2-3 structures and highlights the moment when the scenario is confirmed by a key level breakout. Індикатор збирає локальні свінги в компактну фігуру 0–1–2–3 , чекає підтвердженого пробою та будує стрілку входу з готовими рівнями SL/TP. The indicator combines local swings into a
该指标的独特优势在于其基于 Arjo 设计和开发的“公允价值缺口理论”。Arjo 是一位顶尖的导师,而我本人则在此基础上进行了开发完善。该系列视频将包含完整的 YouTube 链接,提供详尽的讲解,并附有编译后的 MT4/MT5 系统运行的截图。 所有发布的系统都将分别提供 MT4 和 MT5 版本,以满足不同平台和用户的需求。 所有购买该系统的 100 位客户都将获得一项额外福利:购买 Pine 脚本工具后,即可在 Trading View 上免费使用该系统。 链接: https://youtu.be/gT5SFdwIYC0?si=L_ldI4E_pCx4gVhL 您将获得: 1. 根据链接中的说明,自动检测并绘制看涨/看跌公允价值缺口框。 2. 隐蔽突破缺口信号 3. 突破缺口信号 4. 推送(通知)提醒指标(可选) 5. 该系统适用于所有时间周期。推荐时间周期:15分钟、1小时、4小时和日线。 总结:这仅仅是我们征程的开始,我们将根据用户需求定期更新更多功能、开发和升级,欢迎随时评论或私信我们提出任何问题。很遗憾,我们目前不提供演示下载,但我们保证,为了满足所有用户的需求,我们
GANN Master 为当前的日、周或月绘制江恩(W. D. Gann)平方根水平,并标出买方与卖方目标相遇的区域。水平由上一周期的最高价和最低价计算,在整个周期内保持不变,不会重画。 水平如何构建 上一周期的最高价成为 TOP 线,其最低价成为 BOTTOM 线。指标从 TOP 向下量出三个看跌目标(Bears' interest 1、2 和 3),从 BOTTOM 向上量出三个看涨目标(Bulls' interest 1、2 和 3),使用江恩的平方根步长 1/8、2/8 和 3/8。 江恩计算始终需要一个比例。GANN Master 会自行选择:它尝试每一个比例,并保留使看涨线与看跌线彼此最接近的那一个。当一条看跌线与一条看涨线相互靠近时,双方的利益就在此相遇。指标把这些位置着色为共同利益区域。每个周期最多绘制五个区域。 每个区域周围有两条虚线的区域突破线,位于该区域上方和下方,距离为 TOP-BOTTOM 区间的 1/8。TOP 和 BOTTOM 周围也有一条同样大小的着色带。 图表上显示的内容 TOP 与 BOTTOM、六条江恩线及其名称,显示在当前K线的右侧 当前日、周或
PZ Mean Reversion MT5
PZ TRADING SLU
1 (1)
采用专业和量化方法进行均值回归交易的独特指标。它利用了价格以可预测和可衡量的方式转移并返回均值这一事实,这允许明确的进入和退出规则大大优于非量化交易策略。 [ Installation Guide | Update Guide | Troubleshooting | FAQ | All Products ] 清晰的交易信号 非常容易交易 可定制的颜色和尺寸 实现性能统计 优于大多数交易策略 显示合适的止损和止盈水平 它实现了电子邮件/声音/视觉警报 这个怎么运作 该指标从更高的时间范围测量完全可定制的移动平均线的标准偏差,并使用趋势跟踪方法精确地找到交易。交易是通过深入当前图表的价格行为发现的,并在价格返回到平均价格区间时关闭,根据您选择的更高时间范围计算。由于其编码方式,该指标将远离高波动性和强劲趋势市场,并且仅在可预测的情况下进行交易,在可接受的波动性与方向性比率范围内,回归均值是可行的。 指标剖析 绿线是更高时间范围内的移动平均线(也就是平均值) 虚线区域是移动平均线周围的典型价格区间 蓝线是看涨交易的突破价格 红线是看跌交易的突破价格 交易是针对均值进行的,并在典型的价格
Structure King AI Signal
Shingala Gautamkumar
Structure King AI Signal Structure King AI Signal is a professional MetaTrader 5 trading indicator designed to help traders analyze market structure, trend direction, multi-timeframe confirmation and trade management from one clean dashboard. Key Features • Market Structure & Trend Analysis • BUY / SELL Signals • Multi-Timeframe (HTF) Confirmation • Entry Price Levels • Dynamic Stop Loss (SL) • TP1 / TP2 / TP3 Levels • ATR Volatility Analysis • ADX Trend Strength Filter • Adaptive Market Filter
Blahtech Market Profile MT5
Blahtech Limited
5 (10)
Was: $249  Now: $99   Market Profile defines a number of day types that can help the trader to determine market behaviour. A key feature is the Value Area, representing the range of price action where 70% of trading took place. Understanding the Value Area can give traders valuable insight into market direction and establish the higher odds trade. It is an excellent addition to any system you may be using. Inspired by Jim Dalton’s book “Mind Over Markets”, this indicator is designed to suit the
GDS Renko Entry Helper - Free Renko Price Interaction Indicator for MetaTrader 5 GDS Renko Entry Helper is a free Renko price interaction indicator for MetaTrader 5. It helps traders highlight important areas where price reacts, slows down, returns to a zone or changes behavior around support and resistance. The tool is designed for manual Renko analysis. It does not generate buy or sell signals and does not tell the trader when to enter the market. Its purpose is to help focus attention on area
Volume flow Profile
Israr Hussain Shah
大师版是一款专业级的分析工具,旨在通过成交量和资金流向的视角来可视化市场结构。与标准的成交量指标不同,该工具直接在图表上显示每日成交量分布,让您准确看到价格发现发生的位置以及“聪明钱”的定位。 此大师版专为清晰度和速度而设计,具有独特的自动主题同步系统,加载后即刻美化您的图表布局。 主要特点: 真实资金流向计算: 超越标准的跳动量。启用“Use Money Flow”时,成交量按价格加权,揭示了特定价格水平的实际资金投入。 价值区域 (VA) 可视化: 自动计算价值区域(默认为成交量的70%)。 VA填充: 为价值区域背景着色,以便即时识别控制区域。 关键水平: 清晰标记控制点 (POC)、价值区域高点 (VAH) 和价值区域低点 (VAL)。 专业标记系统: 扫描概况结构以识别关键交易区域: HVN (高成交量节点): 接受和盘整区域(支撑/阻力)。 LVN (低成交量节点): 拒绝区域或“快速通过”区域。 所有标记均向右绘制延长线,便于监控。 Delta 背离(左侧直方图): 左侧直方图可视化每个级别的买卖压力对比。这有助于识别隐藏的背离——即价格可能上涨,但卖家在这些水平上激进打
Volume Profile Multiple — 多区块成交量分布指标,带缓冲区数据接口,支持算法交易 还在为每次切换周期都要重新绘制、重新计算成交量分布图而烦恼吗? Volume Profile Multiple 可在图表上自动绘制多个连续的成交量分布区块,揭示机构资金在市场各个阶段的真实活动区域——而不仅仅局限于最近可见的价格区间。 功能说明 该指标将历史价格按每 N 根K线划分为若干区块(区块数量和每区块的K线数量均可自定义),并为每个区块计算完整的成交量分布数据:控制点(POC)、价值区上下沿(VAH/VAL),以及高成交量节点和低成交量节点(HVN/LVN)。最终呈现的是一幅逐区块的市场结构可视化地图,便于识别基于真实成交量的筹码集中区、支撑阻力位,以及价格在不同价值区之间的轮动情况。 同样为算法交易而设计 与大多数成交量分布指标不同,本指标不仅提供可视化功能:它还输出 3个数据缓冲区 (最新区块的 POC、VAH、VAL),完全兼容 StrategyQuant X 以及任何 MQL5 智能交易系统(EA)。这意味着您可以直接基于这些关键价位构建交易策略,无需重新编写成交量
Fibonacci Projection Volume Delta Profile Combine Fibonacci-based price projections with volume delta analysis to see where buying and selling pressure concentrates across key retracement zones. This indicator automatically detects swing highs and lows, plots retracement levels, and projects forward price targets using Fibonacci extensions — while overlaying a volume delta profile that shows the balance of bullish vs. bearish volume within each Fibonacci band. Use it to spot high-probability rev
FREE
JTC Smart Gold Indicator is a professional trading indicator designed exclusively for the XAUUSD (Gold) 5-minute timeframe on MetaTrader 5. It focuses on identifying high-quality trading opportunities during the New York session while helping traders maintain a disciplined and structured trading approach. Unlike indicators that generate excessive signals, JTC is designed to prioritise quality over quantity, typically highlighting a small number of carefully selected opportunities during active
PZ Trend Trading MT5
PZ TRADING SLU
3.8 (5)
许多盈利交易者不仅知道如何识别市场趋势,而且也能把握趋势建立后的交易机会。 Pz 趋势交易 指标设计用来在趋势行情中尽可能的赚取利润。 已建立的趋势提供了一揽子交易机会,但大多数趋势交易指标完全忽视了它们,让交易者在趋势行情时完全不知道该如何做!一般趋势指标只通知有关的趋势变化,但根本不足以得到卓越的回报. Pz 趋势交易 指标比一般趋势指标显示多达 20 倍的交易 , 因为它注重所谓的市场时机。它不仅显示当前的市场趋势,也有回调,内柱线的突破和调整。它令您在趋势回调之后介入,安全的柱线内突破金字塔加仓,以及发现潜在的反转,和已知的调整。 趋势改变 一个趋势改变在市场方向变化时发生。趋势变化在图表上用带数字的彩色圆圈显示。蓝色 (1) 信号为上涨开始, 而红色 (1) 信号为下跌开始。趋势变化并非评估当前价格动作的结果, 它意味着交易设置是不定时地。如果您正确使用本指标, 在趋势变化时, 您将将已经入场 (参看下面的调整)。 回调 但凡趋势在运动中,行情上下抖动,盈利者收割利润,且其它参与者入场。趋势回调代表好的买入机会,通常是由主力获利离场导致。如果行情在回调后回归上行, 指标将
Price Magnet — Price Density and Attraction Levels Indicator Price Magnet is a professional analytical tool designed to identify key support and resistance levels based on statistical Price Density. The indicator analyzes a specified historical period and detects price levels where the market spent the most time. These zones act as “magnets,” attracting price action or forming a structural base for potential reversals. Unlike traditional Volume Profile tools, Price Magnet focuses on price-time d
Trend and Signals MT5  indicator scans  30 trading Instruments (Forex, Metals and Indices).     It uses special algorithm on the  current market   based on   Pure Price Action   and display the overall trend and signal on the dashboard. When signals are produced the indicator sends alert and notification. Strategy for Signals This indicator uses the daily timeframe to determine the direction of the trend. The hourly timeframe is used to identify possible entries. Main trend and is determined by
Your Trend Friend
Luigi Nunes Labigalini
5 (1)
The trend is your friend! Look at the color of the indicator and trade on that direction. It does not  repaint. After each candle is closed, that's the color of the trend. You can focus on shorter faster trends or major trends, just test what's most suitable for the symbol and timeframe you trade. Simply change the "Length" parameter and the indicator will automatically adapt. You can also change the color, thickness and style of the lines. Download and give it a try! There are big movements w
Vector Fibo Scalp
Cristofher Robles
Vector Fibo Scalp is a speed and breakout-oriented intraday indicator. It monitors current price movements against daily high/low channels and provides immediate signals upon breakout confirmation. Key Features: Vector Velocity: Fast detection of daily breakouts using moving average channels. Visual candles: 4-color candle highlighting engine for active scalping states. Breakout Targets: Automatic projection of profit targets up to 161.8% Fibo ratio. R:R Panel: Dynamic calculations of risk-to-re
SMC Indicator BOS And CHoCH
Massimiliano Tuzzolino
SMC Indicator BOS & CHoCH analyze market structure using Smart Money Concepts The indicator combines BOS (Break of Structure), CHoCH (Change of Character), Fair Value Gaps (FVG), Liquidity Sweep logic and ATR filtering to provide a structured view of market movements and potential trading opportunities. The indicator automatically identifies swing highs and swing lows and monitors structural breaks in the market. BOS (Break of Structure) identifies potential continuation of the current market st
CyberTradeTHxAI Gold Sniper MT5 Professional Gold Trading Signal Indicator for MetaTrader 5 CyberTradeTHxAI Gold Sniper MT5 is a professional-grade Gold (XAUUSD) trading indicator developed to identify high-probability Buy and Sell opportunities using trend analysis, pullback confirmation, and intelligent market structure detection. Designed for both beginner and advanced traders, the indicator automatically calculates optimal Entry Zones, Stop Loss, and multiple Take Profit levels while provid
HAWK 4.0 — 黄金信号指标 最精准的交易信号指标 专为 XAUUSD(黄金)交易而设计。 基于 ATR 波段 + 枢轴点检测。 信号仅出现在真实反转点位。 不重绘。无延迟。无噪音。 您将获得 → 清晰的 BUY / SELL 箭头 → 自动 TP1 / TP2 / TP3 水平 → 自动 SL 止损水平 → 内置时间过滤器(UTC) → 实时成功率统计 → 完整的警报系统 专为以下设计 交易品种: XAUUSD(黄金) 时间周期: M3 / M5 交易时段: 伦敦 + 纽约 交易表现 成功率:       81% 不重绘:        运行时间:     2024年至今 订阅方案 1 个月  ——  $3000 3 个月  ——  $6000 6 个月  ——  $9000 包含更新 + 技术支持 + 设置文件。
ONNYX INDICATOR 版本 1.14 这是一款用于 MetaTrader 5 的供需区域分析指标。已确认的历史信号采用收盘K线逻辑,避免确认后的箭头因盘中波动而消失。指标根据确认的摆动高低点建立区域,使用 ATR 调整区域宽度,并以百分比显示区域质量。 主要功能 - 供需区域及区域内百分比评分。 - 收盘K线确认后的放大 BUY/SELL 箭头。 - 可选 EMA 趋势过滤和K线拒绝确认。 - 趋势、价格水平和市场环境面板。 - 最多显示 5 条相关经济新闻;公布前显示 Forecast 和 Previous,公布后显示 Actual。 - 新闻每 60 秒刷新,并支持策略测试器中的日历缓存。 - 弹窗、推送和邮件提醒。 - iCustom 集成:缓冲区 0 为 BUY 价格,缓冲区 1 为 SELL 价格。 使用方法 将指标加载到图表,等待历史数据完成加载,查看趋势和有效区域,然后结合自己的交易计划使用收盘K线信号。XAUUSD H1 适合更清晰的结构,M15 可获得更频繁的机会。 重要提示 本产品是分析指标,不是自动交易 EA,不会自动开仓、修改或平仓,也不保证盈利。请先
FFx Patterns Alerter gives trade suggestions with Entry, Target 1, Target 2 and StopLoss .... for any of the selected patterns (PinBar, Engulfing, InsideBar, OutsideBar) Below are the different options available: Multiple instances can be applied on the same chart to monitor different patterns Entry suggestion - pips to be added over the break for the entry 3 different options to calculate the SL - by pips, by ATR multiplier or at the pattern High/Low 3 different options to calculate the 2 TPs -
Here   our more valuable tools SMC Trend Trading   ,  Easy SMC Trading  ,  Institutional SMC Architect Volume Analysis Tools  ,  Volume flow Profile  ,  Market volume profile  , FVG with Volume  , Liquidity Heatmap Profile  ,  Volume Spread Analysis The    Liquidity Heatmap   is a sophisticated institutional trading tool designed to reveal where over-leveraged traders are trapped. By calculating estimated liquidation levels based on volume spikes and leverage, this indicator draws a dynamic "h
Trend Master V2
Oratile Pitsoane
What Is Trend Master Pro? Trend Master Pro   is a professional-grade trend trading indicator built for MetaTrader 5. It was designed with one goal in mind — to keep you on the right side of the market at all times by combining three powerful technical tools into a single, clean, easy-to-read display directly on your price chart. Instead of cluttering your screen with multiple separate indicators, Trend Master Pro fuses an   EMA Ribbon trend filter , a   ZigZag swing point engine , and a   breako
该产品的买家也购买
ARICoins
Temirlan Kdyrkhan
ARICoin is a powerful trading companion designed to generate high-probability entry signals with dynamic TP/SL/DP levels based on volatility. Built-in performance tracking shows win/loss stats, PP1/PP2 hits, and success rates all updated live. Key Features: Buy/Sell signals with adaptive volatility bands Real-time TP/SL/DP levels based on ATR Built-in MA Filter with optional ATR/StdDev volatility Performance stats panel (Success, Profit/Loss, PP1/PP2) Alerts via popup, sound, push, or email Cust
Meravith Scanner
Ivan Stefanov
5 (3)
MERAVITH SCANNER 是一款适用于 MetaTrader 5 的专业金融市场指标,将多种分析工具整合为一个统一的系统。它基于专有的成交量加权平均价格(VWAP)方法自动完成所有计算,完全消除主观判断。 该指标适用于所有资产类别(外汇、股票、指数、大宗商品、加密货币)以及从 M1 到 Monthly 的所有时间周期。其核心原理是价格跟随成交量。MERAVITH 识别机构资金成交量的集中区域,并从该集中区域中推导出数学上精确的价格水平。它不预测,不推测。它只计算。 使用 MERAVITH SCANNER,您可以在 2–3 分钟内扫描全部 28 个主要外汇货币对的所有时间周期。您也可以扫描任何您选择的市场——例如,大约 100 只股票约需 10 分钟。 该指标计算耗尽水平、平衡线、偏差、统计水平以及目标投射。 图表元素 Origin Point 标记所有计算的起始位置。指标会自动将其放置在最佳位置。红色标签(TOP)表示市场高点并带有看跌倾向。绿色标签(BOTTOM)表示市场低点并带有看涨倾向。 Sentiment Line 是一条动态曲线,反映基于成交量加权计算得出的市场情绪。
MasterTrend
Temirlan Kdyrkhan
MasterTrend Indicator for MT5 A powerful trend-following and signal-evaluation tool MasterTrend   is a custom MT5 indicator that combines Moving Averages and ATR-based risk/reward logic to generate clear buy/sell signals. It visualizes dynamic SL/TP levels, evaluates past trade outcomes, and displays win/loss statistics in a clean on-chart panel. Key features include: Buy/Sell signals based on MA crossovers ATR-based SL/TP1/TP2/TP3 levels with visual lines and labels Signal outcome tracking wit
AriX
Temirlan Kdyrkhan
1 (4)
AriX Indicator for MT5 A powerful trend-following and signal-evaluation tool AriX is a custom MT5 indicator that combines Moving Averages and ATR-based risk/reward logic to generate clear buy/sell signals. It visualizes dynamic SL/TP levels, evaluates past trade outcomes, and displays win/loss statistics in a clean on-chart panel. Key features include: Buy/Sell signals based on MA crossovers ATR-based SL/TP1/TP2/TP3 levels with visual lines and labels Signal outcome tracking with real-time stat
ScalpPoint
Temirlan Kdyrkhan
ScalpPoint is a powerful trading companion designed to generate high-probability entry signals with dynamic TP/SL/DP levels based on volatility. Built-in performance tracking shows win/loss stats, PP1/PP2 hits, and success rates — all updated live. Key Features: Buy/Sell signals with adaptive volatility bands Real-time TP/SL/DP levels based on ATR Built-in MA Filter with optional ATR/StdDev volatility Performance stats panel (Success, Profit/Loss, PP1/PP2) Alerts via popup, sound, push, or emai
PrimeScalping
Temirlan Kdyrkhan
PrimeScalping is a powerful trading companion designed to generate high-probability entry signals with dynamic TP/SL/DP levels based on volatility. Built-in performance tracking shows win/loss stats, PP1/PP2 hits, and success rates — all updated live. Key Features: Buy/Sell signals with adaptive volatility bands Real-time TP/SL/DP levels based on ATR Built-in MA Filter with optional ATR/StdDev volatility Performance stats panel (Success, Profit/Loss, PP1/PP2) Alerts via popup, sound, push, or e
Pan PrizMA CD Phase
Aleksey Panfilov
The Expert Advisor and the video are attached in the Discussion tab . The robot applies only one order and strictly follows the signals to evaluate the indicator efficiency. Pan PrizMA CD Phase is an option based on the Pan PrizMA indicator. Details (in Russian). Averaging by a quadric-quartic polynomial increases the smoothness of lines, adds momentum and rhythm. Extrapolation by the sinusoid function near a constant allows adjusting the delay or lead of signals. The value of the phase - wave s

Классификатор силы тренда. Показания на истории не меняет. Изменяется классификация только незакрытого бара. По идее подобен полной системе ASCTrend, сигнальный модуль которой, точнее его аппроксимация в несколько "урезанном" виде, есть в свободном доступе, а также в терминале как сигнальный индикатор SilverTrend . Точной копией системы ASCTrend не является. Работает на всех инструментах и всех временных диапазонах. Индикатор использует несколько некоррелируемых между собой алгоритмов для класси
FFx Universal Strength Meter PRO is more than a basic strength meter. Instead of limiting the calculation to price, it can be based on any of the 19 integrated strength modes + 9 timeframes. With the FFx USM, you are able to define any period for any combination of timeframes. For example, you can set the dashboard for the last 10 candles for M15-H1-H4… Full flexibility! Very easy to interpret... It gives a great idea about which currency is weak and which is strong, so you can find the best pai
The FFx Universal MTF alerter shows on a single chart all the timeframes (M1 to Monthly) with their own status for the chosen indicator. 9 indicators mode (MACD-RSI-Stochastic-MA-ADX-Ichimoku-Candles-CCI-PSAR). Each can be applied multiple times on the same chart with different settings. Very easy to interpret. Confirm your BUY entries when most of the timeframes are showing green color. And confirm your SELL entries when most of the timeframes are showing red color. 2 Alert Options : input to s
FFx Watcher Pro MT5
Eric Venturi-Bloxs
The FFx Watcher PRO is a dashboard displaying on a single chart the current direction of up to 15 standard indicators and up to 21 timeframes. It has 2 different modes: Watcher mode: Multi Indicators User is able to select up to 15 indicators to be displayed User is able to select up to 21 timeframes to be displayed Watcher mode: Multi Pairs User is able to select any number of pairs/symbols User is able to select up to 21 timeframes to be displayed This mode uses one of the standard indicators
FFx Basket Scanner MT5
Eric Venturi-Bloxs
MetaTrader 4 version available here : https://www.mql5.com/en/market/product/24881 FFx Basket Scanner is a global tool scanning all pairs and all timeframes over up to five indicators among the 16 available. You will clearly see which currencies to avoid trading and which ones to focus on. Once a currency goes into an extreme zone (e.g. 20/80%), you can trade the whole basket with great confidence. Another way to use it is to look at two currencies (weak vs strong) to find the best single pairs
MetaTrader 4 version available here: https://www.mql5.com/en/market/product/25793 FFx Pivot SR Suite PRO is a complete suite for support and resistance levels. Support and Resistance are the most used levels in all kinds of trading. Can be used to find reversal trend, to set targets and stop, etc. The indicator is fully flexible directly from the chart 4 periods to choose for the calculation: 4Hours, Daily, Weekly and Monthly 4 formulas to choose for the calculation: Classic, Camarilla, Fibonac
ClassicSBA
Umri Azkia Zulkarnaen
this indicator very simple and easy if you understand and agree with setup and rule basic teknical sba you can cek in link : please cek my youtube channel for detail chanel : an for detail info  contact me  basicly setup buy (long) for this indicator is Magenta- blue and green candle or magenta - green  and green candlestik and for setup sell (short) is Black - yellow - and red candle or black - red  and red candlestik
Recommended TimeFrame >= H1. 100% Non Repainted at any moment.  Use it carefully, only with Trend Direction. Trading Usage: 2 Variants: as Range System or as BreakOut System (Both Only With Trend Direction)::: (Always use StopLoss for minimise Risk); [1] as Range System: (Recommended) in UP TREND:  - BUY in Blue Line , then if price goes down by 50 points (on H1) open Second BUY.   Close in any Profit you wish: TrailingStop(45 points) or Close when Price touches upper Gold Line. in DOWN TREND
Spike Detector
Tete Adate Adjete
this indicator is a Spike detector indicator, it is specially designed to trade Boom 1000, Boom 500, Crash 1000 and Crash 500 We recommend using it on Deriv Boom and Crash indices only Its setting is intuitive, familiar, easy to use it has notification functions; audible notifications and push notifications. this tool is simple to use, easy to handle This update is based on different strategies for spikes
BC Scalper Aroow
Tete Adate Adjete
This indicator is based on the crossing of two Moving Average with the RSI It is intended for scalpers Specially designed for Boom and Crash syhtetic indices from Binary.com/Deriv.com It is easy to use and intuitive. We recommend its use on M1 and is equipped with three types of notification Email alert Sound notification Push notification these parameters can be activated and deactivated.
IVISTscalp5
Vadym Zhukovskyi
5 (6)
[iVISTscalp5]:通过时间研究市场行为的实验室 TLV Framework | Liquidity Activation Points ⸻ 项目概述 iVISTscalp5 是在 VISTmany 项目框架下开发的多层级时间与价格结构指标。 该系统通过 Liquidity Activation Points(时间激活点 / timings)预测: 市场启动时间 方向 运动范围 iVISTscalp5 指标可使用默认参数应用于任何金融工具。 ⸻ 实际价值 iVISTscalp5 并不是作为传统技术指标而开发的。 它的核心理念是: 让任何人都能够通过“时间”研究市场行为。 ⸻ Time Language VISTmany (TLV) — 项目的核心概念 t(p) t(p) 是 timings 被激活的价格水平。 ⸻ p(p) p(p) 是 iVISTscalp5 指标构建的核心价格水平。 最强的市场反应通常出现在: t(p) 与 p(p) 相互作用时。 ⸻ 在 TLV(Time Language VIST
This indicator is a scalping indicator intended solely for the Boom and Crash indices of the Deriv Limited market It supports Boom 500, Boom 1000, Crash 500 and Crash 1000 Not repaint and no bug The settings are intuitive and easy to use The product activation number is 20 The Time Frame used depends on the user If you are an aggressive scalper then just use M1 For long trades use M15 If you are conservative use M5 Please contact me for more details of its use
Boom coins indicator and crash coins
Waleed Hamood Said Al Rawahi
YouTube上的指標直播。更多可信度請點擊下面的鏈接。還有指標的視頻可以觀看。注意直播晚了,不要依賴,只有對指標的回顧僅回顧指標的準確性,幾乎不輸,利潤率達到 95%。我將在 CRASH coin 1000 INDICES 上非常準確地工作 YouTube上的指標直播。更多可信度請點擊下面的鏈接。還有指標的視頻可以觀看。注意直播晚了,不要依賴,只有對指標的回顧僅回顧指標的準確性,幾乎不輸,利潤率達到 95%。我將在 CRASH coin 1000 INDICES 上非常準確地工作 YouTube上的指標直播。更多可信度請點擊下面的鏈接。還有指標的視頻可以觀看。注意直播晚了,不要依賴,只有對指標的回顧僅回顧指標的準確性,幾乎不輸,利潤率達到 95%。我將在 CRASH coin 1000 INDICES 上非常準確地工作
MMM Gold Sniper MT5
Gilang Wardhana Purnama Putra
Indicator is based on   Market Maker Strategy.   NO REPAINT. MM's are traders and their objective is to make money.  This includes strategies to trade against retails traders.  The major difference between them and other traders is that they have the ability, through access to massive volumes, to move price at their will.  So to make money, they aim to buy at a lower price and then sell at a higher price. They achieve this by:  1. Inducing traders to take positions. This is achieved by using a
Tatino Super Signals is Non Repaint Indicator for Binary Option trading and Forex trading. Recommendations: Timeframe: All timeframes. For best results we recommend using it on M1, M5 and M15 timeframes. Currency pairs: All Pairs Account type: All Type Broker time: Any Brokers : Alls Binary Trading : Expired 1 Candle Buffer Buy=1, Sell=0, Entry Next Candle Recommended Forex trading stop loss : 15 pips Recommended  Forex tradingTake profit levels : 15 pips Specifications: Does not repaint   Pa
Magicx
Hasan Abdulhussein
The indicator places a buy or sell signal when the conditions of the strategy it was designed with are met. The strategy is guaranteed, strong, and has been tested for 9 years. The indicator is for binary options and can be converted into a bot by linking it to MT2Trading, where it sends the signal to this platform. This platform automatically opens a trade on the trading platform you are using, whether it is Pocket Option, IQ Option, or any other binary options platforms. The entry is on the n
CBT Quantum Maverick
Arpit Sharma
1 (1)
CBT Quantum Maverick 高效的二元期权交易系统 CBT Quantum Maverick 是一款精心设计的高性能二元期权交易系统,专为追求精准、简单和纪律的交易者打造。无需自定义,该系统经过优化,可直接使用并产生高效结果。只需遵循信号操作,稍加练习即可掌握。 主要特点: 信号精准度: 基于当前K线生成下根K线交易信号,无频繁重绘。 市场多样性: 专为二元期权交易设计,兼容多种经纪商和资产类别,适应不同交易偏好。 兼容性: Deriv Synthetic Charts :适用于任何时间框架。 OTC Charts :来自如 Quotex、PocketOption、Binomo、Stockity、IQOption、Exnova、OlympTrade、Deriv、Binolla 和 Homebroker 的经纪商,可导入 MT5(一周内提供免费导入支持,之后需支付服务费用)。 外汇、加密货币和商品市场 :扩展资产利用。 高收益二元资产 :建议使用90%以上的高回报率资产。 额外优势: 全面的交易计划: 提供系统化和纪律性交易的分步支持计划。 高效时间利用: 每天仅需一
Introducing to your attention an innovative expert advisor created specifically for the most juicy and volatility    currency     basket: GBPUSD, XAUUSD and EURJPY. This system is designed using the main features of this market's movement, making it an ideal choice for dynamic trading on high-trending and medium-volatile pairs.   The signals are focused on minimizing trading risks, aiming to reduce losses to a minimum. Main features ESignals is designed to show open and close arrows at the beg
ITF Trend Filter
Mayowa Daniel Sonaike
This strategy focuses on identifying and following clear market trends by filtering out noise and short-term fluctuations. Using advanced algorithms, it highlights significant upward and downward movements, enabling traders to make data-driven decisions. The indicator is designed for simplicity and precision, ideal for traders who prefer a systematic approach to trend trading. Whether you're a beginner or an experienced trader, this tool helps you stay aligned with the dominant market direction
AriBot
Arman Belassarov
AriMax   – AI-Powered Trading Robot AriMax is a cutting-edge AI-powered trading robot designed to help traders maximize profits while minimizing risk. Utilizing advanced machine learning algorithms and real-time market analysis, AriMax identifies high-probability trade opportunities with precision and speed. Key Features:     AI-Driven Market Analysis   – Analyzes market trends and patterns to make data-driven trading decisions.     Automated Execution   – Places trades seamlessly with optimiz
Paradigm Shift
Oliver John Vella
PRICE WILL BE INCREASED TO £4999 SOON! 5 or 15 MINUTE CHART ONLY: A state-of-the-art trading indicator, designed with advanced analytical and mathematical programming, delivers top-tier buy and sell signals. Simply enter a small buy position when a green arrow appears and a small sell position when a red arrow is shown. While signals from this indicator are infrequent, they boast exceptional accuracy when generated. Please apply your own stop-loss and take-profit levels as needed.
In sadiq100
Xssadq Alseydy
مؤشر Smart Trend Candles هو أداة فعّالة في منصة MetaTrader 4، تجمع بين عناصر تحليل فني متعددة لتحديد اتجاهات السوق وقياس قوة المشترين والبائعين. يوفر هذا المؤشر متعدد الاستخدامات إشارات مرئية واضحة تُحسّن قرارات التداول الخاصة بك. الميزات الرئيسية 1. تحديد الاتجاه يستخدم شموع Heikin-Ashi المعدلة (اختياري) لتصفية ضوضاء السوق يتضمن متوسطًا متحركًا (فترة قابلة للتكوين) لتأكيد الاتجاه تنفيذ مؤشر القوة النسبية لقياس الزخم 2. قياس القوة تشير الشموع المرمزة بالألوان إلى شدة ضغط الشراء/البيع تحليل الحج
Advanced Analysis – Total Visual Clarity The Ichimoku Dashboard features three powerful dashboards to deliver precise trading signals based on a proven methodology. The color-coded panel design allows users to instantly identify the status of each monitored financial instrument at a glance. The combined table of the "Ichimoku Dashboard" for MetaTrader 5 is a key component that integrates and synthesizes trading signals generated by the indicators, providing a clear and immediate overview to su
作者的更多信息
There are only 3 important levels on any chart- High Low & Close.  Once a candle closes , its very important to know  where these levels are and to trade with respect to these levels is critical in trading.  This is especially true for the daily weekly and monthly levels.  This indicator will automatically plot the, High Low & CLOSE of the Daily, Weekly and Monthly closed candles with custom styles and colors. It will also draw a Daily period separator if you so choose. We want to help you pl
筛选:
无评论
回复评论