FxBears Super
- 지표
-
Rachid Lafhil
 I am RACHID, the Co Manager of Forex Bears Company that provide the most powerful trading tools in the financial markets.
 - 버전: 11.0
- 업데이트됨: 27 7월 2026
- 활성화: 5
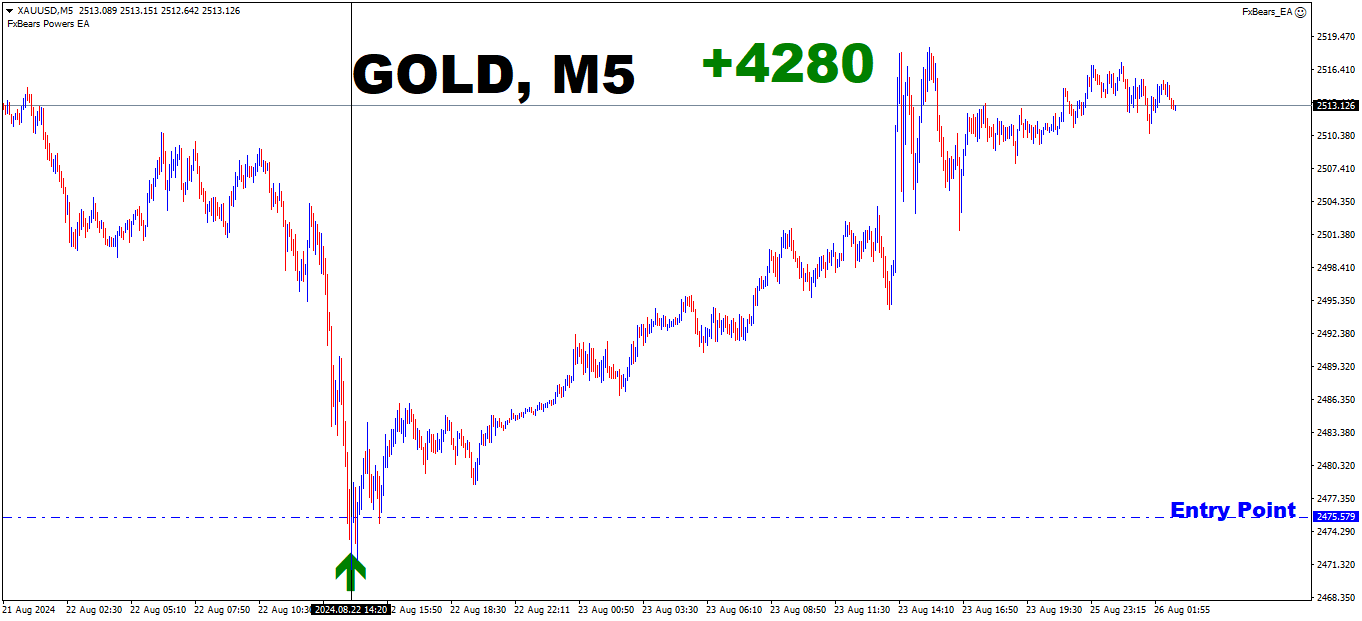
FxBears Super – Professional Market Reversal Indicator for MT4
Trade Smarter. Enter Earlier. Exit with Confidence.
FxBears Super is a premium trading indicator developed for traders who want to identify high-probability market reversals with exceptional precision.
Built on years of research and market observation, FxBears Super combines advanced market structure analysis, institutional price behavior, supply & demand dynamics, Elliott Wave principles, and proprietary algorithms to detect opportunities before they become obvious to the crowd.
Instead of chasing price after the move has already happened, FxBears Super helps you position yourself where professional traders are already watching.
Why FxBears Super?Every day, thousands of traders lose money because they enter too late...
They buy after the rally.
They sell after the drop.
They react to emotions instead of following the market.
FxBears Super was designed to solve this problem.
The indicator continuously scans the market and identifies areas where price has a high probability of reversing or continuing with strength, allowing you to make confident trading decisions based on objective analysis—not emotions.
Advanced Multi-Layer Market AnalysisUnlike traditional indicators that rely on a single calculation, FxBears Super evaluates multiple dimensions of the market simultaneously.
Its proprietary algorithm analyzes:
✔ Elliott Wave structures
✔ Supply & Demand Zones
✔ Institutional price behavior
✔ Market momentum
✔ Trend strength
✔ Price action confirmation
✔ Internal filtering algorithms
The result is a powerful trading system capable of filtering out a large amount of market noise and highlighting only the most promising opportunities.
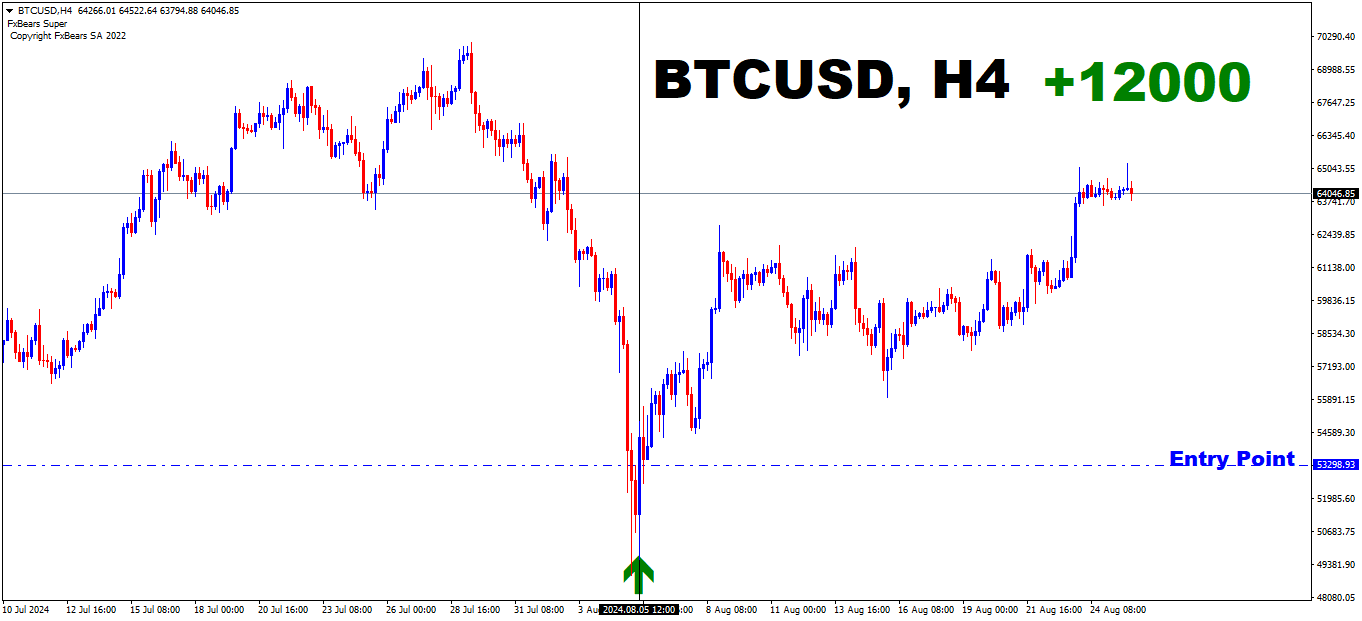
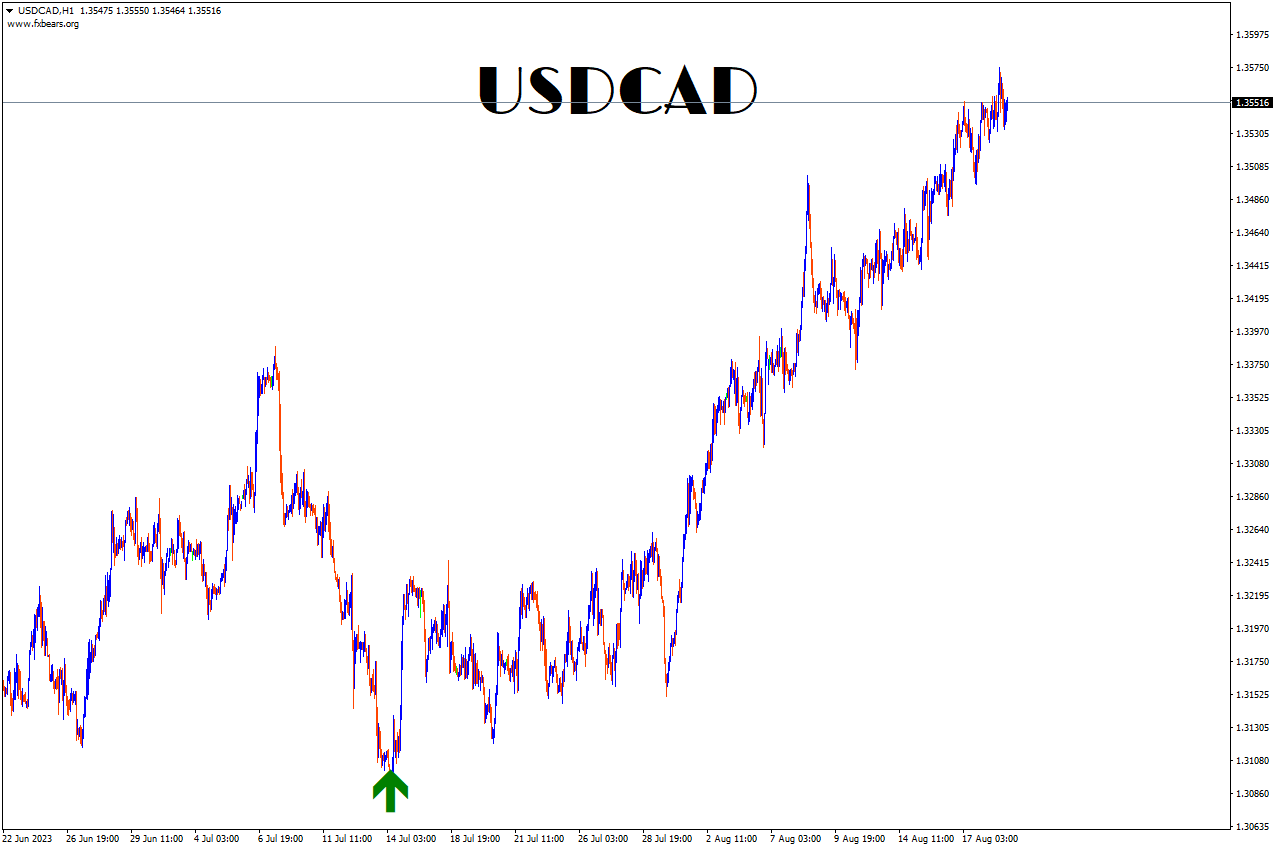
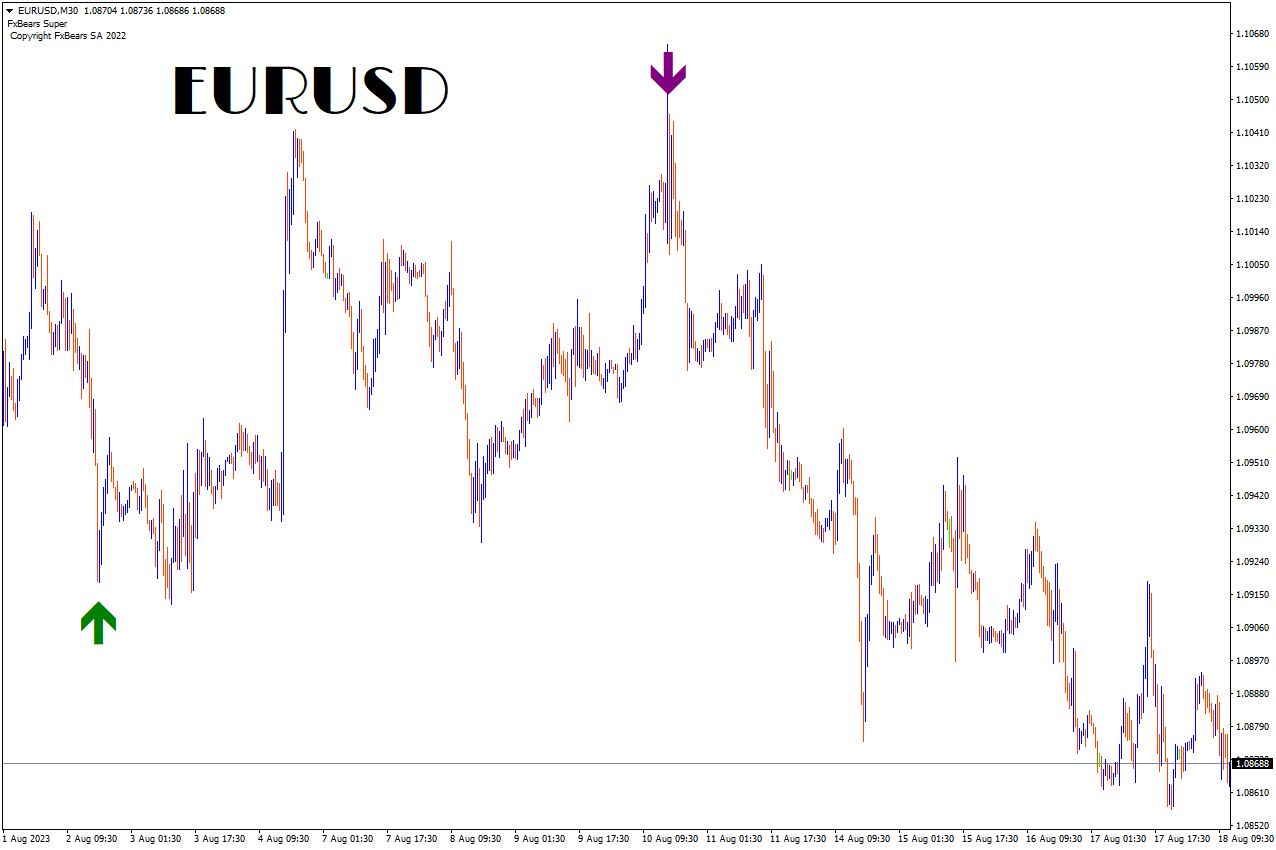
Key Features✅ High-quality Buy & Sell signals
✅ Designed for MT4
✅ Works on all Forex pairs
✅ Gold, Silver, Oil
✅ Indices
✅ Cryptocurrencies
✅ Commodities
✅ All timeframes (M1 → MN)
✅ Instant mobile notifications
✅ Sound alerts
✅ Easy to install and use
✅ Beginner-friendly interface
✅ Suitable for professional traders
✅ No Repainting
✅ No Redrawing
Stay Connected Wherever You AreYou don't have to spend the entire day in front of your computer.
Whenever a trading opportunity appears, FxBears Super instantly sends a notification to your MetaTrader mobile application including:
• Trading Symbol
• Buy or Sell Signal
• Timeframe
• Entry Information
This allows you to monitor the market while continuing your daily activities.
Designed for ConsistencyTrading success is not about taking hundreds of trades.
It is about selecting the right opportunities.
FxBears Super focuses on quality rather than quantity, helping traders avoid unnecessary entries while increasing confidence in every decision.
Historical testing has shown excellent consistency when the indicator is used with proper money management and disciplined execution.
Built for Every Type of TraderWhether you are:
• Scalping
• Day Trading
• Swing Trading
• Position Trading
FxBears Super adapts to your preferred trading style and market.
Professional Trading Starts with Professional ToolsMarkets are driven by probability—not certainty.
No indicator can predict every market movement, but having an analytical advantage can make all the difference over the long run.
FxBears Super was created to provide that advantage.
It transforms complex market analysis into simple, actionable trading signals so you can focus on execution instead of endless chart analysis.
Experience the Difference
Stop guessing.
Stop chasing the market.
Trade with structure.
Trade with confidence.
Trade with FxBears Super.