适用于MetaTrader 5的付费EA交易和指标 - 34

Certo! Ecco la traduzione completa in inglese della descrizione per MQL5 Market, ottimizzata per chiarezza e stile commerciale: HotkeyTrader Scaling – Your Ally for Ultra-Fast Trading! ️ Enter the market, exit in profit – all with a single keystroke! Have you ever dreamed of buying, selling, setting break-even, or closing all trades with a simple keystroke or Stream Deck button?
With HotkeyTrader Scaling , that dream becomes reality. No more clicks, no distractions. Just pure speed. Desc
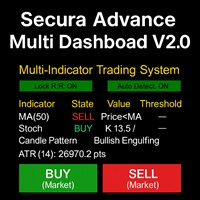
# Secura Multi Dashboard - Advanced Trading Assistant ## **Professional Multi-Indicator Analysis Platform** Secura Multi Dashboard is a comprehensive trading assistant designed for traders who demand clarity, precision, and efficiency. This powerful EA integrates multiple technical analysis tools into a single, intuitive interface, helping you make informed trading decisions without overwhelming complexity.
### ** Key Features:**
** Multi-Indicator Consensus System** - Simultaneous anal

Elevate your trading experience with Dynamic Trader EA MT5 , a cutting-edge trading robot designed to optimize your investment strategy. This advanced algorithm harnesses the power of four key indicators: RSI ( Relative Strength Index ), Stochastic Oscillator , MACD ( Moving Average Convergence Divergence ) and ATR ( Average True Range ) to make informed and precise trading decisions. ATR is used to dynamically set stop-loss and take-profit levels based on market volatility. IMPORTANT!
Read c

The indicator automatically builds Support/Resistance levels (Zones) from different timeframes on one chart.
Support-resistance levels are horizontal lines. As a rule, the market does not respond to a specific price level, but to a price range around the level, because demand and supply of market participants are not formed clearly on the line, but are “spread out” at a certain distance from the level.
This indicator determines and draws precisely such a price range within which strong positi

The indicator colors the candles relative to their volume delta. The calculation of the candles delta is based on the tick history or on the deals tape history (see below for a description of the input variable "Volumes").
Coloring is performed by two parameters : by delta sign, as candle color, by delta value, as candle color contrast against chart window background color.
In addition to coloring the candles, the indicator also displays the delta profile on the interval specified by the user

GoGo Breaker – The Master Candle Signal 基于价格行为的智能信号,带有高级过滤器 GoGo Breaker 是一款功能强大的交易指标,它使用**“主蜡烛”(Master Candle) 模式来实时识别高概率交易机会。该指标专为寻求 快速、精准进场 的交易者设计,是 剥头皮、日内交易和波段交易**的理想选择。 通过清晰的箭头自动检测买入/卖出信号。 适用于所有市场:外汇、指数、大宗商品和加密货币。 灵活:可单独使用,也可与其他指标结合使用以提高准确性。 推荐策略 基础策略:使用 VIDYA + 抛物线转向指标(Parabolic SAR)进行优化 (过滤掉明显趋势中的信号并避免假突破) 买入规则: 出现 GoGo Breaker 信号 (绿色箭头)。 随后的蜡烛 在 VIDYA 之上开盘和收盘 。 抛物线转向指标(Parabolic SAR) 位于 价格下方 (确认上涨趋势)。 卖出规则: 出现 GoGo Breaker 信号 (红色箭头)。 随后的蜡烛 在 VIDYA 之下开盘和收盘 。 抛物线转向指标(Parabolic SAR) 位于 价格上方

This factor is traded on the 5M five-minute frame
Please see the explanations in the attached images
Trading is done according to the trend. If the trend is upward, we buy only when the red line is touched
If the trend is downward, we sell only when the blue line is touched
In the case of a sideways trend, we can sell when the blue line is touched and buy when the red line is touched
When the price reaches the red buy line or the sell line from above, we enter a deal and stop the loss at 5
Scalper EA M1 – M1 时间框架剥头皮交易专家 Scalper EA M1 是一款针对 M1 时间框架的剥头皮交易专家,旨在利用市场短暂波动获利。 使用建议 经纪商: 选择 执行速度快 的经纪商,这对剥头皮交易至关重要。
测试: 在 模拟账户 或 策略测试器 中测试 EA 后再进行真实交易。
VPS: 为了最大化效率,建议使用 低延迟 VPS 连接至经纪商服务器,以减少执行延迟。
时间框架: M1。
最佳交易条件: 使用 低点差和低佣金的货币对 。 适用账户类型和最低存款 推荐账户类型: ECN, Raw Spread, STP – 低点差和快速执行的账户。
不适用于美分账户 ,因为它们通常点差较高,执行较慢。
最低推荐存款: $100+ (或等值货币),最低手数为 0.01 。 ️ 交易参数 Lot_Type – 手数类型( Fixed_lot – 固定, Auto_lot – 自动)。
Lot_Risk – 自动手数计算的风险百分比。
FixedLotSize – 固定手数大小。

3 Trading Strategies to Exploit Market Structure (Without Overcomplicating It)
Trading isn’t about predicting the future—it’s about spotting patterns, managing risk, and acting when odds favor you. Below are two timeless strategies (and one hybrid) that align with how markets actually move, not how we wish they would. Some of the strategies you can trade with the indicator [ Note] Higher timeframe should be 15x of the lower timeframe, for eg. htf 15min, ltf 1min. 1. The Breakout Trap: Trad

DESCRIPTION
The EasyFollowerTrader Bot4 DayTrade indicator always trades with the trend. Thus, the indicator, at first, observes the trend of the average of the highs and lows of the candles of the selected time-frame. Then see if this trend is in line with the trend of the daily chart to operate in favor of the major trend. When these two charts are moving in the same direction, we have the highest probability of winnings. We will call this region the region of high probability of gain.
In t

As it name implies, this is an exaustion oscillator. However, you may wonder: what differs you from others oscillators like RSI, Stochastic, CCI etc? The difference is that ours is more powerful and accurate ! Your oscillator filters the nois e made by other oscillators, and shows you only the exact moment to enter the trade. Of course, using it alone, like any other indicator, has its risks. Ideally, reconcile it with technical analysis and/or others indicators. If you have any doubt or suggest

Multi Time Frame Sub Panel for MT5. Monitor multiple time frames from a single chart window.
Here are some of the options available with the MTF Moving Average: Select the timeframes to be displayed (can manually type in other TF's) Customize the amount of timeframes to be displayed Define the width (number of bars) for each timeframe box Modify all the colors Display two moving averages
MTF, MA, Multi-TF, Multiple TF, Moving Average, SubPanel, Sub-panel,

This indicator builds upon the previously posted Nadaraya-Watson Estimator. Here we have created an envelope indicator based on kernel smoothing with integrated alerts from crosses between the price and envelope extremities. Unlike the Nadaraya-Watson Estimator, this indicator follows a contrarian methodology. Please note that the indicator is subject to repainting. The triangle labels are designed so that the indicator remains useful in real-time applications.
Settings
Window Size: Determin

Smart Liquidity Levels is a valuable tool for identifying optimal liquidity levels, enabling retail traders like us to strategically set our stop-loss orders. T he essential tool for traders seeking to maximize their trading success. The liquidity level is a critical component of inner circle trading (ICT). It assists us in determining when and how we should enter the market. Watch the video for detailed instructions. Here's why understanding liquidity levels is crucial in trading and how our

The Metatrader 5 has a hidden jewel called Chart Object, mostly unknown to the common users and hidden in a sub-menu within the platform. Called Mini Chart, this object is a miniature instance of a big/normal chart that could be added/attached to any normal chart, this way the Mini Chart will be bound to the main Chart in a very minimalist way saving a precious amount of real state on your screen. If you don't know the Mini Chart, give it a try - see the video and screenshots below. This is a gr

The indicator displays peak levels of activity formed by the maximum volume, tracks the correlation of the candles on all timeframes (from the highest to the lowest one). Each volume level is a kind of key trading activity. The most important cluster is inside a month, week, day, hour, etc.
Indicator operation features A volume level receives Demand status if the nearest volume level located to the left and above has been broken upwards. A volume level receives Supply status if the nearest volu

开盘区间检测 – 根据可配置的时间段检测开盘区间
突破信号 – 在突破开盘区间时显示信号
目标位 – 根据区间宽度的百分比计算并显示目标位
日内偏向 – 考虑每日趋势以筛选信号
移动平均线 – 可选显示的移动均线 MQL5 的重要调整 :
可视化 : 绘制 ORH、ORL 和 ORM(开盘高/低/中间)线条 用图形对象表示目标位、信号和开盘区间框 根据日内方向进行颜色编码 参数 : 所有关键设置均可作为输入参数配置 开盘区间的时间设置灵活 可自定义颜色和样式 功能性 : 会话管理控制开盘时间段 根据可配置百分比计算目标位 带偏向选项的信号逻辑 可选显示历史数据 特色 : 图表对象管理,保持界面整洁 内存高效实现 针对不同时区的稳定时间处理
各市场的精准时间计算
无需修改代码即可灵活配置
全球交易时段兼容性强
使用简单,整型参数操作 该指标现在根据设置的时区计算所有时间相关功能(开盘区间、自定义区间、会话检测),可广泛适用于全球不同市场。
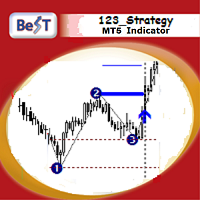
BeST_123 Strategy is clearly based on the 123 Pattern which is a frequent Reversal Chart Pattern of a very high Success Ratio .It occurs at the end of trends and swings and it’s a serious indication of high probability for a change in trend.Theoretically an 123_pattern is valid when the price closes beyond the level of #2 local top/bottom, a moment when the indicator draws an Entry Arrow, raises an Alert, and a corresponding Position can be opened.
The BeST 123_Strategy Indicator is non-repain
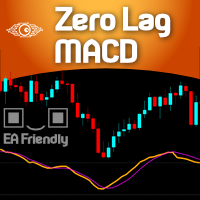
For those who are fans of the traditional MACD ( Moving Average Convergece/Divergence ) indicator, here it is a way faster indicator that could be very useful for intraday trading. Of course it could be used in higher timeframes, with the proper settings. Here at Minions Labs we always encourage traders to calibrate every single indicator you have to extract and distill every drop of good information it has for you. And this is the case with this speedy friend... This Zero Lag MACD could be used
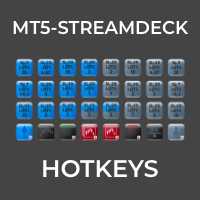
MT5-StreamDeck offers the possibility to use a certain number of pre-programmed Hot-keys with a clearly defined role. So by the push of a button you can open a trade with a pre-defined lot size, stoploss and take profit. Close all your trades, close the ones in profit, or in loss, set Break-even or set a trailing stop. All this with a Hot key button. See the feature list for all the actions that can take place at the push of a button. Ideal for Quick Scalping or day trading with set risk managem

技术上复杂,但操作简单的产品,实现了与机器学习相结合的投资组合方法。借助这项优势,顾问几乎拥有无限的扩展、提高质量,以及最长期和保证的支持。主要目标是为用户提供小而安全的收入。
#工作原理:大量货币对和期间通过我的服务器和算法进行独立培训,然后选择最好的组合成一个统一的顾问。基础是寻找价格反转的可能性。
# 奖金:除了定期更新此顾问外,他的组成部分还以免费的顾问形式自动在一个独特的、首个电报频道中为您发布。 使用并与朋友分享!
# 如有任何问题:请访问我们的 Telegram 社区 。
1) 最低存款:微型账户为500美元,普通账户为50000美元,杠杆不低于1/30 2) 安装:在任何图表上(选择任何图表并挂起,仅一个)
# 该顾问按行业运作,交易具有相似特性的工具组合。其核心理念基于执行机器学习的服务器。机器学习完成后,设置被嵌入到通用模板中,该模板专门针对所选行业进行交易。在本例中, 加密货币 。 与该部门合作的经纪人示例 - FxPro
# 我会定期重新训练顾问并发布新的、更新的版本,以适应当前的市场情况。
# 并非每个经纪商都提

For those who love to trade using the Heikin Ashi Candlesticks, here it is one more powerful ally: Heikin Ashi Volume . This indicator is an exclusive idea and creation from us at Minions Labs for you. The idea behind this indicator is to have a visual cue over the Heiken Ashi candles pointing at those candles with big volume. For this to happen you can choose between 2 different techniques of identifying the "high" volume: Higher Volume above the last N previous bars average. Higher Volume segm

The Fractals indicator displays on the chart only fractals with the specified parameters in the indicator settings. This allows you to more accurately record a trend reversal, excluding false reversals. According to the classical definition of a fractal, it is a candlestick - an extremum on the chart, which was not crossed by the price of 2 candles before and 2 candles after the appearance of a fractal candle. This indicator provides the ability to adjust the number of candles before and after t

The Breakout Trading Strategy "Turtle" is a trading strategy that enters into a position when long period highs or lows are broken and exits the position when short period highs or lows are broken. This strategy aims to capitalize on significant price movements that break through established support or resistance levels. The long period highs and lows serve as a signal for a potential breakout, while the short period highs and lows serve as a signal to exit the position before the momentum fades

Smart Super Signals Pro Smart Super Signals Pro Smart Super Signals Pro 是一款多功能的自动化交易专家顾问(EA),适用于 MetaTrader 5。它可以用于交易主流货币对(EURUSD、GBPUSD、USDJPY 等)、贵金属(Gold/XAUUSD)、石油(WTI、Brent)以及加密货币(BTCUSD 等)。该 EA 基于“超级信号”(Super Signals)的理念,通过识别所选时间周期内的局部高点和低点(可能的反转或回调点)来生成交易信号。 当出现买入或卖出信号时,EA 会自动开仓,并可通过追踪止损(Trailing Stop)、保本(Breakeven)以及网格(对冲模式)功能来进行仓位管理。这使得 Smart Super Signals Pro 既适合相对激进的策略,也能满足较为保守的交易需求。 Key Features(主要特点) 支持主要金融工具: 外汇(EURUSD、GBPUSD、USDJPY 等)、贵金属(Gold/XAUUSD、Silver)、石油(WTI、Brent)、加密货币(BTCU

Fractal Breakout EA 一个功能强大且完全可定制的智能交易系统(Expert Advisor),专为交易经典分形形态突破而设计。该EA具有多功能设置,可根据不同的风险偏好进行配置,从保守的固定手数模式到更激进的交易模式。 概述 Fractal Breakout EA是一个自动交易机器人,旨在识别和交易基于经典5柱分形形态的动量突破。它能智能地检测摆动高点和低点,放置挂单 Buy Stop 和 Sell Stop,以利用随后的价格变动。 该EA的独特之处在于其多功能性。 为了说明其功能,我们提供了两种不同交易模型的样本配置和历史测试结果: **保守增长模型:**使用固定的手数,以实现更稳定的风险状况。 **激进增长模型:**同时利用动态手数和马丁格尔策略,以实现加速、高风险的增长。 这种方法让您可以根据对核心策略在不同设置下过去表现的理解,选择最适合您目标的资金管理风格。 策略如何运作 核心逻辑是基于识别预示潜在突破的价格形态: **买入信号(分形低点):**EA识别出一个摆动低点或支撑位。然后,在形态的高点上方放置一个挂单 Buy Stop,以捕捉向上的突破。 **卖出

The indicator draws support and resistance lines on an important part of the chart for making decisions. After the trend line appears, you can trade for a breakout or rebound from it, as well as place orders near it. Outdated trend lines are deleted automatically. Thus, we always deal with the most up-to-date lines. The indicator is not redrawn .
Settings:
Size_History - the size of the calculated history. Num_Candles_extremum - the number of candles on each side of the extremum. Type_Arrow

Designed by Welles Wilder for daily commodity charts, the ADXW is now used in various markets by technical traders to assess the strength of a trend or even a trend for short- or long-term trades.
The ADXW uses a positive (DI+) and negative (DI-) directional indicator in addition to its trend line (ADX).
According to Wilder, a trend has strength when the ADX signal is above 25; the trend is weak (or the price has no trend) when the ADX is below 20. The absence of a trend does not mean that th
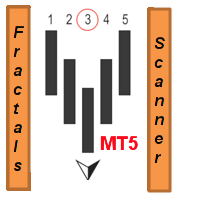
这个多时间框架和多品种指标识别分形模式。作为奖励,它还可以扫描抛物线 SAR (pSAR) 趋势变化。结合您自己的规则和技术,该指标将允许您创建(或增强)您自己的强大系统。 特征
可以同时监控您的市场报价窗口中可见的所有交易品种。将该指标仅应用于一张图表,并立即监控整个市场。 可以监控从 M1 到 MN 的每个时间范围,并在识别出模式或趋势变化时向您发送实时警报。支持所有 Metatrader 原生警报类型。
可以使用 RSI 和/或移动平均线作为趋势过滤器来正确识别潜在的逆转。 该指示器包括一个交互式面板。当单击一个项目时,将打开一个带有相关代码和时间范围的新图表。 该指标可以将信号写入文本文件,EA 交易程序 (EA) 可以使用该文件进行自动交易。比如 这个产品 。 您可以在博客中 找到有关文本文件的内容和位置的更多信息。
输入参数
输入参数的描述和解释可以在 这里 找到。 重要的
请注意,由于具有多功能性,既不会在安装指标的图表上绘制买卖建议,也不会绘制线条和箭头。图表上将绘制显示形态的箭头,点击面板中的信号即可打开图表。我建议您将指标放在干净(空)图表上,上面没有任何其他指
OVERVIEW
A Lorentzian Distance Classifier (LDC) is a Machine Learning classification algorithm capable of categorizing historical data from a multi-dimensional feature space. This indicator demonstrates how Lorentzian Classification can also be used to predict the direction of future price movements when used as the distance metric for a novel implementation of an Approximate Nearest Neighbors (ANN) algorithm. This indicator provide signal as buffer, so very easy for create EA from this indi

Easy Market makes the market easier to trade. It allows you to see an "eternally" side (no trend) market, making it extremely easy to see when the price is overbought or oversold. Both trend and consolidation traders will like Easy Market. You can use it as an auxiliary window (below chart) or in full screen mode. See the screenshots and note how it gives you accurate entries! If you have any doubt or suggestion, please, contact us! Ejoy!
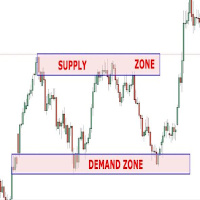
This Expert Advisor can be applied to many markets because It exploits basic supply/demand and price action concepts. It identifies the major rotation zones (PRZ), supply and demand zones and supports and resistances within major price trends. It buys at discount zones and sells at premium prices. It can and should be optimized through the Metatrader tester to find the best parameters to use for current market conditions. This is not a fixed strategy rather a full trading algo that will find whi
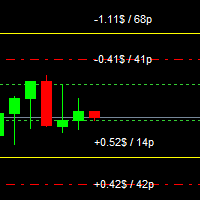
For MT4: TP SL Calculator for MT4 This tool helps you to automatically calculate profit at Take - Profit price and loss at Stop - Loss price. Feature: - Calculate profit at TP price. Apply to all operators (BUY / BUY LIMIT / BUY STOP / SELL / SELL LIMIT / SELL STOP), with TP price is greater than 0. Profit is expressed in money and points. - Calculate loss at SL price. Apply to all operators (BUY / BUY LIMIT / BUY STOP / SELL / SELL LIMIT / SELL STOP), with SL price is greater than 0. Loss is

First Order Robot Strategy =over OR under Last Minute open Set1: TP 2K / SL1K Set2: TP 1K / SL 1 K Rate Prop FTMO Broker. Or Real Account with 200$. Only Pair DE40, US100, US30. Automatic added London Session. This Version works fixed Lot buy/ sell. Write me privat Message of Questions, when undecided. Ex4 Code by Request. inp1_TimeStart= Robot Worktime Start inp1_TimeEnd = Robot Worktime Ende inp8_TimeStart= Time to Robot Reboot inp8_TimeEnd = Time to Robot Reboot

Friends, this tool does not work in backtesting and you must run it live. Chat Ai assistant
a versatile and intelligent AI assistant
Talk to the AI, get advice from it, give it orders
Can be used in all charts, time frames, symbols, markets and...
With a very simple interface
This tool is an artificial intelligence assistant that you can chat with.
You can give him different commands. for example:
Tell him to open a buy order for you.
Or tell him to close your sales deals
Or tell it to change
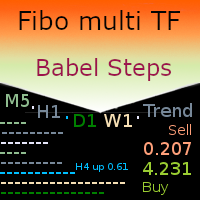
MT5 netting the “Babel Steps” robot uses the ZigZag indicator to generate Fibonacci levels on M1, M5, M15, H1, H4, D1, W1 periods of the charts , calculates the strength of trends for buying and selling. It opens a position when the specified trend level is exceeded plus Bollinger indicators and Stochastic indicators inform about oversold / overbought market. Stochastic and Bollinger indicators help to increase or decrease the position. If market moves into favorable direction the Robot genera

Golden Velocity EA Overview: Golden Velocity EA is a trading robot designed for trading XAU/USD (Gold/USD) with unparalleled precision and sophistication. This expert advisor combines cutting-edge technical analysis with a focus on wealth-building strategies, bringing a blend of innovation and success to your trading. Key Features: Optimized for 1-Hour Chart: Default settings are specifically tailored for the 1-hour XAU/USD Dynamic Versatility: While optimized for Gold/USD, the EA can be tested

Attention : Please send a message to us if you still don't understand and are expected to follow the recommended capital size, lots size value, and one of the brokers whose portfolio we display. " For those of you who buy RTC Spectra products by ignoring our recommendations, you don't need to provide bad testimonials for your own mistakes!". The Expert Advisor (EA) named "RTC Spectra" is designed for the long term with good and consistent results. This EA has been proven to perform very well
Hello friends. I wrote this utility specifically for use in my profile with a large number of Expert Advisors and sets ("Joint_profiles_from_grid_sets" https://www.mql5.com/en/blogs/post/747929 ). Now, in order to limit losses on the account, there is no need to change the "Close_positions_at_percentage_of_loss" parameter on each chart. Just open one additional chart, attach this utility and set the desired percentage for closing all trades on the account. The utility has the following fu
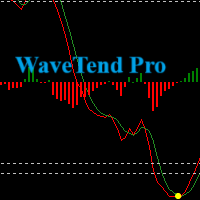
You need to revise your product description to comply with advertising policies that prohibit guaranteeing or hinting at profits. The current description uses phrases that could be interpreted as promises of financial gain, which violates these rules. Wave Trend Oscillator Indicator for MetaTrader 5 Discover the Wave Trend Oscillator Indicator , a sophisticated technical analysis tool for MetaTrader 5. This indicator is designed to help traders better understand market dynamics by visualizing w

BeST_Hull Single MA Strategy is an Metatrader Indicator based on the famous indicator Hull Mov.Average . This indicator can display the Single HMA Strategy of just 1 Hull MAvg. It uses added internal filters locating the most likely Entries while it can be used as a standalone system or as an add-on to other ones.
Generally the Hull Moving Average (HMA - developed by Alan Hull) is a directional trend indicator . It captures the current state of the market and uses recent price action to determin

ATLogic ATLogic 指标:适用于所有交易工具的多功能工具 ATLogic 是一款全面且用户友好的技术分析工具,旨在支持广泛的金融工具,包括所有货币对、指数和加密货币。 这个多功能指标为交易者提供了在各种市场中的强大洞察:
购买后留下留言,获得特别的奖金礼物
“给我发消息,与我的人工智能导师联系,学习如何更有效地使用这个指标!”
主要特点 - 通用兼容性: ATLogic 在所有交易工具中无缝运行,包括外汇对、股票指数和加密货币。 - 多时间框架分析:该指标支持在不同时间框架上进行分析,从短期剥头皮交易到长期投资。 - 直观界面:其用户友好的设计使得新手和经验丰富的交易者都能轻松使用。 - 高级警报系统:可定制的通知可以发送到桌面系统和移动设备,确保交易者不会错过重要的市场动态。 核心功能 ATLogic 使用复杂的算法来识别和显示关键市场水平: 1. 市场动态检测:该指标分析历史价格走势,以确定所有工具中的重要市场动态。 2. 视觉表示:这些关键区域以水平线的形式显示在图表上,为潜在的交易进出点提供清晰的视觉提示。 3. 跨市场分析:ATLogic 允许交易者比较和

Philosophy — “Profit First. Calm Always.” Markets breathe. They trend, stall, and spike. Most grid systems suffocate in that noise; they either over-average, panic-close in red, or grind the equity into a cliff. SP500 Smart Grid is built around a simple, stubborn philosophy: protect the equity curve and harvest only green . It does this by staying on one side of the market at a time (guided by the EMA slope) and only banking in profit . There’s no “pray and close at a loss” button buried inside
如果有任何問題或設定疑問,請給我留言。我很樂意幫忙! Time-based Range Breakout EA – Version 2.00 (繁體中文) 1. 概要 (Overview) Time-based Range Breakout EA (v2.00) 是一款日內突破策略,基於「指定起始時間 + 區間長度」定義當日高/低價區域,一旦價格突破該區間便自動掛出 Buy Stop / Sell Stop 訂單。此版本在止盈/止損 (TP/SL)、追蹤止損 (TSL) 與區間過濾 (Range Filter) 等方面增加了多種計算模式及處理邏輯,可因應更廣泛的交易偏好與市場狀況。 主要特點: 多種 TP/SL 計算 :支援區間倍數 (Range Factor)、距離百分比 (Distance Percent) 及固定點數 (Points)。 TSL / BE 多基準 :可用點數 (Points) 或進場價百分比 (Percent) 來計算。 SL = 0 + 風險百份比(Risk Percent) :若非固定手數模式且 SL Value=0,則針對 Buy SL 為市場價 0,Se

This indicator calculates Correlation among currency pairs (Selected by user) to find the least and/or most correlated symbols in real time. Correlation ranges from -100% to +100%, where -100% represents currencies moving in opposite directions (negative correlation) and +100% represents currencies moving in the same direction.
Note The Correlation more than 80 (Adjustable) between two currency pairs, Shows that they are quite similar in the kind of movement and side. The Correlation less than
XP Moving Average MT5 – Your All-in-One Trading Powerhouse Master the markets with XP Moving Average MT5 , the ultimate moving average indicator for MetaTrader 5. Whether you’re scalping , swing trading , or investing long-term , this versatile tool combines 9 advanced moving averages in one—enhanced with a modern graphical dashboard and real-time alerts . With AI-powered insights coming soon , XP Moving Average is your key to smarter, more profitable trades . Why Choose XP Moving Average?

This is a fully automated smart adaptive algorithm. The SKYNET system calculates the history data and performs the analysis based on the probability percentage of where the upcoming breakout of the support and resistance level will take place, and places pending orders. The Expert Advisor adapts to any market conditions. It was backtested and optimized using real ticks with 99,9% quality. It has successfully completed stress testing. The EA contains the algorithm of statistics collection with
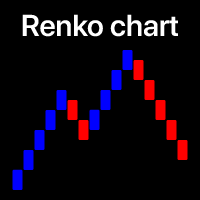
过滤掉小的价格波动,专注于更大的趋势 . Renko 图表指标将帮助您过滤掉小的价格波动,以便您可以专注于整体趋势。 价格必须移动指定的数量才能创建一个 Renko 砖块。 这使得识别价格当前移动的方向变得容易。 多功能实用工具 : 包含 66+ 功能 | 联系我 如果您有任何问题 | MT4 版本 在指标的设置中,您可以配置: 计算设置: 计算 块 大小的 方法 : 点差 / 点; 块大小; 将 用于 计算的 时间框架 ; 指标样式:
块颜色; 程序文件应放置在 " Indicators " 目录中。 //--------------------------- 多功能实用工具 : 包含 66+ 功能 | 联系我 如果您有任何问题 | MT4 版本
//-----------------------

This tool adds alerts to your Fibo Retracement and Fibo Expansion objects on the chart. It also features a handy menu to change Fibo settings easily and quickly! Please note the product is not working as a demo. Please watch the video.
Features Alert for Fibo Retracement and Fibo Expansion levels. Sound, Mobile and Email alert. Up to 15 Fibo Levels. Continuous sound alert every few seconds till a user clicks on the chart to turn it OFF. Single sound alert with pop-up window. Keeping all user se
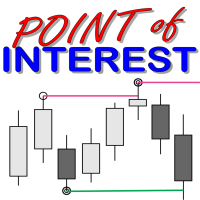
What is a Point of Interest? Traders who follow Smart Money Concepts may call this a Liquidity Point, or areas pools of liquidity have been built up by retail traders for for Big Banks to target to create large price movements in the market. As we all know, retail traders that use outdated and unreliable methods of trading like using trendlines, support and resistance, RSI, MACD, and many others to place trades and put their stop losses at keys points in the market. The "Big Banks" know these me

BeST_Trend Exploiter is a Metatrader Indicator based on a smart proprietary algorithm which can detect the market Median Trend while it filters out the noise providing Buy and Sell Signals and also wherever it is applicable it provides us with TP Levels of High Probability. Additionally as it has Built Inside all the necessary features it can be used as a Complete Strategy of very Impressive Results. Essential Advantages of the Indicator
Clear and Easily Understandable trading rules. Real Ti

Be notified of every color change of Heiken Ashi (HA) candles. The indicator will trigger past and new signals every time that HA candles change their colors. ( Note : this tool is based on the code of Heiken Ashi indicator developed by MetaQuotes Software Corp.)
Features The signals are triggered at closing of last bar/opening of a new bar; Any kind of alerts can be enabled: Dialog Box, Email message, SMS notifications for smartphones and tablets, and Sound alerts; By default, up arrows are pl

Auto Symbol Switcher (MT5) — Watchlist Rotator for Multi-Asset Charts Auto Symbol Switcher (MetaTrader 5) is a utility panel that automatically cycles your chart through a selected list of symbols. It suits multi-asset workflows across Forex, indices, commodities, stocks, and Contracts for Difference ( CFDs ). The tool is navigation-only —it does not place or manage trades. Full User Guide – Need MT4? Click here Terminology note: User Interface ( UI ), Market Watch ( MW ), Expert Advisor ( EA ),

显示任意定制指标的背离。您只需指定指标的名称; 省缺使用 CCI。 此外,您可以为所选指标设置平滑级别。如果这些级别被穿越, 您还可以收到通知。定制指标必须被编译 (扩展为 EX5 的文件) 且它必须位于客户终端的 MQL5/Indicators 目录或其子目录中。它使用选择指标的零号柱线作为省缺参数。
输入参数 Indicator name - 计算背离的指标名, CCI 为省缺; Period CCI - CCI 的平均周期, 7 为省缺; Applied price - 使用的价格, 收盘价为省缺; Smoothing method - 平滑方法, 简单为省缺; Smooth - 平滑周期, 8 为省缺; Level1 - 指标级别, -100 为省缺; Level2 - 指标级别, 100 为省缺; Calculated bar - 显示背离的柱线数量, 300 为省缺; Filter by volume -交易量过滤器, false 为省缺。如果它被启用, 则交易量小于前 100 根柱线均值的情况下, 不显示背离。三种模式可用: False, True, Auto。在 Au
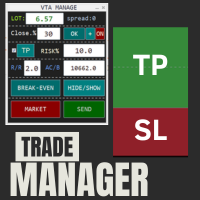
This is a trade manager which is designed to simplify your trading experience and allow you to enter any type of trade with the set risk management within seconds. This trade manager has two modes. (1) The Market order which opens instant orders and the pending orders which consists of buy stop order, buy limit orders, sell stop orders, sell limit order, all these trades can be achieved by moving your stop loss and entry to the desired point and the givn trade will be opened. You do not need to

Using this system is easy. Just open a trade when the market goes up or down, set a profit target and don't worry about a stop loss. The system protects your trades using a smart technique, taking opposite trades with larger sizes if the market goes against you. This creates a "trading channel" with upper and lower profit targets, and all open trades close in profit when one of these targets is reached.

Bushido Scalper 概述
Bushido Scalper 是一款先进的交易机器人(EA),专为 USD/JPY 和 EUR/USD 货币对设计。它利用强大的剥头皮策略,快速捕捉小幅的价格波动,并迅速执行交易,最大化高流动性市场中的盈利潜力。 主要特点 剥头皮策略 :设计用于短期交易,抓住快速的价格波动。 支持的货币对 :特别优化了 USD/JPY 和 EUR/USD。 集成过滤器 :包括 RSI 和新闻过滤器,以提高交易的准确性,并避免高风险时段。 数据日志记录 :将关键交易细节(例如滑点)记录到 bushido_log.csv 文件中,供事后分析。 重要使用说明 回测 最佳结果 :使用 1 分钟的开盘/最高/最低/收盘(OHL)数据进行回测,确保回测结果的准确性。 避免使用 "Every Tick" 模式 :由于机器人的优化执行速度,此模式可能导致执行不一致。 数据提供商 :建议使用可靠的来源,如 Dukascopy,以确保数据的质量和回测的准确性。 经纪商要求 点差 :Bushido Scalper 在原始点差低于 0.5 点时表现最佳。较高的点差可能会减少盈利。
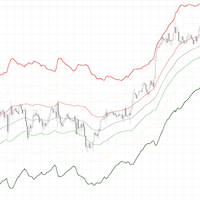
该指标显示了价格的支撑位与阻力位。
如果价格穿过-1.618 价位,并且收盘价连续高于-1.618 价位,做多 , 止损- 1.618价位, 第一止盈 Middle 价位, 第二止盈 +1.618 价位, 第三止盈 +3.618 价位 。 如果价格穿过+1.618 价位,并且收盘价连续低于+ 1.618 价位,做空, 止损 + 1.618价位, 第一止盈 Middle 价位, 第二止盈 -1.618 价位, 第三止盈 -3.618 价位 。 震荡行情中,价格在 -1.618 价位与 +1.618 价位中徘徊。
移动止损: 上涨趋势: 价格穿过-1.618 价位,始终以 -1.618 价位移动止损,如果继续穿过 Middle 价位,移动止损改为 Middle 价位,以此类推: +1.618 价位, +3.618 价位与 +6.18 价位,一般来说 +6.18 价位已经是上涨尽头。 下跌趋势反之亦然。
Indicator that synchronizes the charts, that is, when the asset is replaced in one of the charts, all those that appear with the synchronized indicator are changed, with the same timeframe (Same_Timeframe = true) or with different timeframes (Same_Timeframe = false). The graphics to be synchronized are identified by color (Label). To synchronize the indicators, the indicator must be inserted in all charts to be synchronized, using the same color (Label). A box with the chosen color (Label) and
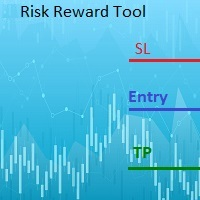
This indicator will help you define the entry, stop loss and take profit by means of horizontal lines on a chart. In addition, it is also possible to calculate the size of a position according to the percentage of the risk that you want to assume.
For this purpose, a panel consisting of the following elements is available:
Button to show or hide the tool on the chart. A text box to enter the number of contracts to be used for the calculations. A text box to enter the risk/reward ratio you want

A simple panel to help you to place orders on the chart using the mouse. Hold Left Shift or Left Ctrl and the panel will show the lines where it will place the order already with stop loss and take profit. Use Shift to place buy orders and Ctrl to place sell orders, the panel will switch between stop or limit orders depending if the mouse is above or below the price. Please be aware that Ctrl key is used by Metatrader to copy an object, try to avoid using this panel with charts where you copy ob

Deposit Multiplier Advisor is a fully automated grid advisor with an information trading panel and simple setup. The strategy is to open an initial order on the market based on indicators based on overbought and oversold zones of the instrument. The Expert Advisor then multiplies the volume of one direction with a grid of pending orders with a set distance in points. When the set profit is reached, the basket of orders is closed and the cycle repeats. The lot size can be fixed or calculated as a

HiLo Activator is one of the most used indicators to determine trend. Find it here with the ability to customize period and colors. This indicator also plots up and down arrows when there is a change on the trend, indicating very strong entry and exit points. HiLo fits well to different types of periods for day trading. You can easily understand when it is time to buy or sell. It works pretty good also for other periods like daily and monthly signalizing long-term trends. The use of the indicato

FTrades is an advanced trading tool designed to maximize efficiency in intraday trading. This [EA] gets BuyStop and SellStop entry signals in a certain range. This EA uses trailing stop that you can configure to your liking and you can indicate the timeframe where you want to make the trades. You can also trade with lots or percentages. The best performing pairs are EURUSD, USDJPY and XAUUSD. I recommend using it from M15 or higher. Free until February 15th

实际应用中的作用
趋势反转识别 :K线倒计时指标通过识别市场的过度买卖行为,帮助交易者捕捉趋势反转的信号。这个指标在市场处于极端状态时尤为有效。 风险管理 :该指标可以帮助交易者在趋势反转之前识别市场的潜在风险,及时调整仓位以避免损失。例如,在看涨倒计时完成时,可以考虑减少多头头寸或在看跌倒计时完成时减少空头头寸。 交易策略 :交易者可以将K线倒计时指标作为交易策略的一部分,与其他技术指标结合使用,以提高信号的可靠性。例如,可以与移动平均线、相对强弱指数(RSI)、布林带等指标结合,以确认趋势反转信号。 时间窗口 :通过倒计时阶段的设定,交易者可以更清晰地了解潜在反转的时间窗口,从而更有效地规划交易策略和执行时间。

Equity Risk Manager EA is a smart, compliance-focused tool designed to protect your trading capital by monitoring equity performance in real time. It automatically blocks new trades when your profit or loss thresholds are reached, based on your selected period — daily, weekly, or monthly. No more accidental overtrading or commission losses: once your target is hit, the EA alerts you and halts further entries. Ideal for disciplined traders who value risk control, clarity, and automation.
Ultimate Trend ADX is a powerful and refined version of the classic Average Directional Index (ADX), designed to give traders a clearer, more dynamic view of market trends and momentum. Unlike the standard ADX, this enhanced tool applies advanced smoothing techniques (EMA or KAMA) and introduces scaling options to make the indicator lines more responsive and visually impactful. The result is a professional‑grade indicator that helps you identify strong trends, spot reversals, and confirm entrie

ZPOWER BUY & SELL INDICATOR
Trade Smarter. Trade Confidently. Trade Profitably.
Are you tired of second-guessing your trades? Do you enter late and exit too early — leaving money on the table? It’s time to upgrade your strategy with the ZPOWER BUY & SELL INDICATOR, built with institutional-grade logic that helps you catch high-probability trade setups with precision.
Why ZPOWER is Different
Unlike ordinary indicators that flood your charts with noise, ZPOWER is engineered with advanced
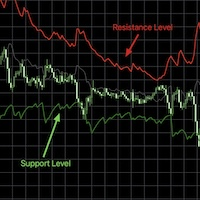
RSI bands provide an intuitive and visual method of understanding how price movements influence the Relative Strength Index (RSI) within its bounded range of 0 to 100. The upper and lower bands typically represent key thresholds—commonly set at 70 and 30—which signal potential overbought or oversold conditions. When RSI approaches or crosses these bands, it may indicate that a reversal or pullback is likely, helping traders identify potential entry or exit points. By plotting these bands on a c

Xauusd Gold Blaster - Automated Gold Trading EA is for XAUUSD M15 only and will not trade on other symbols, Xauusd Gold Blaster is a robust Expert Advisor (EA) designed for automated trading on XAUUSD (Gold) using a proven EMA crossover strategy. Operating on the M15 timeframe, it combines fast and slow Exponential Moving Averages (EMAs) with a Advanced Logic of high-probability trade setups. The EA features re-entry logic, fixed stop loss, and customizable lot sizing, making it suitable for b
MetaTrader 市场 - 在您的交易程序端可以直接使用为交易者提供的自动交易和技术指标。
MQL5.community 支付系统 提供给MQL5.com 网站所有已注册用户用于MetaTrade服务方面的事务。您可以使用WebMoney,PayPal 或银行卡进行存取款。
您错过了交易机会:
- 免费交易应用程序
- 8,000+信号可供复制
- 探索金融市场的经济新闻
注册
登录