 MetaTrader 5
 专家
 指标
 程序库
 实用工具
 窗口小部件
 规则
适用于MetaTrader 5的EA交易和指标 - 554
 使用EA交易和指标,使外汇交易获得更多盈利。EA交易可使您自动开启和关闭交易,而指标将帮助您更准确地预测市场行为。
该页面提供MetaTrader 5应用程序的目录。

Statistic Candles. Утилита для получения статистики с графика "Японские свечи".
Статистика собирается нижеописанными методами.
Выполняет следующие функции: Подсчёт свечей на 19-ти таймфреймах (внутридневные свечи): Количества бычьих и медвежьих свечей в указанном промежутке дат. Количества бычьих и медвежьих свечей в указанном промежутке дат в обозначенное время. Подсчёт количества нестандартных свечей (прим.: Custom _ time = 14:56, Period _ time = 1 H ). Данные средних значений open - close
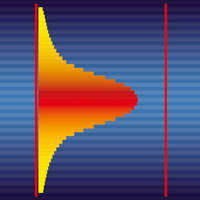
Вертикальная гистограмма объема - отображает распределение объема по уровням. Гистограмма рассчитывается от объема ( реального или тикового), при этом объем соответствующий бару переносится на уровень H-L бара.
Таким образом, при распределении объема за сутки по вертикали - формируются максимумы гистограммы показывающие области проторговки. Настройки индикатора: Timeframe Set - период в пределах которого производится расчет. (рекомендуется D1) Step's - количество отображаемых периодов. Amplitu

Bober Lannister MT5 - is fully automated trading robot. This robot exists more than 3 years and proved its work on a long term distance.
The thing is many of night scalpers on mql5 market place has been made by newbies without proper researches . Don't be fooled by beautiful tester pictures or short term results.
Why Bober Lannister MT5 better then other night scalpers on mql5 market?
-It trades in a wide range of night time 3-6 hours per day. (not just 1 hour catching swaps/high spread

KT MA Crossover 指标根据所选的移动平均线交叉绘制买入和卖出箭头。此外,它还会生成相应的提醒通知,并为每个连续信号显示 MFE(最大有利偏移)值,帮助交易者更好地了解潜在利润区域。 移动平均交叉策略是全球交易者广泛采用的一种经典技术分析方法。通常包含一条快速和一条慢速的移动平均线,根据交叉的方向来确定买入或卖出的交易信号。 买入信号 - 快速均线向上穿越慢速均线。 卖出信号 - 快速均线向下穿越慢速均线。
功能特点 每项均线参数都可完全自定义设置。 每个连续信号都会显示对应的 MFE 值。 代码轻量,占用系统资源极少。 包含所有 MetaTrader 系统提示和警报。
缺点 移动平均线是一种滞后性指标,主要依赖历史数据。在盘整行情中,均线交叉信号可能显得较为随机,容易产生假信号。因此,交易者在实际应用中需要根据自身判断灵活处理这些信号。
输入参数
历史K线数量: 用于计算信号的历史K线数量。 ----- 选择用于计算快慢移动平均的周期和方法 ----- 显示均线: 在图表上显示或隐藏移动平均线(不影响交叉信号)。 绘制利润线: 显示或隐藏 MFE 曲线。

跟踪平滑 Heiken Ashi 状态 KT Heiken Ashi Smoothed 将价格走势显示为平滑的蓝色和红色蜡烛。当状态从看跌转为看涨时,它会绘制蓝色向上箭头;当状态从看涨转为看跌时,它会绘制红色向下箭头,让图表上的方向转换清晰可见。 平滑周期和平滑方法决定蜡烛的平滑程度。与标准 Heiken Ashi 相比,它提供更稳定的走势视图,同时可根据图表选择合适的响应速度。 蓝色蜡烛: 表示看涨状态。 红色蜡烛: 表示看跌状态。 蓝色向上箭头: 标记从看跌转为看涨。 红色向下箭头: 标记从看涨转为看跌。 一眼比较多个时间周期 紧凑的 MTF Scanner 显示从 M1 到 Monthly 各时间周期的看涨或看跌状态。无需切换图表,即可将当前图表与更短和更长的时间周期进行比较。 解读蜡烛形态并调整显示 没有下影线的蓝色蜡烛 可能伴随强劲的看涨走势,而 没有上影线的红色蜡烛 可能伴随强劲的看跌走势。带有上下影线的小实体蜡烛可能出现在方向变化时。 您可以调整平滑周期和平滑方法,也可以设置看涨和看跌箭头的颜色、大小及符号代码,使其符合您的图表布局。 在方向变化时接收提醒 可选择适合您工

We present you a very reliable expert system. The expert system is based on the AC indicator. This indicator generates very reliable signals!
The AC indicator measures the speed of the market’s driving force by subtracting the slow moving average from the fast and then subtracting the fast moving average from this difference. This indicator, despite the present averaging model, can be classified as leading, since it measures precisely the driving force, which first slows down and then changes
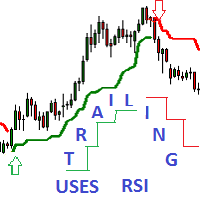
Adaptive Trailing uses RSI Indicator - an indicator of directional movement that allows you to determine the trend at the time of its inception and set the levels of a protective stop.
Trailing can be carried out both from below, when the stop level is below the current price and is pulled up behind the price if it increases, and above, when stop levels are above the current price.
There are two modes for calculating the stop level. Simple trailing is done with a constant distance of Npoints

Using this indicator, you can anticipate the future price behavior of a certain number of bars. The indicator draws a line showing simulated future price values. You can use this information both for entering / exiting the market. So for the installation / correction of stops accompanying the position.
The indicator has several parameters. HistoricBars - The number of historical bars to analyze. FutureBars - The number of bars to predict the price. Prediction - prediction depth coefficient.

Появилось желание торговать движение, пробой на самой высокой волатильности, или запустить советника-усреднителя торговать боковик в тихой низковолатильной гавани тогда этот продукт для Вас! Индикатор анализирует 28 валютных пар (основные и кроссы) и в зависимости от выбранных настроек покажет самые высоковолатильные (max) или наоборот (min). Как измерить волатильность? Существует 2 способа. Первый это измерить рендж заданного количества последних баров (bar). Второй замерить о

Navigators is a great tool for detecting peaks and valleys on a chart. This indicator uses a modified peak and trough detection algorithm. This algorithm includes the Fractals indicator and the ZigZag indicator.
This tool should be used to analyze peaks and valleys, as well as to detect patterns, or for other purposes. You can use this powerful tool for your own purposes at your own risk.

Apollo 3 route 66 It is an advanced trading system. This is a fully automatic Expert Advisor, which allows you to presize the trade according to the preferences of the trader. Apollo 3 route 66 have more customization options for your trade. Different options for different styles of trade. Apollo 3 route 66 is a break system of trade with different algorithm of trade mode. This EA using signals to place orders. Is a revolution in the customization of the trading. The algorithms develo
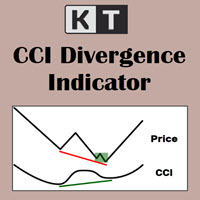
KT CCI Divergence shows the regular and hidden divergence created between the price and CCI oscillator. Divergence is one of the vital signals that depicts the upcoming price reversal in the market. Manually spotting the divergence between price and CCI can be a hectic and ambiguous task.
Limitations of KT CCI Divergence
Using the CCI divergence as a standalone entry signal can be risky. Every divergence can't be interpreted as a strong reversal signal. For better results, try to combine it w

Indicator designed to give investors the advantage of identifying strong candlestick patterns in real time by staining candlesticks representing these patterns, using possible buy or sell performance. The color for each pattern identified by the parameter indicator according to your taste. The candlestick patterns identified by this indicator are: Inside Bar Closing Price Reverse Top (PFRA)
Closing Price Reverse Bottom (PFRB) Dave Landry Bullish Engulf Bearish Engulf Advantages: Real Time At eac

Best Scalper Oscillator is an indicator for MetaTrader 5 based on mathematical calculations on the price chart. This is one of the most common and useful indicators for finding the trend reversal points. Best Scalper Oscillator is equipped with multiple types of notification (push notifications, emails, alerts), which allows opening trades in time.
Distinctive features Generates minimum false signals. Excellent for identifying trend reversals. Perfect for scalping. Suitable for working on th
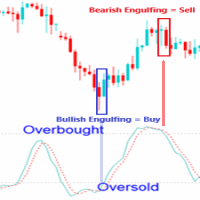
EXPERT ADVISOR DESCRIPTION
- Expert Advisor Engulfing in OBOS (Overbought Oversold) is an expert advisor consisting of a combined candle engulfing pattern and Stochastic Oscillator indicators. A Buy position occurs when engulfing are formed when the signal stochastic indicator is in the oversold area, A sell position occurs when engulfing are formed when the signal stochastic indicator is in the overbought area. - You can combine engulfing that form in certain timeframes with a signal stochast
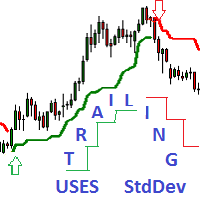
Trailing Uses Standard Deviation.
A daptive_Trailing_uses_StdDev_Indicator is an indicator of directional movement that allows you to identify a trend at the time of its inception and set the levels of a protective stop.
Unlike trailing with a constant distance, the indicator uses the distance to the price proportional to the current standard deviation of StdDev. The distance is equal to the product of the standard deviation and the constant coefficient set by the user.
Thus, the trailing

This is a multicurrency and multitimeframe indicator that calculates the angle between two points. Points for measuring the angle can be taken from the ZigZag (the last two points), or from the Moving Average (between two given bars), or it can be the closing prices of bars.
Angle measurement is possible in degrees or in radians. You can select the scale for the calculation. For a better understanding of the indicator, you can study the free Angle High Low indicator. In the parameters you can
This bot can classify ticks into classes from 0 to 64, after which after analyzing the tick micro-signals it determines which way to open a position. You can work with an expert only on real ticks how to optimize and test!
When working, an expert uses position accounting in any mode, both netting (there can be only one position for one symbol) and with independent position accounting or hedging (there can be many positions for one symbol).
Configurable bot parameters TypeFilling - Type of exe
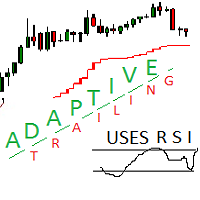
Adaptive trailing uses rsi
Adaptive trailing uses rsi - это скрипт, который реализует трейлинг, а именно: вычисляет уровень защитного стопа, отображает уровни на графике, исполняет заданные пользователем торговые операции при достижении ценой стоп уровня. Режимы работы. Трейлинг может осуществляться как снизу, когда уровень стопа ниже текущей цены и подтягивается за ценой, если она возрастает, так и сверху, когда уровни стопа выше текущей цены. Предусмотрено два режима расчета стоп уровня .

指标MTF Qristalium箭头是一个半自动交易系统。 它适用于所有货币对。
该指标使用三条规则:1)我们只交易趋势,2)"当每个人都卖出卖出,当每个人都买入卖出",3)价格总是违背人群。
指标MTF使用内置指标在多个时间范围内使用Qristalium箭头过滤规则。 如果趋势与所选时间间隔匹配,则指标将显示一个进入市场的箭头。 然后你自己做决定。 买-绿箭,卖-红箭头。 在指标中,您可以更改批次,设置EA的交易时间和关闭时间。 您还可以更改工作时间段和时间筛选器。 有一个蜂鸣声。 建议的工作周期D1。 滤波器H1和H4。 设置: TF-工作期间(建议D1) CCI_Period CCI等级提升 CCI级别Dn CCI价格 SAR步骤 SAR最大值 TF Filter1-(推荐H1) TF Filter2-(推荐H4) 工作时间 声音使用 MaxBars
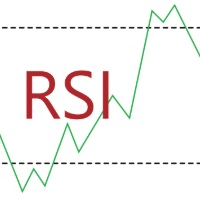
The Relative Strength Index (RSI), developed by J. Welles Wilder, is a momentum oscillator that measures the speed and change of price movements. The RSI oscillates between zero and 100. We have added to the reputable RSI indicator several types of alerts and a signal interval filter to be incorporated in your Expert Advisors. It works in ALL Timeframes ans instruments.
Product Features Email Alert Sound alert Push Notification (Alerts can be sent to your mobile phone) Signs on chart Alert b

This bot is based on the analysis of adaptive moving averages. The expert is characterized by stable signals, which can be used as accurate short-term signals. This is a semi-scalping system that analyzes the market using reliable indicators. Scalper is a system or not, depends on the parameters TakeProfit and StopLoss . Using this adviser, you need to understand that this bot requires optimization. The bot works both on netting accounts and on hedging accounts. But the settings must be optimiz

在做出交易决策时,不仅要依赖历史数据,而且还要依赖当前的市场状况,这很有用。为了使监视市场趋势的当前趋势更加方便,可以使用AIS Current Price Filter指示器。 该指标仅考虑一个方向或另一个方向上最重要的价格变化。因此,可以预测近期内的短期趋势-无论当前市场形势如何发展,当前价格迟早都会越过该指标的界限。从交易者的角度来看,最有趣的是价格已经尽可能远离指标水平的情况。这些时刻对于打开新的交易头寸可能是最理想的。 指标的操作不取决于所选的时间范围,而是使用两个参数进行配置。 FS -可以用来设置灵敏度阈值的参数。它越大,价格移动就应该越强,以便在指标中将其考虑在内。其可接受的值在0-255的范围内。如果选择零值,则灵敏度阈值将等于电流范围。 LB -设置在指标计算中使用的背景深度。此参数的有效值也在0到255的范围内。如果它等于零,则将考虑所有具有自学习控制的历史数据。并且,如果此参数等于1,则指标将仅标记FS参数指定的价格偏差。 其余参数使您可以配置图表上指标的显示。 Width -设置单个指示器线的粗细。 Color -指标线的颜色。 Style -指标显示样式。
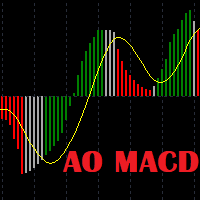
Awesome Oscillator Moving Average Convergence/Divergence Indicator. Not late as AO and not noisy as MACD. The basic version of the indicator is presented. The "PRO" version is under development with such features as sending signals to e-mail and plotting divergence and convergence lines on the chart.
Input parameters: Fast: short EMA Slow: long EMA Signal: signal line Colors: Red: MACD < Signal Green: MACD > Signal Gray: MACD above Signal, but lower than the previous MACD MACD below Signal, but

策略 1.缩放模式策略 EA遵循指标的价格方向,然后在TP1获利。然后进程重新启动。 如果未触发TP1且指标改变方向,则保持交易,并相应地打开一个相反的乘数,直到TP2,但乘以市场交易数。 重复此步骤,直到获得等于交易数量X TP2的利润。
2.趋势追踪模式策略 EA相应地遵循指标的价格方向,然后在交易有利可图时获利,并且仅在价格方向反转时获利。 然后进程重新启动。 如果交易在价格方向改变时没有获利,则交易被持有,并相应地打开一个相反的乘数,直到新的价格方向改变为止。 重复此步骤,直到下一个价格变动的交易总和为正时为止。
一般安全参数 EA具有许多用于防止余额减少的技能,称为恢复模式,最大交易模式和最大保证金模式。其中一些与交易单一资产有关,其他与防止一般余额直接付款有关。 例 如果市场交易过多,EA将自动停止,不输入新的交易周期,如果触发TP3,则关闭当前交易周期。 如果交易数量过多,则对应于最大交易数量参数,EA进入恢复模式,并在一定时间和一个周期内关闭交易,总是有利润,依此类推。
结论 通过在https://t.me/TraderDream上的电报组并下载正确的设置可以看

Indicator SR levels true in small time frames is very useful for scalping while in bigger ones it is good for day or position trading.
SR levels true can draw 4 support/resistance levels based on defined maximum rebouds from price level. Indicator scans defined number of bars in time axis and defined number of pips in price axis (both sides - up and down) and calculates how much times price was rejected from scanned price levels. At the price levels where maximum rebounds are counted, support

可持续的分配可用于平滑财务系列。由于可以使用相当深的历史来计算分布参数,因此在某些情况下,与其他方法相比,这种平滑甚至更有效。
该图显示了H1时间框架内EUR-USD货币对的开盘价分布十年的示例(图1)。看起来很迷人,不是吗?
该指标的主要思想是通过价格分散来确定可持续分配的参数,然后使用这些数据来平滑财务序列。由于这种方法,在给定的市场情况下,平滑后的值将趋于最可能的价格值。
使用参数LB组态指示器的操作。它的值确定平滑序列的长度,以巴表示。允许值在1-255的范围内。
蓝线表示平滑的高价,红线表示低价,绿线表示收盘价。
该指标的主要缺点是无法设置平滑窗口的宽度,因此指标在历史记录的所有部分中均保持稳定。因此,交易者必须根据其特定要求选择参数。

Expert Advisor Raikow FX EA operates using the Vegas Tunel strategy, which consists of fibonacci levels above and below the 169 period moving average. It can operate on trend and counter trend.
It has margin control, open order limit, positive swap control and filter indicators like RSI and ADX. It also has dynamic and fixed take profit in the fibonacci levels and trailling stop levels. For more information visit our Telegram group https://t.me/RaikowFXEAEN

MTF顾问Qristalium平均与程序员亚历山大Gavrilin一起创建。 这个系统是完全自动化的。 这不是鞅。 平均在这里工作。
它适用于所有货币对。
EA使用三条规则:1)我们只在趋势上交易,2)"当每个人都卖出时买入,当每个人都买入时卖出",3)价格总是与人群相左。
MTF Qristalium Average使用内置指标在多个时间帧上筛选这些规则。 由于市场和趋势受到经济和政治新闻的影响,EA包括平均功能,可以在设置SL中禁用和启用(我建议100)。 在EA中,您可以更改手数,设置获利的大小(当平均TP从盈亏平衡点计算时-您也可以更改设置)和止损,设置平均时的步长,设置EA的交易时间和其关闭的时 您还可以更改工作时间段和时间筛选器。
建议的工作周期D1。 滤波器H1和H4。 将该步骤平均化100。 存款1000$,手0.01
设置:
工作时间 修复很多(建议每1000$0.01) TP100 SL0(如果平均使能则为0,如果禁用则为100) AverageUse-true/false(是使用平均还是不使用) LotMn-1.59(批次乘数 )

Basket trading /Basket SL TP Automatic SL TP Calculation
This utility will calculate SL and TP based on 2 input parameters
PerUnitTP -This means what is per .01 TP like 1 $ per .01 Lot. SLToTP_Ratio-This what is ration SL to TP if this parameter is 3 that means if TP is 1 $ then SL will be 2$ (per .01 Lot)
so if total portfolio summing to .05 lot that that means TP will be automatically become 5 $ and SL become 10 $.
This is very good utility when you want set SL TP for many open trade

Basket trading /Basket SL TP/Portfolio SL TP/ Group Trade SL TP
This is very good utility when you want set SL TP for many open trades or portfolio
As soon your account equity reach SL or TP , This EA will close all trades . you are allowed to change SL and TP any time.
Also you need not to monitor group trades all the time you just set SL and TP in utility and relax once SL / TP situation will come all trades will be closed automatically.
SL and TP are in $Amount like 100$ SL and 500$ TP

Moon 3 is a Trend indicator. I s a powerful indicator of TREND for any par and any timeframe. It doesn't requires any additional indicators for the trading setup.The indicator gives clear signals about opening and closing trades.This Indicator is a unique, high quality and affordable trading tool.
Perfect For New Traders And Expert Traders Low risk entries. Never repaints signal. Never backpaints signal. Never recalculates signal. For MT5 Only Great For Scalping Great For Swing Trading Arrow

Trailing Stop Fast Trailing Stop Fast EA locks trade profit once trade moves in profit by certain points(eg 100 points) by moving the Stop Loss in direction of trade.
There are three inputs in EA to be provided by user to EA TrailingStart this input used as activator when trade moved 100 points towards profit, this EA will start shifting your stop loss towards profit.
TrailingStop input defines what should be the distance of stop loss from current market price once TrailingStart activated

This indicator will show a vertical representation of the volume distribution within a selected user range. For a free demo version go to https://www.mql5.com/en/market/product/42482 . Main features: This Indicator will create an image that will allow viewing the tick volume per price level in a graphical form. The indicator will work on any range size in any time-frame, limited only by your computer memory and performance. Recommended time-frames are: M1 to H1.
Inputs:
Price Calculated - s

KT Bollinger Bands Trader 是一款 100% 自动化的智能交易顾问(EA),基于布林带在低波动时期的均值回归交易策略构建。价格经常在布林带的上轨或下轨附近产生反应,但并非每次都会发生反转。然而,在低波动期间,价格反转的可能性更高。
入场规则 当价格正确下穿布林带下轨时,开启买入交易。 当价格正确上破布林带上轨时,开启卖出交易。 出场规则 在低波动阶段结束时自动平仓。 也可在达到止损或止盈时平仓。 本 EA 在经典布林带策略基础上进行了诸多改进,允许用户通过内置的趋势过滤器、波动率过滤器、Vortex、MMI 和星期过滤器等工具,对策略进行细致调节。
输入参数
----- 策略设置 ----- 布林带周期、带移位、带偏差 开始时间(Start Hour) 结束时间(End Hour) GMT 时区偏移(GMT offset)
----- 交易设置 ----- 手数类型:固定手数 | 自动手数 每单风险百分比(Risk Per Trade)
----- 出场设置 ----- 止损方式:无止损 | 基于波动率 | 固定点数 止盈方式:无止盈 | 基于波动率 |

The Willing horse Expert Advisor EURUSD trades on the signals of the Moving Average, Stochastic Oscillator, Average True Range indicators; uses a variety of intelligent strategies, without martingale, hedging or grid; applies stop loss to protect your capital; there is a capital management system, it has restrictions on the volume of trading positions (in% of the deposit). This advisor does not require adjustment, just attach it to the M1-chart of EURUSD. You can test any period from 01/01/2018.
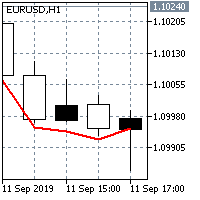
SEMA is the Sextuple Exponential Moving Average:
SEMA = PEMA + QEMA(y - PEMA)
The principle of its calculation is similar to Double Exponential Moving Average (DEMA). The name "Sextuple Exponential Moving Average" does not very correctly reflect its algorithm. This is a unique blend of the single, double, triple, quadruple and pentuple exponential smoothing average providing the smaller lag than each of them separately. SEMA can be used instead of traditional moving averages. It can be used

主要思想。 首先,这是基于相同策略应用于不同指标的EA系列的第二个产品。 这意味着将相同的策略和相同的资金管理应用于具有扩展主过滤的不同指标。 最终目标是设计一种可能具有更高成功率且总体损失最低的EA。 这种特殊性将使人们对EA的使用充满信心,从而获得长期的满意。
策略 1.缩放模式策略 EA遵循指标的价格方向,然后在TP1获利。然后进程重新启动。 如果未触发TP1且指标改变方向,则保持交易,并相应地打开一个相反的乘数,直到TP2,但乘以市场交易数。 重复此步骤,直到获得等于交易数量X TP2的利润。
2.趋势追踪模式策略 EA相应地遵循指标的价格方向,然后在交易有利可图时获利,并且仅在价格方向反转时获利。 然后进程重新启动。 如果交易在价格方向改变时没有获利,则交易被持有,并相应地打开一个相反的乘数,直到新的价格方向改变为止。 重复此步骤,直到下一个价格变动的交易总和为正时为止。
一般安全参数 EA具有许多用于防止余额减少的技能,称为恢复模式,最大交易模式和最大保证金模式。其中一些与交易单一资产有关,其他与防止一般余额直接付款有关。 例 如果市场交易过多,EA将自动停止,不输
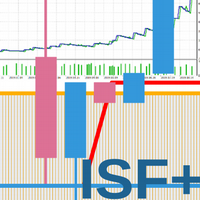
The system is based on signals from three indicators: Ichimoku Kinko Hyo indicator Stochastic Williams Fractals Each indicator works on its own timeframe. Note : input defaults are not optimized. Test the expert on a demo and configure the input parameters in accordance with the acceptable risk and goals.
INPUT PARAMETERS Magic Number
Every Tick (false - Every Bar)
Inputs for main signal: The threshold value of the signal to open [0...100]
The threshold value of the signal to close [0...100]
P

Signal: https://www.fxblue.com/users/nzdjpy_h1_e01_ddgrd Set file JJ_NZDJPY_H1_E01V01 for 1k account (adjust risk setting and backtest for other accounts) Legacy Update (7.0) Simplified Use : Set to default settings. Change trading mode to "use JJ_NZDJPY_H1_E01V01 strategies". Retired Features : "Use barcode files" and "create barcode files" options are retired. Single barcode scanning is still available and can be manually added in "compatibility mode". Multi Strategist (MS) Overview ( Manua
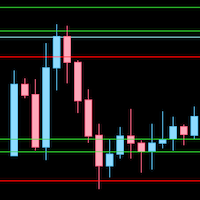
Draw levels of support and resistance based on highs/lows or closes from daily, weekly or monthly. This indicator uses the highs, lows or closes to draw horizontal lines on the graph. By observing those lines you can identify trend (gaining or losing levels of resistence/support) and find good levels where price can bounce. For those who trade price action, this is a very useful indicator.

此指标可让您确定价格达到一个或另一个级别的可能性。它的算法非常简单,并且基于对特定货币对的价格水平的统计数据的使用。由于收集的历史数据,可以确定价格在当前柱形期间的变化程度。 尽管简单,但该指标可以为交易提供宝贵的帮助。因此,在其帮助下,可以确定交易头寸的TakeProfit和StopLoss水平。它可以帮助确定挂单的价格和确定TrailingStop的价格水平。 此外,该指标可以纳入现有战略。例如,您使用某种日内策略。然后,通过在D1时间框架上设置此指标,您可以在克服已经不希望开启新交易头寸之后获得水平。 该指标的主要缺点是它完全依赖于历史数据,并且不会以任何方式对某些当前的市场变化作出反应。 通过选择输入参数-L1 ... L4来执行该指标的设置 - 每个输入参数确定从每个柱的开盘价达到价格价格的概率。每个参数的值必须在99 ... 0之内,并且以下每个参数必须严格小于前一个参数。 尼古拉·尼古拉耶维奇(Nikolai Nikolaevich)是创造这个指标的意识形态灵感,如果你喜欢这个指标,那就写下几句话,我会告诉他。

Apollo 2 The wall It is an advanced trading system. This is a fully automatic Expert Advisor, which allows you to presize the trade according to the preferences of the trader. Apollo 2 have more customization options for your trade. Different options for different styles of trade. Apollo 2 the wall is a break system of trade with different algorithm of trade mode. This EA using signals to place orders. Is a revolution in the customization of the trading. The algorithms developed for the id
Introduction to X3 Chart Pattern Scanner X3 Cherart Pattern Scanner is the non-repainting and non-lagging indicator detecting X3 chart patterns including Harmonic pattern, Elliott Wave pattern, X3 patterns, and Japanese Candlestick patterns. Historical patterns match with signal patterns. Hence, you can readily develop the solid trading strategy in your chart. More importantly, this superb pattern scanner can detect the optimal pattern of its kind. In addition, you can switch on and off individu

The 3 Automatic Vwap (Midas) Indicator can be used for Price and Volume studyers to map the movement of market drivers. It automatically plots 3 Vwaps, two of which are dynamic and will be updated throughout the day if new highs or new lows emerge. The third Vwap is daily and can help if the trend is up or down. Also, an auxiliary indicator that plots (also dynamic) points of interest with OHLC prices (Open, High and Low of the current day and Close of the previous day) was inserted. Success and

This EA uses a variety of strategies and functions such as neural network grid scalping, mobile stop loss, automatic lot number setting, etc. Use revolutionary price model algorithms, price behavioral trading, and signature collaborative work with artificial intelligence adaptive processing units. The system adopts some kind of reverse sampling development method, which makes the system show a very substantial benefit in the 13-year historical backtesting. Profit drivers to keep profits maximiz

TickChart Indicator plots tick line on the main window of MetaTrader. ( Free version of this is "TickChart Indicator Lite" )
The tick-line shows the most detailed, fastest and real-time activities of the market, which are usually hidden in bars or candles longer than 1 minute. Usually, several new tick-line segments appear while a bar of M1 time frame is completed. After the release of an important economic indicator, the number of ticks per bar may exceeds 100. This indicator overlays the tick

LT EXHAUSTION OSCILLATOR — 多头与空头耗尽振荡器 概述 LT Exhaustion Oscillator 是一款先进的技术指标,通过独特的多层过滤系统来衡量买方(多头)和卖方(空头)的耗尽程度。它能够减少传统振荡器(RSI、Stochastic、CCI)高达 90% 的市场噪音,在真正的反转位置提供清晰的超买和超卖信号。 非常适合希望寻找高概率入场机会并减少虚假信号的交易者。 工作原理 该指标通过 4 个渐进式平滑层来过滤市场力量: L0:捕捉原始的 Bulls Power(多头力量)与 Bears Power(空头力量) L1-L3:三层过滤器,用于消除噪音和随机波动 结果:指标线在 0% 至 100% 之间波动。 0-10%(超卖):卖方力量耗尽 → 买入信号 90-100%(超买):买方力量耗尽 → 卖出信号 10-90%(中性):无明确交易信号 主要功能 多层过滤(4 级):最多可减少 90% 的虚假信号 智能平滑(Gamma 可调):0.0-1.0,用于平衡响应速度与平滑度 反转检测:精准识别不同区域之间的转换时机
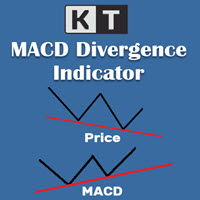
KT MACD 背离指标显示价格与振荡器之间的常规背离和隐藏背离。如果你的交易策略是基于趋势反转,可以使用 MACD 的常规背离来捕捉潜在的转折点。而如果你的策略是基于趋势延续,MACD 的隐藏背离将是一个不错的选择。
KT MACD 背离的局限性
将 MACD 背离作为单独的入场信号可能存在一定风险。并非所有的背离都能解释为反转信号。为了获得更好的效果,建议将其与价格行为分析和其他交易方法结合使用。
功能特点
标记价格与振荡器之间的常规和隐藏背离。 为提高准确率并减少图表杂乱,会自动忽略不对称的背离。 支持趋势反转和趋势延续两种交易策略。 完全支持嵌入到智能交易系统中使用。 可用于入场信号和出场信号。 支持所有 MetaTrader 警报功能。
什么是背离? 一般来说,如果价格创出更高高点,那么振荡器也应创出更高高点;如果价格创出更低低点,那么振荡器也应同步走低。当这种正常的行为没有出现时,就表示价格和振荡器之间出现了背离。背离主要分为两种类型:
常规背离
常规看涨背离:当价格创出更低低点,但振荡器却创出更高低点。 常规看跌背离:当价格创出更高高点,但振荡器却创出更低高点。

DYJ ArtOfMakingMoney attempts to gauge bullish and bearish forces in the market by using two separate measures, one for each type of directional pressure. The EA's BearsIndex attempts to measure the market's appetite for lower prices
The EA's BullsIndex attempts to measure the market's appetite for higher prices Input: m_magic = 54289721 -- magic number InpTF = PERIOD_H1 -- TimeFrame InpLots = 0.01 - - Lots InpLotsExponent = 1 --

Pivot levels indicator shows 7(9 for Camarilla) pivot levels. It is adjusted for major use, including: all standard time frames
choice of periods to show four popular calculation formulas (typical, median, weighted and Camarilla)
pivot day shift choice of properties for lines and labels choice of showing alerts when crossing pivot lines Parameters: ----------Main parameters----------- Timeframe - time frame for pivot levels
Number of periods to show - displays pivot levels for number of periods

MOON 2 THE WALL is a Oscilator indicator. I s a powerful indicator of TREND for any par and any timeframe. It doesn't requires any additional indicators for the trading setup.The indicator gives clear signals about opening and closing trades.This Indicator is a unique, high quality and affordable trading tool.
Perfect For New Traders And Expert Traders Low risk entries. Never repaints signal. Never backpaints signal. Never recalculates signal. For MT5 Only Great For Scalping Great For Swin

Описание Данный индикатор строит (альтернативные, математически рассчитанные) уровни поддержки и сопротивления, а так же уровни, к которым с большой вероятностью придет цена в ближайшее время. Следует обратить внимание на то, что расчет уровней производится на исторических данных, и качество котировок играет важную роль при построении индикатором линий. Замечу, что отрисованные Magneto и Magneto Weekly линии не изменяют свои значения на всем расчетном периоде. Важное изменение! Добавлена функция

Compare Symbols Specifications is a utility indicator that is a summary interactive table of the analyzed parameters. Trading conditions in the market are constantly changing and tracking these changes is a time-consuming task. This tool allows you to compare the trading conditions of all symbols in a matter of seconds, and choose for trading those symbols that meet the requirements of the trading system. This tool will be useful to all traders and will help them to have up-to-date information

The analyzer makes it possible to quickly assess spread changes on historical data, the magnitude and frequency of bursts, the dynamics and nature of the extensions by the days of the week, etc.
The analyzer needs to be started in the tester (visualization mode) on the symbol and time interval required for analysis, recommended TimeFrame H1, select "Every tick based on real ticks" mode.

Robô Pepito. Pepito é um robô para day trade em mini índice Bovespa. Desenvolvido com uma estratégia que funciona exclusivamente com o ativo WIN, melhorando assim a sua performance e visando mais Ganhos e menos Perdas. - Negociação no ativo Mini Índice (WIN) na BM&F BOVESPA; - Operações 100% day trade; - O robô vai configurado para realizar apenas uma operação ao dia, mas isso pode ser alterado nos "Parâmetros de entrada".
ATENÇÃO: Tipo de conta: [x] Netting, [ ] Hedge. Ativar o horário de fun
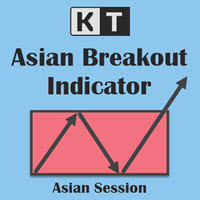
标记亚洲时段区间 KT Asian Breakout Indicator 标记四小时亚洲交易时段窗口的最高价和最低价,并在区间完成后继续监测价格。GMT Offset 用于使时段与经纪商服务器时间保持一致,Draw Session Box 用于控制是否在图表上显示该区间。 同时查看突破与交易水平 当价格收盘于时段最高价上方时,指标显示看涨箭头。当价格收盘于时段最低价下方时,指标显示看跌箭头。启用 Draw Stoploss and Profit Targets 后,图表会添加入场线、位于区间另一侧的 Stop Loss,以及三个计算得出的目标水平。 看涨突破: 使用时段最低价作为保护水平。 看跌突破: 使用时段最高价作为保护水平。 目标 1、2 和 3: 根据区间大小和当前波动率提供分阶段参考水平。 突破状态: 识别突破蜡烛相对于时段区间明显偏大的情况。 查看历史信号表现 Performance Analysis 分析已加载图表中的已完成信号,并可显示 Total Signals、Win/Loss、Success Rate、以点数表示的 Average Profit,以及当前突破状态。
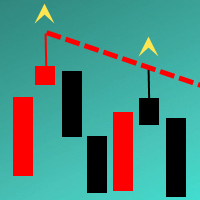
The Indicator automatically draws trend lines on the specified timeframe ( Trend lines period parameter). The lines are drawn based on the last two known fractals of the specified period. If you want the lines to be drawn only on the confirmed fractal, then set the Confirmed or unconfirmed fractal parameter to True . Indicator feature - lines are drawn with the accuracy of any timeframe. It allows analyzing the chart on smaller timeframes without loosing the precision of drawing the lines in re

This EA is to create one or more polling trading strategies in a transaction. In the polling mode, the strategies filter a trend-free range market environment and trades are placed in the opposite direction at the edges of the range. With an additional main trend filter in the trend-following mode, the DYJ's ArtOfForexWar can also trade pull-backs during trends in the trend of loss. The winning rate is more than 95% within three orders or three closes.
List of indicators: SunTzuArtOfWar(ADX) St

"TPA Sessions" indicator is a very important tool to complement "TPA True Price Action" indicator . Did you ever wonder, why many times the price on your chart suddently turns on a position you can't explain? A position, where apparently no support or resistance level, or a pivot point, or a fibonacci level is to identify? Attention!!! The first run of the TPA Session indicator must be in the open market for the lines to be drawn correctly.
Please visit our blog to study actual trades with

Expert advisor based on your own personal MACD. Whatever your strategy is, it's him. You can use it on all parities. No restrictions.
Buy Settings : Buy Fast EMA Period Buy Slow EMA Period Buy Signal Period Buy Lot Size Buy Stop Loss Level Buy Take Profit Level
Sell Settings : Sell Fast EMA Period Sell Slow EMA Period Sell Signal Period Sell Lot Size Sell Stop Loss Level Sell Take Profit Level

Buy and sell settings fixed M15 (M1-M5-M15). expert advisor does not work in the upper time frames. Important Main Trend Buy and Sell : You can set TP and SL to zero (0). In this case, transactions are automatically closed at maximum level during trend conversion times and continue to trade according to the trend. If you choose to use each TP and SL, each trend opens a process for change. However, the trend continues to trade in the direction of trend in the transformation. Pullback Buy and Sel

Buy and sell settings fixed M15 (M1-M5-M15). expert advisor does not work in the upper time frames. Important: You can set TP and SL to zero (0). In this case, transactions are automatically closed at maximum level during trend conversion times and continue to trade according to the trend. If you choose to use each TP and SL, each trend opens a process for change. However, the trend continues to trade in the direction of trend in the transformation. You can use it on all parities. No restriction

The current Rise and Fall is judged from the Commodity Channel Index (CCI) of the three cycles and displayed in a panel by color coding.
The second and third of the three cycles are changed according to the correction factor multiplied by the first cycle (minimum cycle).
In addition, each CCI is displayed with ATR (Average True Range) corrected for variation.
When two of the three CCI are complete, Trend_1 is displayed.
When all three are complete, Trend_2 is displayed.
// ---
Squeeze is

The trading system utilizes a real breakout strategy with an intelligent calculation engine to eliminate bad signals. The EA has only been developed and optimized for EURUSD H15. We recommend choosing a broker with a fixed spread of 5 to 20 points, with a zero STOPLEVEL and five-digit quotes. You can change the settings and try other pairs for better results. Trades are always protected with STOPLOSS, Smart Trailing and Breakeven. This EA is very easy to use. No grid No martingale МetaТrader 4 v

发现信号很好,但提供商的信号太小?您需要更大的持仓量,但终端设置太差?信号手数管理器将通过所需交易量的重复订单来增加提供商的头寸交易量。 只需设置手数大小和用于复制订单的信号名称即可。 Signal Lot Manager 是一个批量乘数实用程序,用于在您的终端上复制订单。来源可以选择任何顾问、手动交易、单独的交易信号。它具有广泛的功能、简单的设置以及高速度和可靠性。 Signal Lot Manager 安装和输入指南 如果您想获取有关 EA 的通知,请将我们的 URL 添加到 MT4/MT5 终端(参见屏幕截图)。 MT4版本 https://www.mql5.com/en/market/product/34864 MT5版本 https://www.mql5.com/en/market/product/41610
一般输入:
信号标题:信号的名称(您可以从信号顺序注释中复制它)。 最大限度。滑点:开仓交易可接受的最大滑点。因此,如果当前价格超过最高价格。与信号订单的入场价格相比的滑点距离,交易不会被复制。这对于防止复制交易出现不必要的滑点非常有用,特别是在高波动
This EA trades using Moving Averages Crossovers. It offers fully customizable settings, flexible position management settings. Easy to use and supervise Fully customizable moving average settings Customizable TP Works for ECN/Non-ECN brokers Works for 2-3-4-5 digit symbols Trading can be NFA/FIFO Compliant Trades will be closed on opposite signals Built-in money management The EA implements the following behaviors: Regular: Buy on bullish crossovers and sell on bearish crossovers Reverse: closes

Apollo 1 box break It is an advanced trading system. This is a fully automatic Expert Advisor, which allows you to presize the trade according to the preferences of the trader. Apollo 1 have more customization options for your trade. Different options for different styles of trade. Apollo 1 box break is a break system of trade with different algorithm of trade mode. This EA using signals to place orders. Is a revolution in the customization of the trading. The algorithms developed for the
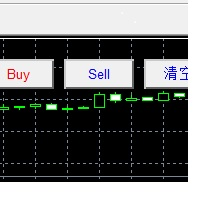
快捷操作,快速买,卖,清空操作。 提供三个按钮:Buy,Sell,清空。 Buy:点击后快速下多单,默认1手,盈利点和止损点都是110点,下单成功后可手动修改。 Sell:点击后快速下空单,默认1手,盈利点和止损点都是110点,下单成功后可手动修改。 清空:快速全部订单清仓,包括买,卖订单。 提供快速操作,默认大小,盈利点和止损点都可以单独找我,定制开发。 图表可以自行设定品种,时间周期。 快捷操作,快速买,卖,清空操作。 提供三个按钮:Buy,Sell,清空。 Buy:点击后快速下多单,默认1手,盈利点和止损点都是110点,下单成功后可手动修改。 Sell:点击后快速下空单,默认1手,盈利点和止损点都是110点,下单成功后可手动修改。 清空:快速全部订单清仓,包括买,卖订单。

FZR indicator determines fractal zigzag reversal pattern of all the time frames of the chosen symbol and shows the information in the Info label. Indicator draws the detected pattern in the chosen time frame and also you can select in the menu to draw the trend line according to FZR peaks. What it is FZR? See the first picture in the screenshots. As you can see for every peak of FZR the AO indicator must cross zero line. FZR indicator determines the trend direction.
How to use FZR for trading?
MetaTrader市场是一个简单方便的网站,在这里开发者可以出售自己的交易应用程序。
我们将帮助您发布您的产品,并向您解释如何为市场准备您的产品描述。市场上所有的应用程序都是加密保护并且只能在买家的电脑上运行。非法拷贝是不可能的。
