 MetaTrader 5
 专家
 指标
 程序库
 实用工具
 窗口小部件
 规则
适用于MetaTrader 5的EA交易和指标 - 549
 使用EA交易和指标,使外汇交易获得更多盈利。EA交易可使您自动开启和关闭交易,而指标将帮助您更准确地预测市场行为。
该页面提供MetaTrader 5应用程序的目录。

趨勢指示器,在圖表上繪製2條不同顏色的條。一個車道換到另一個車道意味著市場在相反的方向反轉。指標還在圖表上放置了3條平行的虛線高,中,低線,分別顯示了成形反轉的頂部,中間,底部。
參量 深度 - 指標計算的深度,參數越高,信號越長 ; 偏差 - 繪圖期間指標的偏差 ; 後退步 - 轉向顯示的強度越小,強度越大 .
___________________________________________________________________________________________________________________________
* 交易策略 . - 繪製上升線時,這是一個買入信號 ; - 繪製下降趨勢時,這是賣出信號 .

With it, you leave pre-configured two expansion settings and one fibo retraction configuration to use via keyboard shortcut and mouse click.
That is, the Fibo_Z utility facilitates the use of MT5's native functions.
The shortcut keys are:
"Z" configuration 1 of the expansion.
"X" expansion setting 2
"Z" retraction configuration.
"V" clears objects from the screen.
It is.
Success and good trades!

该机器人是 RPTrade Pro Solutions 系统的一部分。 Netting Scalper 是一个使用动态动态和净额结算系统的快速交易机器人。
它旨在供任何人使用,即使是绝对的交易初学者也可以使用它。 专为 M1 设计 使用获利、止损和追踪止损。 也可作为无止损/止盈的开关 适用于任何对 它是如何工作的 Netting Scalper 是一款快速的 M1 黄牛。 它没有使用任何指标。 它遵循经纪人的分时分布。 交易被 TP/SL/TS 或下一个相反的交易停止。 没有对冲,没有平均。 一笔交易必须在下一笔交易开始之前结束,但它可以进行多笔交易。 Netting Scalper 控制每个分时,有必要仅在实际分时对其进行优化。
净剥头皮工作 使用任何工具,如外汇对、指数、金属、期货或任何其他工具。 每种不同的工具都需要优化和回测 与任何经纪人。 在 NETTING 帐户上。
测试 在测试之前观看教程视频 检查“最大手数”和“每笔交易输入手数”,最好都输入 100。手数将由资金管理系统自动调整,以适应下面所示的百分比风险。 另请查看“在 x% 处停止交易”,默认值为 1

The WT Vwap Bands indicator is an indicator that combines price and volume, helping to show whether the price is within the "fair price", overbought or oversold.
The indicator code was designed for performance and has already been tested in a real trading account.
In addition to the visual inputs (color, thickness and line style), the user can define a% value that depends on the price.
The default values work with the most distant band at 1% of the price and then dividing this distance in

On Control EA MT5 V2 Game-Changing Software For The Forex Market On Control EA was created to help traders like you maximize their income. How would you like to gain access to a world-class proprietary piece of software designed for one purpose, to improve your Forex strategy? Let’s be honest, it can be hard to understand which technical analysis & trading signals you should follow. With On Control EA, you now have a powerful tool that will enhance your Forex trading strategy & elevate your in

Classic RSL This is the classic indicator "Relative Strength Levy" (RSL), according to Dr. Robert Levy's study, called "The Relative Strength Concept of Common Stock Pricing", which was released as a hardcover book in late 60's of the last century.
Key concept Use this indicator on various instruments to compare their relative strength: The resulting analysis values will fluctuate around 1 The strongest instruments will have the highest RSL values (above 1) and the weakest instruments wi

The Stepper indicator generates Signals in strong Trend zones. Even when the Trend is set, we must filter when to ENTER or HOLD the trigger. The Trend is represented by two lines: Trend UP and Trend DOWN. W e are in a Bullish trend when the Trend UP (Green line) is above. And in a Bearish trend when the Trend DOWN (Pink line) is above.
When the momentum is aligned with the Trend , this indicator generates: BUY signals (LIME line) SELL signals (RED line) The user is alerted of the scenario, at
我自动其商业策略的使用二进制 MT5 和我们 Mt5BridgeBinary 我发送的命令其二进制账户和我名单: 开始使用这种方式容易!
专家顾问也容易形成、优化和实现抗寒试验; 还在测试中我们可以预测其长期盈利能力,所以我们创造了 Mt5BridgeBinary 连接其最佳战略二进制文件。
特点: 它可以使用很多战略如我所愿。 (专家顾问)。 他不需要额外的程序。 随函附上我方- EA 没有导入的时限。 它可以想象所有的公开行动。 他只需要执行我们 EA 只在一个图形采取所有的订单。 -它不需要复杂的配置,以使我们的就业工作。
输入参数: 电子邮件: 有关其电子邮件帐户的二进制文件。 -标记: 代码访问它生成的二进制来操作。 -数量操作: 该合同价值。 位置警报: 会启用/禁用警报作业时开放。 -小组菲尔斯滕: 它显示所有打开的行动。
注: -期限的合同: 请参阅《资产指数来了解这笔总额中,最小和最大期限的合同。
- Volatile 性质指标不能在德国、法国、西班牙、新加坡、澳大利亚、意大利和卢森堡。

**Resistances and Support — 带强度评级与提醒的支撑阻力区**
支撑与阻力是入场时最重要的因素之一。本指标会自动为你找到它们,并显示每个区的强度。
它不画简单的线,而是把支撑与阻力画成「区域」,因为价格对区域而非精确价位作出反应。每个区域按价格尊重它的次数评级——区域越强,画得越醒目。你能立刻看出哪些位置最重要。
**如何使用:** - 在支撑区与阻力区之间交易 - 把止损放在区域之外(卖出放上方,买入放下方) - 把止盈设在下一个区域 - 当多个区域挤在一起、几乎没有间隔时,最好等待——该区域过于拥挤
**功能:** - 根据近期价格摆动自动检测多个支撑与阻力区 - 按强度(触及次数)为每个区评级——越强越醒目 - 阻力区画在价格上方、支撑区在下方,各有颜色 - 每个区上有小标签显示类型与强度(例如 R x4、S x5) - 当价格触及或突破某个区域时提醒你(弹窗及可选手机推送)
**输入参数:** - 回溯K线数、枢轴强度、区域宽度(ATR)、最大区域数、最少触及次数 - 阻力/支撑颜色、标签开关、标签字号、向右延伸 - 触及提醒、突破提醒、弹
Some candles have a strong tendency to continue the movement, or its turn. Using the Colored candles and patterns indicator, such candles are clearly visible. This indicator calculates the parameters of each candle, as well as its volume, and after that it colors the candles depending on its strength and direction. Bullish candles turn green and bearish candles turn red. The greater the strength of the bulls or bears, the brighter the color. If desired, the colors can be changed. In addition, t

Trend Factor is an indicator based on the calculation of price values to answer questions about what direction the trend is acting on the market at the moment and when this trend will end.
By launching the Trend Factor indicator, the user will see two lines and bars of different colors, which can change color to green during an uptrend, to red during a downtrend or to be yellow during an uncertainty.
The trader uses the Trend Factor indicator to determine the market situation. This is a tre
**Price Power — 用价格位置衡量买卖力量**
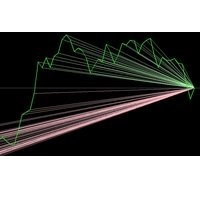
Price Power 让你一眼看出当前价格上方和下方还有多少空间。它统计最近的K线中有多少根在当前价格之上(买方力量),多少根在之下(卖方力量),并以数字和线条显示在图表上。
当价格上方的K线远多于下方时,向下的空间和压力更大;当下方远多于上方时,偏向上行。面板给出两个数值和清晰的 Buy / Sell / Wait 状态。
**显示内容:** - Buy = 当前价格之上的近期K线数量 - Sell = 当前价格之下的近期K线数量 - 向每根被统计的K线画一条线,可选两种样式之一 - 面板:名称、回溯数量、Buy、Sell 及信号状态
**两种画线样式(任选):** - 水平水平线 — 在每根K线价位上画一条线 - 射线 — 从每根K线汇聚到当前价格点
**信号与提醒:** - 当一方超过另一方两倍以上且高于阈值时给出信号 - 信号出现时在图表上画箭头 - 新信号时弹窗及可选手机推送提醒
**输入参数:** - LastXvalues — 测量多少根K线 - horizontal_lines — true 为

JUPITER it is a Secure Automated Software for trade Forex market and indices.
The architecture is a Fully Automatic Autonomous Robot Expert capable of
Independently analyzing the market and making trading decisions
JUPITER It is an advanced trading system. This is a fully automatic Expert Advisor.
JUPITER . It is a 100% automatic system, The system is self-sufficient, performing all the work. Is a revolution in the customization of the trading. You can download the dem
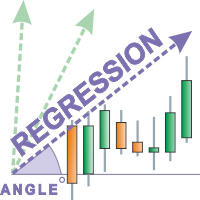
The Regression indicator shows the direction of the trend. The graph shows up to 3 regression lines with different time periods. The straight line is built as the average inside the wave channel of the price movement (shown on one ScreenShot).
In this case, you can disable any of the lines. Also, the indicator allows you to change the color for each line. It is interesting to calculate the relative angle in degrees. The angle display can also be turned off.
Thanks to this indicator, you can s

Blue Sky Plus是经过5年测试的产品,Metatrader也提供该产品。
它结合了指标和交易策略来获得恒定的利润。 该产品最好的是,它可以在正确的时间生成信号,并且发出的信号更少。 在一段时间内使用此EA交易将使您受益。 我们不建议随机交易,而是与专家顾问一起以系统的方式进行交易。
最有效的细分
最适合商品和股票。它不会在外汇,货币上工作。
如何使用
加载专家顾问 根据股票或货币,使用时间范围1小时15分钟或每天。时限推荐-第一推荐1小时(信号少的精确交易),第二推荐(信号多的精确交易)15分钟,第三推荐每日(长期投资者) 如果未在一年内未显示利润,请在使用任何时间框架之前进行回测。 一个月内完成所有交易,即可获利。不要跳过交易。 不要随意取舍交易 对库存量进行预算,以使您有足够的资金来维持至少3个月的时间。 不要增加数量 仅交易您在3个月内可以承受的损失 如果您受上述几点约束,则您的交易在一段时间内获利的可能性将大大增加。 我们的策略是其中一部分,但最重要的部分是您不进行随机交易的纪律。 就这样坐下来放松交易 谢谢您快乐的纪律交易
运作方式
该机器人可
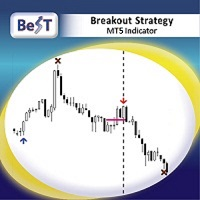
BeST_Breakout Strategy MT5 is an Metatrader Indicator based on a proprietary algorithm implementing a very powerful tool that can exploit every breakout leading to huge market movements.It timely locates the most likely points for Entering the Market as well as the most suitable Exit points and can be used successfully as a standalone Trading System which performance is often accompanied by very impressive statistics of % Success Ratio and Profit Factor . The BeST_Breakout Strategy is a non-rep
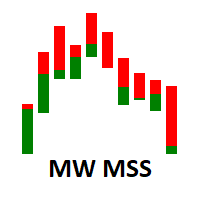
The Martinware Market Sides' Strength indicator shows the candlestick chart in a different manner allowing for a clearer view of which side, bullish or bearish is dominating the asset in the current period. As a bonus, it can also show an internal area that can be used to visualize two levels of Fibonacci retracements inside the bars.
The default configuration shows the MSS bars with 4 main colors, two representing the bullish force, and two representing the bearish one. The primary colors ar

Do you use volume in your reading of the market?
Certainly many traders use it, and do not imagine operating without it.
The Color Candle Volume Set indicator allows the user to choose the value that he considers interesting to monitor.
When you pass this you will have visual confirmation on the price chart and if you want you will also have the audible alert that is given by the indicator.
Of course, there are other ways to try to find a high volume, such as assessing whether the vol
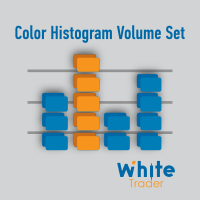
Do you use volume in your reading of the market?
Certainly many traders use it, and do not imagine operating without it.
The Color Histogram Volume Set indicator allows the user to choose the value that he considers interesting to monitor.
When you pass this you will have visual confirmation and if you want you will also have the audible alert that is given by the indicator.
Of course, there are other ways to try to find a high volume, such as assessing whether the volume is above av
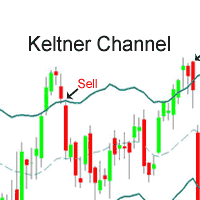
The EA strategy : it is provided wirh built-in Keltner Channel indicator and a Moving Average to ensure the signals. Short and Long positions are treated separetely with different stop levels, lots volume, quantity of simultaneous pending positions and trailing stop loss distances; You should purchase this EA because : it has been tested for a long time; its indicator was deeply improved and optimized; the program is bugs free; it is safe because its efficience is about 94% of assertiveness;
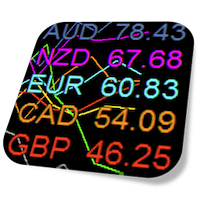
Currency Strength Meter is the easiest way to identify strong and weak currencies. This indicator shows the relative strength of 8 major currencies + Gold: AUD, CAD, CHF, EUR, GBP, JPY, NZD, USD, XAU. Gold symbol can be changed to other symbols like XAG, XAU etc.
By default the strength value is normalised to the range from 0 to 100 for RSI algorithm: The value above 60 means strong currency; The value below 40 means weak currency;
This indicator needs the history data of all 28 major currency
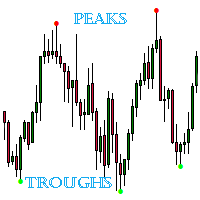
The indicator detects important peaks and troughs (extremes) on the chart. These points can be used to plot support/resistance levels and trend lines, as well as any other graphical analysis. These points can serve as reference points for setting trading orders. The indicator does not redraw .
Settings:
Size_History - the size of the calculated history. Num_Candles_Right - number of candles to the right of the peak or trough.
Num_Candles_Left - number of candles to the left of the peak or
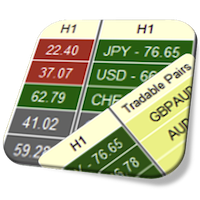
Currency Strength Meter is the easiest way to identify strong and weak currencies. This indicator shows the relative strength of 8 major currencies + Gold: AUD, CAD, CHF, EUR, GBP, JPY, NZD, USD, XAU. Gold symbol can be changed to other symbols like XAG, XAU etc.
By default the strength value is normalised to the range from 0 to 100 for RSI algorithm: The value above 60 means strong currency; The value below 40 means weak currency;
This indicator needs the history data of all 28 major currency
该多时间框架和多交易品种指标可识别随机指标信号线何时穿过随机指标主线。作为替代方案,它还可以在随机指标离开(没有信号线穿过主线)超买/超卖区域时发出警报。作为奖励,它还可以扫描布林带和 RSI 超买/超卖交叉。结合您自己的规则和技术,该指标将允许您创建(或增强)您自己的强大系统。 特征 可以同时监控市场报价窗口中可见的所有交易品种。仅将指标应用于一张图表即可立即监控整个市场。 可以监控从 M1 到 MN 的每个时间范围,并在识别出交叉时向您发送实时警报。支持所有 Metatrader 本机警报类型。 该指示器包括一个交互式面板。请参阅单独的屏幕截图以获取解释。 指标可以将信号写入文本文件 或全局变量 专家顾问 (EA) 可以使用它 进行自动交易。比如 这个产品 。 输入参数
输入参数的描述和解释可以 在这里 找到 。 重要的
请注意,由于多功能性,安装指标的图表上不会绘制买入和卖出建议,也不会绘制线条和箭头。相反,这些对象将绘制在单击图表面板中的信号时打开的图表上。 强烈建议将指标放在干净(空)的图表上,上面不要有任何其他可能干扰扫描仪的指标或 EA 交易。

MACD Master Our MACD Master is the Expert Advisor you were searching for. It is easy to set up and brings Money Management such as automated or fixed Stop loss, risk management with fixed amount or percentage on the Account Balance or Account Equity and the most important for a solid system, the definition of the risk ratio - CRV.
How does the system work? The system is based on the original idea of the MACD. Whenever the fast EMA and the slow EMA of the MACD are crossing a sell or buy signal i
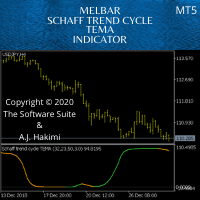
Schaff Trend: A Faster And More Accurate Indicator In Combination With The TEMA MACD - Scalping Systems Advantage
The Schaff Trend Cycle (STC) is a charting indicator that is commonly used to identify market trends and provide buy and sell signals to traders. Developed in 1999 by noted currency trader Doug Schaff, STC is a type of oscillator and is based on the assumption that, regardless of time frame, currency trends accelerate and decelerate in cyclical patterns. https://www.investopedia.c
Chart Slice is a very convenient multi-timeframe indicator, with which you can see market information at once on several time slices. This will allow the trader to learn quickly and most importantly understand the vibrant market . The author himself went this way and this indicator helped incredibly. You probably have often wanted to see in detail why at a given point in time the price was rapidly moving away from a certain level or, on the contrary, stopping there. And for this you had to chan
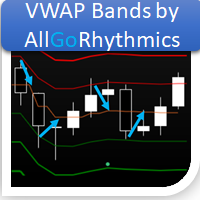
This indicator calculates the Daily VWAP and projects its Bands in 3 upper levels and 3 lower levels (Supports and Resistances), offset by the Standard Deviation selected by the user.
How to configure: Choose the symbol and the desired graphic time; Choose the type of price that is most suitable to calculate the Desired VWAP; Choose whether or not you want the Bands to be plotted; Choose the type of Volume you want to use (Ticks or Real); Choose the type of Calculation of the Bands (Deviation

This indicator allows you to monitor and correlate several assets simultaneously. Using an operational reading technique applied in Multimarkets, the user is able to observe the behavior of other assets visible to the current asset that is operating. With this, the user's ability to make decisions becomes more robust and grounded.
The indicator has the capacity to list up to 4 assets, with the possibility, also, to change the type of quote and be used both for the current price and the past pr

PROMOTIONAL PERIOD - ONLY 2 COPIES LEFT OF FIRST 10 BUYERS AT PRICE 300,00$!!!
CHECK SCREENSHOTS AND COMMENTS FOR OUR STRATEGY RULES AND LIVE TRADES SIGNALS PULL IT BACK is a revolutionary trading system and a complete strategy with advanced algorithm developed to detect the trend direction after a PULLBACK , a RETREACEMENT or a KEY LEVEL BOUNCE . The goal of this indicator is to get as many pips as possible from market trend. Following strictly the rules of the strategy, you can become a

Introduction to Fractal Pattern Scanner Fractal Indicator refers to the technical indicator that makes use of the fractal geometry found in the financial market. Fractal Pattern Scanner is the advanced Fractal Indicator that brings the latest trading technology after the extensive research and development work in the fractal geometry in the financial market. The most important feature in Fractal Pattern Scanner is the ability to measure the turning point probability as well as the trend probabil

Rebate System performs a large number of trades with the minimum profit, which gives the opportunity to earn from receiving rebates (returning part of a spread). It is based on two grids (buy and sell), when one of them is in a drawdown, the other one can enter with an increased lot size, keeping the account away from the drawdown. Differences from the usual EA Rebate System in the mode of closing long-term losing trades in one of the grids due to the previously received profit. Input parameters

The 9-5 Count is designed to track a very powerful cycle that runs through all freely traded markets. This is not a time cycle but a price cycle. The time spent between two points is not as important as the price traveled between them. The 9-5 Count is called that because one complete upward cycle consists of measurement of 9 units plus 5 units of cycle time. This tool takes into account price and pattern together, so it’s more than just a simple cycle. The 9-5 theory classifies market movemen

5 Advantages of Using a Forex Expert Advisor It can trade while you sleep! ... It is not vulnerable to emotions. ... You can run backtests quickly. ... It reacts to quick market movements instantly. ... It isn't prone to human error.
MelBar Take10P AJH Expert Advisor RoboTrade Software MT5 - TEST RESULTS by Independent 3rd. Party
Leverage : 1-500 Initial Deposit US$150-US$300
Timeframe : M30
Period : March 1, 2020 - April 29, 2020
Profit Returns Percentage in 59 DAYS : 50+%-100+% (E

The Larry Wiliams' indicator named WillSpread considers the influence of the secondary Asset (Symbol) on the current Asset (trading). Indicator essence is to transform the correlation between assets in accumulated history data, providing an opportunity to detect various peculiarities and patterns in price dynamics which are invisible to the naked eye. Based on this information, traders can assume further price movement and adjust their strategy accordingly. As exposed on his Book, Larry says: "a
through this indicator you can make analysis and also can to distinguish possible weakness or continuous strength on price, it is an indicator initially developed by David Weis. This version is for the meta trader 5 platform. The Weis Waves indicator is based on volume and is aligned with the price, being able to find not only possible strenght and weakness, but also possible divergences between price and volume, bringing an interesting analysis between both.
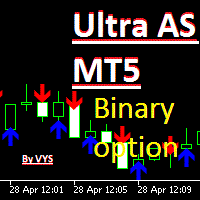
The indicator is designed for binary options trading. The "period" parameter can be adjusted to fit your trading strategy, allowing you to customize the number and quality of signals. A red arrow pointing down indicates a sell signal, while a blue arrow pointing up indicates a buy signal. Recommended expiration time is one candle. You can enter a trade either when the signal appears or on the next candle. Attention: the signal may sometimes disappear on the current candle, so it's important to

RSI Scalper Multi Profit Targets is a Fully automated EA. It uses the RSI indicator for the entries. You can do counter trend scalp (for example sell on 72, and buy on 25) - default (trend buy-sell - false) settings or it can do the same direction trade (trend buy-sell - true).
You can find the best profit targets on backtesting and optimization because it works almost on all pairs on some TF (Time Frame). I personally use it on 5 min, EURUSD, GBPUSD, NAS100, SP500. on 15 min I use on USDCAD.

The strategy which is applied in finance market all around the world is known as CTA strategy. A successful CTA always includes multi-strategies, multi-instruments and multi-timeframe. The series of Multi Instruments TrendSystem (MITS) provide a profitable strategy which can be used in different instruments with different timeframe. Multi Instruments TrendSystem 6 CP (Central Power ) MT5 is a fully automated multi-instrument Expert Advisor. This EA is one of our trend strategies EA, it can be

The strategy which is applied in finance market all around the world is known as CTA strategy. A successful CTA always includes multi-strategies, multi-instruments and multi-timeframe. The series of Multi Instruments TrendSystem (MITS) provide a profitable strategy which can be used in different instruments with different timeframe.
Multi Instruments TrendSystem 5 RA MT5 (Rapier) is a fully automated multi-instrument Expert Advisor. This EA is one of our trend strategies EA, it can be used
The strategy which is applied in finance market all around the world is known as CTA strategy. A successful CTA always includes multi-strategies, multi-instruments and multi-timeframe. The series of Multi Instruments TrendSystem (MITS) provide a profitable strategy which can be used in different instruments with different timeframe.
Multi Instruments TrendSystem 4 M4A1 MT5 is a fully automated multi-instrument Expert Advisor. This EA is one of our trend strategies EA, it can be used on lots of

Gossamer is a moving average ribbon indicator that uses a novel approach to identify breakout trades in trending markets. By applying a progressive period shift to each moving average, levels of consolidation become visible. Enter trades when price breaks out in the direction of the prevailing trend. Stoploss should be located on the other side of the consolidation from the breakout. Profits can be taken at the next consolidation or the stoploss trailed and the position built. Applicable to a

Полностью автоматический советник, на основе индикатора RSI с системой технического анализа на заданную глубину и с учетом текущей ситуации. Особенность данного эксперта в специальном фильтре ложных сигналов, без которого RSI практически бесполезен. Советник не использует методы работы с высоким риском (Мартингейл, сетки ордеров и т. д.). Размер лота автоматически рассчитывается в зависимости от текущего баланса и уставки на каждый минимальный размер лота. Рекомендуется запускать советник с раб

The underlying P.S.-Technical Trading bot is a computer program written in the MQL5 language. The P.S.-Technical Trading bot is a fully automated trading robot based on the two developed technical indicators, ADX and Parabolic SAR, developed by technical analyst Welles Wilder Jr.
If you want to learn more about this, I recommend the book "New Concepts in Technical Trading Systems" which was published in 1978.
In addition, the trading bot eliminates all too understandable emotions during trad
The strategy which is applied in finance market all around the world is known as CTA strategy. A successful CTA always includes multi-strategies, multi-instruments and multi-timeframe. The series of Multi Instruments TrendSystem (MITS) provide a profitable strategy which can be used in different instruments with different timeframe.
Multi Instruments TrendSystem 3 BS MT5 (Blood Sword) is a fully automated multi-instrument Expert Advisor. This EA is one of our trend strategies EA, it can be us
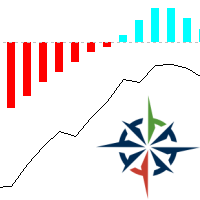
Designed by Fábio Trevisan, VolumeCapacitor is an indicator that, in addition to showing the volume quantity, shows its direction, having as main characteristic, the possible price tops and bottoms, or pullback areas. With its simple but not simplistic calculation method, it is able to determine areas where the defense of long and short positions can be assessed with a simple observation. VolumeCapacitor uses in its unique formula the OBV (Balance of Volume, or On-Balance Volume) idealized by J

The strategy which is applied in finance market all around the world is known as CTA strategy. A successful CTA always includes multi-strategies, multi-instruments and multi-timeframe. The series of Multi Instruments TrendSystem (MITS) provide a profitable strategy which can be used in different instruments with different timeframe. Multi Instruments TrendSystem 2 DM (Dual Moving) MT5 is a fully automated multi-instrument Expert Advisor. This EA is one of our trend strategies EA, it can be used
The strategy which is applied in finance market all around the world is known as CTA strategy. A successful CTA always includes multi-strategies, multi-instruments and multi-timeframe. The series of Multi Instruments TrendSystem (MITS) provide a profitable strategy which can be used in different instruments with different timeframe.
Multi Instruments TrendSystem 1 MT5 (Multi-Moving Strategy) is a fully automated multi-instrument Expert Advisor. This EA is one of our trend strategies EA, it can

Sun Storm MT5 - it is a Secure Automated Software for trade Forex market and indices.
ONLY RECO M ENDED FOR GBPUSD AND EURUSD Can used this EA whit 100$ in your account
The architecture is a Fully Automatic Autonomous Robot Expert capable of independently analyzing the market and making trading decisions
Sun Storm MT5 It is an advanced trading system. This is a fully automatic Expert Advisor. It is a 100% automatic system, the system controls both t
The EA strategy : it is provided wirh built-in indicator based on Japanese Candles arrangements in order to determine the signals and has different inputs for Short and Long positions in order to improve its precision; You should purchase this EA because : it has been tested for a long time; its indicator was deeply improved and optimized; the program is bugs free; it is safe because its efficience is about 70% of assertiveness; it is provided with Trailing Stop Loss technology; it has bad t
Chart Reverse Point is based on moving average, volumes, and a priceaction logic to find the points in which the currency will probably go in a defined direction. Inputs: Alarm ON/OFF: turn on or off alarm on screen. The indicator draws an arrow pointing the direction to follow based on when a specific pattern of bars is found near the moving average and the volumes are higher than a minumun defined by the indicator. Chart Reverse Point can help you to choose the moment to do your trades in a sp
MA Break Point is based on moving average and a priceaction logic to find the points in which the currency will probably go in a defined direction. Inputs: Alarm ON/OFF: turn on or off alarm on screen. The indicator draws an arrow pointing the direction to follow based on when the currency cross a moving average and verify the trend with another ma. MA Break Point can help you to choose the moment to do your trades in a specific direction, strengthening your trading strategy.

Retracement Trend is based on a priceaction logic and volume of the lasts bars. Inputs: Alarm ON/OFF: turn on or off alarm on screen. The indicator draws an arrow pointing the direction to follow based on when a specific pattern of bar's volume is found and the price has a specific direction. Retracement Trend can help you to choose the moment to do your trades in a specific direction, strengthening your trading strategy.

Support Resistance Inversion is based on supports and resistance to find the points in which the currency will probably go in a defined direction. Inputs: Alarm ON/OFF: turn on or off alarm on screen. The indicator draws an arrow pointing the direction to follow based on when the price cross or bounce on a support or a resistance. Support Resistance Inversion can help you to choose the moment to do your trades in a specific direction, strengthening your trading strategy.
Support Resistance Pattern is based on supports and resistance to find the points in which the currency will probably go in a defined direction. Inputs: Alarm ON/OFF: turn on or off alarm on screen. The indicator draws an arrow pointing the direction to follow based on when a specific pattern of bars is found near a support or a resistance. Support Resistance Pattern can help you to choose the moment to do your trades in a specific direction, strengthening your trading strategy.
Stochastic Break Point is based on the stochastic oscillator and moving average to find the points in which the currency will probably go in a defined direction. Inputs: Alarm ON/OFF: turn on or off alarm on screen. The indicator draws an arrow pointing the direction to follow based on when the stochastic line cross the signal line and in which direction it does it, filtered by the moving average direction. Stochastic Break Point can help you to choose the moment to do your trades in a specific

Support Resistance View draws horizontal lines in the current chart that define in real time the values of Supports/Resistances for the timeframe tha you choose. Inputs: Lines color: color of the lines. Timeframe: timeframe for calculations. Support and Resistance are values at which the currency usually inverts the trend or have a breakthrought, so you can use this values to define a strategy for trading.

The Price Channel pattern trading strategy is one of the smartest ways to make money trading. The Price Channel pattern represents two trend lines positioned above (channel resistance) and below (channel support) the price. The price action is contained between these two parallel trendlines. The separation between the two trendlines needs to be wide enough if you want to trade inside the Price Channel Pattern. If this is the case, you can buy at the channel support level and sell at the channel

The Lomb algorithm is designed to find the dominant cycle length in noisy data. It is used commonly in the field of astronomy and is very good at extracting cycle out of really noisy data sets. The Lomb phase plot is very similar to the Stochastics indicator. It has two threshold levels. When it crosses above the lower level it’s a buy signal. When it crosses the upper level it’s a sell signal. This is cycle-based indicator, the nicer waves look, the better the signal. Caution Also It’s really i
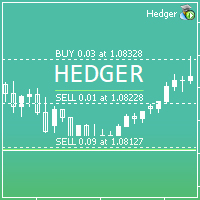
HEDGER MT5 is a Hedge Strategy Expert Advisor. Simply install and use. All other settings can be adjusted according to your wishes and experience.
Configurations: +---------------------------------- HEDGER Settings ----------------------------------+ Magic Number: ID that should be changed if you want to install Expert Advisor on different graphics, without interfering with each other and behaving like a single Expert Advisor. Max Spread By Tick Size: The Max Spread (measured by Tick Si

HCM MT5 the new generation EA. The basic concept is trend following. The EA will detect short-term trend following my research about Price Action signals, basing on the 1-hour bars. Base on my research on history data (big data), the EA operate really good on EUR/USD pair only . Please take it for your information.
BE SIMPLE - BE EFFECTIVE The EA is really easy to use with 2 parameters: Maximun Lot = 0.5 : This is the value of maximum lots that the EA can trade automatically.
% of SL -

Основная цель индикатора заключается в определении наиболее оптимальных точек входа в сделку и выхода из нее. Индикатор состоит из трех частей. Первая – это стрелки, показывающие оптимальные точки входа в сделку и выхода из нее. Стрелка вверх – сигнал на покупку, стрелка вниз – на продажу. В индикаторе заложен алгоритм аналитического анализа, который включает в себя множество показаний стандартных индикаторов, а также авторский алгоритм. Вторая часть – это информация в правом верхнем углу (работ

This tool draws candles at different TIMEFRAME from the 'pattern' displayed on the screen... ...In the 'Standard Chart' M1, he draws the Candles in M15. For example: The 'Standard Chart' in M1, the 'OHLC' in M15 are drawn the Candles (boxes) of M15 behind the candles of M1.
Download the demo version... ...see how it can help you notice Support/Resistance points as well as good moves with highs and lows in the 15M.

Probably the best implementation of “channel breakthrough” idea. Unlike many classic strategies in current Expert Advisor channel is adaptive: the channel with depends on market volatility. This strategy was tested for many years in different markets and systems. You can use the result of more than five years of work.
To start:
Just add Expert Advisor to EURUSD chart with M1 timeframe with default settings. Increase Lots parameter, if you need.
General information:
Expert Advisor paramete

NOTE: The EA open and close trades automatically. It only open one position at a time and close it at high profit or less loss. A next position will be opened whenever the EA Strategy requirements are met. Watch our video to see how it works.
DEFAULT INPUTS: ARE CHANGEABLE Variable Value Warning Use [PIPS] not [POINTS] Trade Size 0.05 Maximum Spread 3.0 Adjusted in OnInit 3 Maximum Stop Loss 20 Maximum Take Profit 0 Audible alerts True Maximum Open Trades 1 Hedging True
B

Major economic news have definite impact on Market Movement and Volatility. These impacts require instant and quick action to be able to cash – in on this volatility. That is why we developed the News Sandwich Expert Adviser to take the pain off you and automatically profit from the Market movement. It is a Set and Leave EA that daily monitors News releases and trade accordingly. There are many News EA out there, but one of the unique feature of this EA is that you can backtest historical Ne


This Expert Advisor is based on ForexMiracle System (MA,BB,MACD,ADX,STO). Follow the trend...no Martingale.. . need technical analysis skill Input Parameters : - Magics = 1234; - Lots = 0.01; - maxStopLevel = 700; - autoTPbyATR = true; - TP = 100; - autoSLbyBollinger = true; - SL = 50; - trailingStop = 0; - CutByEngulf = true; - Friday_Rest = true; - Indicator_Setting = "| ^_^ | ^3^ | ^v^ |"; - MAmega_Setting = "----------------------------"; - MA_Setting = "----------------------------"; - B

This indicator signals significant price movements compared to the average over a defined period, making it easy to spot potential trading opportunities. It takes into account not only price movements but also the spread value of each symbol, providing a more accurate picture. You can use this indicator for multiple symbols, up to 8 pairs, as specified in the input parameters. With its flexible settings, traders can easily customize it to suit their individual preferences and trading styles. It'
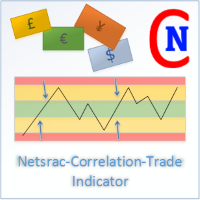
The Netsrac Correlation Trade Indicator (NCTI) was created to trade correlations between different assets. NCTI offers five different strategies to do this. Five different correlation trading strategies with two or three assets Fast access your assets with one click via asset buttons Your profit/loss at a glance Configurable alerts via screen or mobile You can use the indicator with every timeframe. Higher timeframes give fewer but better signals. If you have some questions or suggestions - ple
MetaTrader市场是 出售自动交易和技术指标的最好地方。
您只需要以一个有吸引力的设计和良好的描述为MetaTrader平台开发应用程序。我们将为您解释如何在市场发布您的产品将它提供给数以百万计的MetaTrader用户。
