 MetaTrader 5
 专家
 指标
 程序库
 实用工具
 窗口小部件
 规则
适用于MetaTrader 5的EA交易和指标 - 551
 使用EA交易和指标,使外汇交易获得更多盈利。EA交易可使您自动开启和关闭交易,而指标将帮助您更准确地预测市场行为。
该页面提供MetaTrader 5应用程序的目录。

1. Why did I develop this series of indicators
I found that most traders need to use multiple time frame indicators. They usually switch time frame to see indicators. However, once the timeframe is switched, you cannot see the corresponding relationship between the price in the smaller timeframe and the indicator in the larger timeframe . For example: if your price chart is in H1 timeframe, you can see H4, D1 and W1 indicators in H1 timeframe Chart. This is more helpful for you to find th

1. Why did I develop this series of indicators
I found that most traders need to use multiple time frame indicators. They usually switch time frame to see indicators. However, once the timeframe is switched, you cannot see the corresponding relationship between the price in the smaller timeframe and the indicator in the larger timeframe . For example: if your price chart is in H1 timeframe, you can see H4, D1 and W1 indicators in H1 timeframe Chart. This is more helpful for you to find th
1. Why did I develop this series of indicators
I found that most traders need to use multiple time frame indicators. They usually switch time frame to see indicators. However, once the timeframe is switched, you cannot see the corresponding relationship between the price in the smaller timeframe and the indicator in the larger timeframe . For example: if your price chart is in H1 timeframe, you can see H4, D1 and W1 indicators in H1 timeframe Chart. This is more helpful for you to find th

1. Why did I develop this series of indicators
I found that most traders need to use multiple time frame indicators. They usually switch time frame to see indicators. However, once the timeframe is switched, you cannot see the corresponding relationship between the price in the smaller timeframe and the indicator in the larger timeframe . For example: if your price chart is in H1 timeframe, you can see H4, D1 and W1 indicators in H1 timeframe Chart. This is more helpful for you to find th

1. Why did I develop this series of indicators
I found that most traders need to use multiple time frame indicators. They usually switch time frame to see indicators. However, once the timeframe is switched, you cannot see the corresponding relationship between the price in the smaller timeframe and the indicator in the larger timeframe . For example: if your price chart is in H1 timeframe, you can see H4, D1 and W1 indicators in H1 timeframe Chart. This is more helpful for you to find th

1. Why did I develop this series of indicators
I found that most traders need to use multiple time frame indicators. They usually switch time frame to see indicators. However, once the timeframe is switched, you cannot see the corresponding relationship between the price in the smaller timeframe and the indicator in the larger timeframe . For example: if your price chart is in H1 timeframe, you can see H4, D1 and W1 indicators in H1 timeframe Chart. This is more helpful for you to find th

1. Why did I develop this series of indicators
I found that most traders need to use multiple time frame indicators. They usually switch time frame to see indicators. However, once the timeframe is switched, you cannot see the corresponding relationship between the price in the smaller timeframe and the indicator in the larger timeframe . For example: if your price chart is in H1 timeframe, you can see H4, D1 and W1 indicators in H1 timeframe Chart. This is more helpful for you to find th

1. Why did I develop this series of indicators
I found that most traders need to use multiple time frame indicators. They usually switch time frame to see indicators. However, once the timeframe is switched, you cannot see the corresponding relationship between the price in the smaller timeframe and the indicator in the larger timeframe . For example: if your price chart is in H1 timeframe, you can see H4, D1 and W1 indicators in H1 timeframe Chart. This is more helpful for you to find th

1. Why did I develop this series of indicators
I found that most traders need to use multiple time frame indicators. They usually switch time frame to see indicators. However, once the timeframe is switched, you cannot see the corresponding relationship between the price in the smaller timeframe and the indicator in the larger timeframe . For example: if your price chart is in H1 timeframe, you can see H4, D1 and W1 indicators in H1 timeframe Chart. This is more helpful for you to find th
1. Why did I develop this series of indicators
I found that most traders need to use multiple time frame indicators. They usually switch time frame to see indicators. However, once the timeframe is switched, you cannot see the corresponding relationship between the price in the smaller timeframe and the indicator in the larger timeframe . For example: if your price chart is in H1 timeframe, you can see H4, D1 and W1 indicators in H1 timeframe Chart. This is more helpful for you to find th

1. Why did I develop this series of indicators
I found that most traders need to use multiple time frame indicators. They usually switch time frame to see indicators. However, once the timeframe is switched, you cannot see the corresponding relationship between the price in the smaller timeframe and the indicator in the larger timeframe . For example: if your price chart is in H1 timeframe, you can see H4, D1 and W1 indicators in H1 timeframe Chart. This is more helpful for you to find th

1. Why did I develop this series of indicators
I found that most traders need to use multiple time frame indicators. They usually switch time frame to see indicators. However, once the timeframe is switched, you cannot see the corresponding relationship between the price in the smaller timeframe and the indicator in the larger timeframe . For example: if your price chart is in H1 timeframe, you can see H4, D1 and W1 indicators in H1 timeframe Chart. This is more helpful for you to find th

1. Why did I develop this series of indicators
I found that most traders need to use multiple time frame indicators. They usually switch time frame to see indicators. However, once the timeframe is switched, you cannot see the corresponding relationship between the price in the smaller timeframe and the indicator in the larger timeframe . For example: if your price chart is in H1 timeframe, you can see H4, D1 and W1 indicators in H1 timeframe Chart. This is more helpful for you to find th

Just $10 for six months!!!. This will draw Supply & Demand zones just by clicking on a candle. It can also draw a 50% line on the zone. https://youtu.be/XeO_x7cpx8g As a drawing tool, it is not active all the time after adding it to the chart.
Activate by pressing 's' twice on the keyboard within a second. If activated but then decided not to draw, deactivate by pressing 's' once. Box color depends if candle is above or below current price.
Features: Draw the box up to the last current candl

运行于AUDUSD,自动交易 USDCAD 和 UCDNOK ,EA为趋势对冲策略,不加倍,不网格,没有太多的参数需要调整简单实用。 参数设置: Transaction : 当Transaction=true时,EA才会工作。 Lots :下单量。 SL_money :亏损多少金额统一平仓所有货币的单子。 less_stop : 净值小于多少不在开仓。 推荐的平台: ECN,交易成本合理的其他平台(如:icmarkets),注意平台USDNOK 每波动一个点价值约是0.1... 即五位小数的报价平台。 策略使用开盘价开仓,持仓时间偏长,回测用1分钟数据和每个tick差别不大,在过去十年时间的回测表现比较平和, 当然过去的回测不代表未来,一段时间的亏损周期对于趋势型的交易来说是很正常的,不要随意加大仓位。

Panthers Traders presents the new Expert Advisor "MRK TRADER", a robot for Forex, Indices, Commodities and Cryptocurrencies. This expert advisor works hedge strategies, has different variables to configure each other, works as a work tool or as a 100% automatic expert advisor, if you do not have experience, for your greater profitability, get in touch by private and I will explain your different variables and how to apply them in different assets, I recommend watching the videos of the YouTube

Backtest from 2003-2019 MetaQuotes Data Every Tick Mode
EA created for EURUSD H1
Open transaction based on MA and Volume
Close transaction based on RSI or take profit
One transaction at the time.
No adding position, no martingale, no grid.
My recommendations: For "safe mode" i recommend 0.1 lot per 10000USD
For "risky mode" i recommend 0.5 lot per 10000USD
Personally i use 0.3 lot per 10000 USD
Fell free to increase lot size while you earn.
This EA does not open transaction everyday, b

The Rise of Skywalker: It is an advanced trading system. This is a fully automatic Expert Advisor, which allows you to presize the trade according to the preferences of the trader. Is a revolution in the customization of the trading. The Rise of Skywalker is a expert advisor based in the indicator The Rise of Sky walker: ( https://www.mql5.com/es/market/product/44534 ) This system uses only one trade in each operation. Do not use Grip or martingale Low risk system since it h
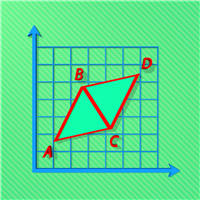
The indicator for trading on the signals of the harmonic pattern AB=CD. It gives signals and shows the levels of entry into the market, as well as levels for placing stop orders, which allows the trader to make timely decisions on entering the market, as well as effectively manage positions and orders. It supports sending push notifications to a mobile device, e-mail, as well as alerts. This indicator has been ported from the version for MetaTrader 4. For more information, as well as a detailed

This EA works with one of the best exit strategies, the grid. But it's not an ordinary grid. In this EA, this strategy is optimized to the extreme to give you the best performance with multiple configuration options to work more safely and profitably. In addition, it manages multiple pairs on a single chart at a time, making them complement each other to make a single management.
Parameters: Initial lot: is the lot of the first position of the cycle Allow dynamic initial lot (true/false) : cal
Rectangle Detector Alert
About Rectangle Detector Alert Indicator
Rectangle detector alert detects manually drawn rectangle shapes on charts and sends out push notifications
also auto extending the rectangles at the same time as new candles form.
The concept behind this indicator is based on the manual trading of supply and demand zones. Most traders prefer
to draw their supply (resistance) and demand (support) zones manually instead of depending on indicators to auto draw
the zones.

Panthers Traders presents the new Expert Advisor "MRK TRADER", a robot for Forex, Indices, Commodities and Cryptocurrencies. This expert advisor works hedge strategies, has different variables to configure each other, works as a work tool or as a 100% automatic expert advisor, if you do not have experience, for your greater profitability, get in touch by private and I will explain your different variables and how to apply them in different assets, I recommend watching the videos of the YouTube
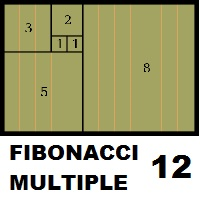
Fibonacci Múltiple 12, utiliza la serie fibonacci plasmado en el indicador fibonacci, aumentadolo 12 veces según su secuencia. El indicador fibonacci normalmente muestra una vez, el presente indicador se mostrara 12 veces empezando el numero que le indique siguiendo la secuencia. Se puede utilizar para ver la tendencia en periodos cortos y largos, de minutos a meses, solo aumentado el numero MULTIPLICA.

This robot only operates 20 minutes a day during market opening! Recommended for mini Index and mini dollar!
Parameters:
Initial Volume (recommended: 1 to $ 300) Enable auto volume Ratio x volume balance Subsequent volumes (separate by,) TakeProfit (gain, 0 ñ use) MaxOrders Enable trailing stop function Profit points for triggering trailing Trailing stoploss distance
DistChannel
Maximum skidding CreateRowsBreakup = false; ColorRowsRup = clrGold; MagicNumber (ID #)

This product is a set of tools that help the trader to make decisions, bringing information from different categories that complement each other: trend, support / resistance and candle patterns. It also has a panel with information about the balance. The trend has two different calculations and is shown as colored candles. Strategy 1 is longer, having 3 different states: up, down and neutral trend. Strategy 2 has a faster response and has only 2 states: up and down trend. Support and resistance

The main idea of this product is to generate statistics based on signals from 5 different strategies for the Binary Options traders, showing how the results would be and the final balance based on broker's payout.
Strategy 1: The calculation is secret. Strategy 2: The signal is based on a sequence of same side candles (same color). Strategy 3: The signal is based on a sequence of interspersed candles (opposite colors). Strategy 4: The signal consists of the indicators bollinger (we have 3 type

Go Depth of Market This product helps to watch the order book in a easily and friendly way, helping traders to take decisions that are more consistent with the timing of the market.
Parameters: Activating EA (robot) mode if you leave true it will become a robot, if you leave false it will become an indicator. Initial volume VolumeDynamic if you leave it enabled will be automatic batch Proportion: Example: If you put 500 every 500 $ it will open a lot of 1.0 Takeprofit Stoploss Daily pr

Indicador Taurus All4 Taurus All4
O Taurus All4 é um indicador de alto desempenho, que indica a força da tendência e você pode observar a força da vela. Nosso indicador tem mais de 4 confirmações de tendência.
É muito simples e fácil de usar.
Modos de confirmação Confirmações de tendências de velas: Quando a vela muda para verde claro, a tendência é alta. Quando a vela muda para vermelho, a tendência está voltando para baixo. Quando a vela muda para vermelho escuro, a tendência é baixa. Co

Versão Darkray para Bolsa de Valores (Ações, Fundos Imobilirários, contratos futuros, etc.) O Robô DarkrayB3EA usa uma estratégia baseada no retorno a média, conjugada a detecção de zonas de exaustão de compra e de venda. Indicadores disponíveis para configurações de setups: EMA200 à Média móvel de 200 períodos (podem ser usados outros períodos com ótimos resultados também); RSI à Verifica os níveis de sobre venda para abertura das vendas e sobre compra para abertura das compras; ADX à Veri
This indicator measures the largest distance between a price (high or low) and a moving average. It also shows the average distance above and below the moving average. It may come in handy for strategies that open reverse positions as price moves away from a moving average within a certain range, awaiting it to return so the position can be closed. It just works on any symbol and timeframe. Parameters: Moving average period : Period for moving average calculation. Moving average method : You can
FuturesBot NQ100 Advisor works only on NETTING accoun ts!
Trading Advisor " FuturesBot NQ100 "is intended solely and exclusively for trading futures on the CME Group exchange
Advisor is adapted for trading futures contracts: - E-mini Nasdaq-100 Futures
- micro E-mini Nasdaq-100 Future
The specification of the E-mini Nasdaq-100 Future contract is available at the following link on the exchange website:
https://www.cmegroup.com/trading/equity-index/us-index/e-mini-nasdaq-100_contract_specifi
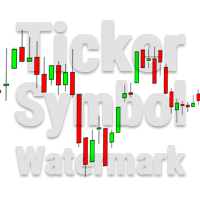
This utility tool draws the ticker symbol and timeframe information as a watermark in the background of the chart. It may come in handy if you have multiple charts on the screen at the same time. Inputs: Font Name: You can change text font by typing in the name of your favorite font installed on your operating system. (e.g.: Verdana, Palatino Linotype, Roboto, etc...) Font Color: You can choose your favorite from the available colors or type in a custom RGB color (values from 0 to 255, e.g.:
mql4 version: https://www.mql5.com/en/market/product/44606 Simple indicator to calculate profit on fibonacci retracement levels with fixed lot size, or calculate lot size on fibonacci levels with fixed profit. Add to chart and move trend line to set the fibonacci retracement levels. Works similar as default fibonacci retracement line study in Metatrader. Inputs Fixed - select what value will be fix, lot or profit Fixed value - value that will be fix on all levels Levels - levels for which

Horizontal Volumes Indicator - using a histogram, displays the volume of transactions at a certain price without reference to time. At the same time, the histogram appears directly in the terminal window, and each column of the volume is easily correlated with the quote value of the currency pair. The indicator practically does not require changing the settings, and if desired, any trader can figure them out.
The volume of transactions is of great importance in exchange trading, usually an inc

Trend indicator Carina . The implementation of the trend indicator is simple - in the form of lines of two colors. The indicator algorithm is based on standard indicators as well as our own mathematical calculations. The indicator will help users determine the direction of the trend. It will also become an indispensable adviser for entering the market or for closing a position. This indicator is recommended for everyone, both for beginners and for professionals.
How to interpret information fr
This app supports customer investments with equipment financing and leasing solutions as well with structured chat Our success is built on a unique combination of risk competence, technological expertise and reliable financial resources.
Following topics are covered in the Trading Support Chat -CUSTOMISATION -WORKFLOW -CHARTING TIPS -TRADE ANALYSIS
PLEASE NOTE That when the market is closed, several Brokers/Metatrader servers do not update ticks from other timeframes apart from the current on

KT Power Pennant 会在图表上自动识别并标记著名的旗形形态。旗形是一种趋势延续形态,通常由单边的大幅价格波动开始,随后进入由收敛趋势线构成的盘整阶段。
当旗形形态完成后,系统会在突破发生时提供买入或卖出信号,具体取决于是向上突破还是向下突破。
功能特点
旗形形态在盘整期后出现突破时,提供低风险的入场机会。 结合其他技术分析工具使用时,KT Power Pennant 提供的信号具有更强的实用价值。 低成交量的盘整期后,伴随成交量放大的突破,常预示价格将延续原有趋势方向。 已集成所有 Metatrader 报警提醒功能。
输入参数
历史K线数量: 用于识别历史旗形形态的K线数量。 形态幅度: 用于设置旗形形态大小的整数值。 形态线颜色: 用于绘制形态趋势线的颜色。 形态线宽度: 用于设置趋势线的粗细。 其余参数为直观设定项,无需额外说明。

The Rise of Sky walker is a trend indicator is a powerful indicator for any par and any timeframe. It doesn't requires any additional indicators for the trading setup.The indicator gives clear signals about opening and closing trades.This Indicator is a unique, high quality and affordable trading tool. Can be used in combination with other indicators Perfect For New Traders And Expert Traders Low risk entries. Never repaints signal. Never backpaints signal. Never recalculates signal. Great Fo

RageX EA is an unique fully automated EA which analyses current market trend on time-frame basis. Thanks to that it makes performance of this EA stable regardless the current market condition like slippage, execution speed, etc. Every order is protected by automatically calculated stop-loss. RageX EA successfully passed 100% quality data back-tests in Metatrader 5 with different execution speed as well as back-tests with 99.90% quality historical data and variable spread in Metatrader 4. Link

Trend Catchers the expert system works on all types of accounts, both netting and hedging. The basic unit of analysis is a tick, not a bar. It works with 5-digit quotes. Requotes are critical, a broker is required with minimal delays in execution.
The expert system uploads historical data online, creating its own database stored in RAM. On reboot, it is lost and on a new boot, it must be downloaded again. To achieve good results in real tick mode on the tester, it is necessary to carry out opt

KT Stochastic Divergence robot is a 100% automated expert advisor that trades regular and hidden divergence built between the price and Stochastic oscillator. The divergence signals are fetched from our freely available Stochastic Divergence indicator.
Not every divergence ends up in a successful price reversal, that's why this ea combines the raw divergences signals with its inbuilt technical analysis module to exploit the price inefficiency that occurs after some selected divergence signals.

KT CCI Divergence robot is a 100% automated expert advisor that trades regular and hidden divergence built between the price and Commodity Channel Index (CCI) oscillator. The divergence signals are fetched from our freely available CCI divergence indicator.
Not every divergence ends up in a successful price reversal, that is why this ea combines the raw divergences signals with its inbuilt technical analysis module to exploit the price inefficiency that occurs after some selected divergence si

交易已确认的 RSI 背离 KT RSI Divergence Robot 监控当前图表品种和周期中价格与相对强弱指数之间的常规背离和隐藏背离。程序在一根 K 线完成后评估新信号。看涨背离可以触发买入持仓,看跌背离可以触发卖出持仓。出现反向信号时,EA 可以先关闭相反方向的持仓,再评估新的入场机会。 选择入场条件 您可以在不改变核心背离逻辑的情况下调整策略: Regular Divergence 和 Hidden Divergence: 启用一种信号,或同时使用两种信号。 Overbought 和 Oversold 限制: 要求背离在您设定的 RSI 水平之外形成。 Trading Session 和 Day Filter: 只允许在选定的 GMT 交易时段和工作日建立新仓位。 Trend、Volatility、Vortex 和 MMI 过滤器: 在信号开仓前加入可选确认条件。 控制仓位大小和出场 Max Active Positions 限制 EA 在同一方向可持有的仓位数量。仓位大小可使用固定手数,或根据 Risk Per Trade 自动计算。Stop Loss、Take Pro

Powerful trend indicator provided with all necessary for trade and it is very easy to use. Everyone has probably come across indicators or Expert Advisors that contain numerous input parameters that are difficult to understand. But here, input parameters are simple and it is no need to configure anything — neural network will do all for you.
Difference from a classic version
The real-time multi time frame panel is added, so you can check a trend for other timeframes without switching the schedu
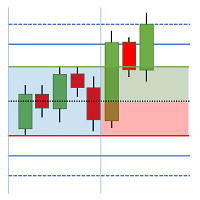
The Breakout Box for MT5 is a (opening) range breakout Indicator with freely adjustable: - time ranges - end of drawing time - take profit levels by percent of the range size - colors - font sizes It can not only display the range of the current day, but also for any number of days past. It can be used for any instrument. It displays the range size and by request the range levels and the levels of the take profit niveaus too. By request it shows a countdown with time to finish range. The indic
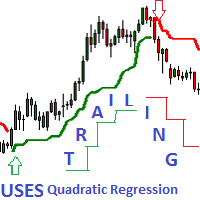
- This is an indicator of directional movement that allows you to determine the trend at the time of its inception and set the levels of a protective stop.
Trailing can be carried out both from below, when the stop level is below the current price and is pulled up behind the price if it increases, and above, when stop levels are above the current price.
Unlike trailing with a constant distance, the stop level is set at the lower boundary of the quadratic regression channel (in the case of tra

The adviser uses a strategy based on the use of custom indicators; trading is carried out on 4 time frames. The expert uses the adaptive system for determining market entries for trading, which determines the most appropriate moment for opening an order. The adviser trades according to numerous patterns on currency pairs. The adviser uses economic news to achieve more accurate signals. Hidden Stop loss, Take Profit, Break Even and Trailing Stop are used. Use multicurrency testing for 11 currency
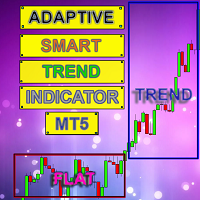
Smart indicator Adaptive Smart Trend Indicator determines the sectors of the Trend and the Flat and also in the form of a histogram shows the breakdown points of the levels (1 - 5).
The indicator performs many mathematical calculations to display more optimal Trend movements on the chart.
The program contains two indicators in one: 1 - draws the Trend and Flat sectors, 2 - the histogram indicator shows the best signals for opening an order. The indicator autonomously calculates the most o

Goliath MT5 - scalper fully automated Expert Advisor for medium-volatile forex markets
P roperties: The Library trades 10 currency pairs (USDCHF, EURCHF, EURGBP, AUDUSD, USDCAD, GBPUSD, EURUSD, NZDUSD, CADCHF, EURAUD, EURCAD, AUDJPY) The Library does not use martingale The Library sets a fixed stop loss and take profit for all orders The Library only trades a user input volume The Library can be installed on any currency pair and any timeframe Recommendations: Before using on a real account, t
This indicator is fully user-adjustable, calculates corellation between all symbols, which you want. Indicator is real-time updated and fully automated. You can adjust a lot of parameters.
Calculation Parameters List of symbols: write all symbol, which you want to calculate, just separate them by comma Calculated bars: amount of bars from which will be calculated Time frame: time period of calculation Used price: used price - 0 (CLOSE), 1 (OPEN), 2 (HIGH), 3 (LOW), 4 (MEDIAN), 5 (TYPICAL), 6 (

Crossing of market price and moving average with all kinds of alerts and features to improve visualization on the chart.
Features Crossing of market price and Moving Average (MA) at current bar or at closing of last bar; It can avoid same signals in a row, so it can allow only a buy signal followed by a sell signal and vice versa; MA can be set for any of the following averaging methods: Simple Moving Average (SMA), Exponential Moving Average (EMA), Smoothed Moving Average (SMMA), Linear-we
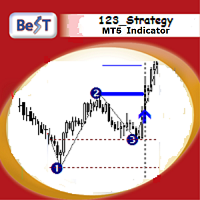
BeST_123 Strategy is clearly based on the 123 Pattern which is a frequent Reversal Chart Pattern of a very high Success Ratio .It occurs at the end of trends and swings and it’s a serious indication of high probability for a change in trend.Theoretically an 123_pattern is valid when the price closes beyond the level of #2 local top/bottom, a moment when the indicator draws an Entry Arrow, raises an Alert, and a corresponding Position can be opened.
The BeST 123_Strategy Indicator is non-repain
Dragnet mt5 全自动交易机器人。不使用指标,不断行情。分析当前未平仓头寸以做出交易决策。没有鞅,交易手数没有增加。 设置说明 Count_All - 总利润的头寸数量. Lot - 持仓量,如果 = 0,则风险参数有效. 风险 - 从交易账户余额自动计算手数. TakeProfit - 单一仓位的盈利水平. 步骤 - 位置之间的步骤. ProfitTarget - 设置 Count_All 的总利润. DrawdownLoss - 回撤限制,用减号“-”设置. MagicNumber - 顾问职位标识符. CommentsCount - 限制评论数量. Slipage - 最大允许的价格滑点。 為了讓顧問與您的經紀人良好合作,需要在策略測試器中根據經紀人的報價優化顧問設置。
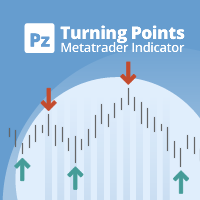
Identify key turning points with reliable fractal analysis
This indicator examines the price structure of fractals of different periods to determine possible reversal points in the market, providing timing to positional traders that already have a fundamental or technical valuation model. Unlike its younger brother, Reversal Fractals , this indicator won't miss reversals because of the period selected, and will find reversal fractals on a zig-zag fashion, ignoring those reversals which do not

An EA created to overclock a deposit within the short period of time. The EA uses accurate signals towards the trend to be able to enter the market. Together with the author’s optimization criterion, the EA allows you to choose appropriate settings to overclock your deposit. The EA works on 4 timeframes, which increases the accuracy of signals. Sometimes it can involve 3 timeframes. Attention! As you know, a trader's deposit is exposed to a risk in the Forex market. Especially, this should be ta
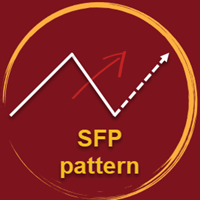
A Swing Failure Pattern ( SFP ) is a trade setup in which big traders hunt stop-losses above a key swing high or below a key swing low for the purpose of generating the liquidity needed to push price in the opposite direction. When price 1) pierces above a key swing high but then 2) closes back below that swing high, we have a potential bearish SFP . Bearish SFPs offer opportunities for short trades. When price 1) dumps below a key swing low but then 2) closes back above that swing low, we have

Every trader knows that he or she should never Risk more than 2% (or 5%) per trade. This is a Money Management law and an usable LotSize should be calculated each time because a trader must use a different StopLoss value for different Support and Resistant level. This indicator will calculate an appropriate LotSize for the moment when you will put it on the chart and each time you will drag the "Stop Loss Line" in any direction.
Inputs: Order_Type - Buy or Sell TakeProfitPoints - how many po

The basis of the strategy is the identification of quick corrective movements between the crosses of a working currency pair or metal. At the moment of differences in prices of trading instruments, the adviser analyzes the possible direction of price movement on a working instrument and starts work.
Each position has a stop loss and take profit.
A unique position tracking algorithm allows you to control the superiority of profit over loss.
The adviser does not use dangerous trading methods.

The VMA is an exponential moving average that adjusts its smoothing constant on the basis of market volatility. Its sensitivity grows as long as the volatility of the data increases. Based on the Chande's Momentum Oscillator, the VMA can automatically adjust its smoothing period as market conditions change, helping you to detect trend reversals and retracements much quicker and more reliable when compared to traditional moving averages.

This EA filters transactions based on daily and monthly chart analysis over the past multiple periods This EA will detect the level and the movement of the BARS that is high possibility trend will continue. The Expert Advisor also features money management, traditional SL, TP and trailing stop. EA uses the reduced investment scheme. The fixed stop loss and take profit are always set for each trade. Only one order is used for trading each instrument, which ensures maximum safety of trading. Param
RSI Swinger
Do you want to maximize your trading profits while minimizing your risk exposure and time spent analyzing technical indicators? The RSI Swinger Expert Advisor is the perfect solution for you. By relying on the powerful RSI indicator to identify price swings, this fully customizable EA can help you achieve your trading goals in a risk-averse manner, even if you're not a technical analysis expert. With the RSI Swinger, you can easily configure the RSI ceiling and floor values to suit

The utility places virtual (hidden from your broker) trailing stop, breakeven, stop loss and take profit. It is necessary to allow automated trading in the terminal settings. In testing mode, the utility opens Buy or Sell positions on the first ticks, which allows you to visually observe the given logic, changing the utility parameters. In real mode, the utility does not open positions. Discuss the complexities of Forex trading here: chat "Age of Expert Advisors" . Parameters magic - magic n

The utility places trailing stop, breakeven, stop loss and take profit. It is necessary to allow automated trading in the terminal settings. In testing mode, the utility opens Buy or Sell positions on the first ticks, which allows you to visually observe the given logic, changing the utility parameters. In real mode, the utility does not open positions. Discuss the complexities of Forex trading here: chat "Age of Expert Advisors" . Parameters magic - magic number. If less than 0, positions w
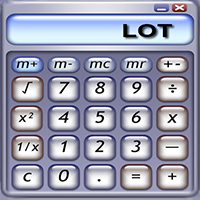
(与谷歌翻译)
不再需要计算您的头寸规模。
以%(基于您的余额)设置风险大小,然后找到您想要的头寸的止损位,您的交易将以适当的头寸大小执行。
您可以通过单击“关闭”按钮来关闭当前使用的工具上的所有浮动头寸。
如何使用?
将专家附加到图表上并设置其参数。 单击“停止”按钮,然后将水平线定位到可能的“止损”水平。 仔细检查您之前设定的风险。如果您想增加/减少,请按加号(+)/减号(-)按钮。 最后,点击买/卖按钮。 请享用 :)
输入参数:
“正确意味着您无需确认即可执行交易!” -如果您设置为False,这意味着如果您执行了一项交易(买入或卖出),则会出现一个消息框,您必须确认执行交易。 “基于余额的风险百分比(可以稍后修改)”-例如1表示,如果您当前的余额为$ 10.000,则每笔交易的风险为$ 100。通过单击减号(-)和加号(+)按钮,可以随时轻松地在图表上修改此百分比。 其他输入仅用于设计(颜色,文本等)
如果您需要任何其他帮助,请随时与我联系。
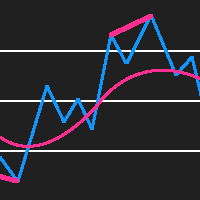
RSI Divergence Detector is an RSI indicator which also detects divergences and plots arrows and trend lines on the chart where you should buy and sell. Please note that this indicator provides 5 buffers and doesn't repaint making it an exceptional indicator for Expert Advisors. The indicator also provides alerts. Buffer 0 = RSI Buffer 1 = Buy Buffer 2 = Sell Buffer 3 = RSIGradient Buffer 4 = PriceGradient
NON REPAINTING
DIVERGENCE DETECTION

Smart YTG mt5 MT4 终端智能交易系统 Smart YTG 被 编写用于 GBPUSD 和 EURUSD 货币对,图表周期 H1。从本质上讲,该系统具有趋势并且在带有 STOP 订单的价格变动趋势部分完美运行,趋势是通过分析内置于 EA 内部的价格通道指标来确定的;无需额外安装该指标。在平盘区,当行情优柔寡断且行情进一步走势确定时,提现系统开始运行而不会亏损,如果市场上有与价格走势方向相反的头寸,则为价格变动方向与订单重叠,当达到总利润时平仓整个系列仓位,而Equity不下跌,保持平衡线,从测试结果可以看出。 代码中的大量计算,以及其中最大的一部分,恰好属于市场形成平台的时刻,您需要在没有回撤和亏损的情况下摆脱它进入趋势。为此,有一个用于动态平仓的块。 动态平仓 - 当强制平仓订单达到设定的总利润时平仓。 设置说明: Dinamick_profit - 利润水平,以点为单位,总计算; 柱线 - 指标周期; level_1 - 从当前价格到挂单开盘价的距离; level_2 - 从订单开盘价到新订单开盘价的额外距离; Lot - 起始订单量,如果 = 0,MM 有效;
This is a trend indicator based on a strategy created by William Dunnigan that emit signals to buy or sell on any timeframe and can assist in decision making for trading on stock market or Forex. The signals are fired according to the following rules: Buy Signal = Fired at the first candlestick in which close price is higher than the higher price of the last candlestick. The higher and lower prices of the current candlestick must be higher than the corresponding ones of the last candlestick as w

这 超棒的振荡器警报 是一款实用的动量工具,通过比较短期和长期价格走势来衡量市场加速 。它无需交易者持续关注柱状图,而是监控关键信号形态,并在这些形态出现时发送实时弹窗、手机、电子邮件和声音警报。该系统专注于两种行之有效的策略: 飞碟装置 对于早期动量转变和 零线交叉 用于趋势变化检测。可选 零线滤波器 并且能够在触发警报前等待蜡烛图收盘确认,这有助于将真正的信号与市场噪音区分开来。
核心功能
该指标建立在比尔·威廉姆斯经典的指标之上。 动量震荡指标 (AO) 计算的是中位价格 (最高价+最低价)/2 的 5 周期简单移动平均线与 34 周期简单移动平均线之间的差值 。结果显示为: 直方图 通过颜色编码的柱状图直观地展现多空动能的平衡。警报版本监控两种经典的信号模式: 飞碟信号: 当直方图在零线同一侧改变方向时,就会出现这种情况。看涨碟形形态由连续三根K线位于零线上方构成,前两根为红色且向下,后一根为绿色且高于前一根K线 。看跌碟形形态则与之相反,位于零线下方。 零线交叉: 当直方图从零线的一侧移动到另一侧时,

Hello my friends. This Expert Advisor is based on Ichimoku Kinko Hyo and Heiken_Ashi indicator. The input parameters are optimized for EURCAD H1. - magics = magic number - Lots = Lots - CloseMethod = Method to Close order - TP-SL-TSL (if set SL and TP = 0 it will open and close by signal) - MartinBuyOrSell = Open and Martingale oneway - MartinBuyandSell = Open and Martingale twoway - TP = take profit (point) - SL = stoploss (point) - tsl = trailing stop - martin_Plus =
Candlestick Patterns MT5 is a simple and convenient indicator able to define 29 candle patterns.
Advantages Defines and highlights 29 candle patterns; Estimated trading direction is shown as an arrow; Each candlestick pattern can be disabled in the settings; The indicator can be used as an arrow indicator in EAs.
Parameters TextSize - chart text size; TextColor - chart text color; Alert - enable/disable alerts; ---------- Candlestick Patterns ------------- - settings separator; AdvanceBlo
学习如何在MetaTrader AppStore上购买EA交易,MetaTrader平台的应用程序商店。
MQL5.community支付系统支持通过PayPay、银行卡和热门付款系统进行交易。为更好的客户体验我们强烈建议您在购买前测试EA交易。
