 MetaTrader 5
 专家
 指标
 程序库
 实用工具
 窗口小部件
 规则
适用于MetaTrader 5的新EA交易和指标 - 504
 使用EA交易和指标,使外汇交易获得更多盈利。EA交易可使您自动开启和关闭交易,而指标将帮助您更准确地预测市场行为。
该页面提供MetaTrader 5应用程序的目录。
一个专业的交易工具是RSI和价格之间的背离指标,它允许您及时收到关于趋势反转的信号或捕捉价格回调走势(取决于设置)。 指标设置允许您根据RSI峰值的角度和价格的百分比变化来调整发散的强度,这使得微调信号强度成为可能。 指标代码经过优化,并作为Ea交易的一部分进行了非常快速的测试。
指标不重绘,交易方向的箭头正好位于信号出现的位置--在柱的开口处。 Fractal True . PeriodRSI_P = 14 ; //Period IndentFrom50_P = 10.0 ; //Indent +- from 50 [0...50] LeftBars_P = 1 ; //LeftBars RightBars_P = 1 ; //RightBars IndDivForce_P = 15.0 ; //Divergences force of indicator (not for the Lite version) PriceDivForce_P = 0.01
FREE

The Envelopes M indicator is based on the popular Envelopes technical indicator, which is used to create flexible channels where prices stay most of the time. The boundaries of these corridors are two moving averages. But the application that the price is in the channel most of the time is not completely correct, since the channel often breaks out and the price falls far beyond the channel. The main difference of this indicator is that with each new channel breakout, the channel line expands fo

Trend TD is a trend indicator. Thanks to the algorithm of this indicator, the signal will never go against the trend. Thanks to the two lines forming a narrow channel, the algorithm for analyzing entry points, the algorithm controls the reversal moments at the moment when the upper line of the channel has reversed and it is possible to visually draw a line crossing the upper line with itself in the past, while crossing the lower line at one point. If this rule is fixed, then the signal will b

Uni Bot is a trendy neural network trained bot. An expert system based on a neural network based on a new specially developed architecture (T-INN) Target-IntelNeuroNet. For this variant of the Expert Advisor to work, there is no need to download the file of the trained neural network, since for the ease of use by the end user of the neural network forex bot, most users encoded a number of neural networks in the body of the bot. But in order for the bot to better adapt to the specific history

该指标与对象"趋势线","矩形","文本"一起工作,并允许您创建并将它们从一个图表复制到另一个图表。
它是自动复印机更方便的替代方案,因为它允许您更灵活地选择应该复制的内容和位置。
键盘快捷键:
'1,2,3,4,5,6'-创建细水平线(颜色在设置中设置),与SHIFT-粗线相同 '~'-用随机颜色创建一条线))) '7,8,9'-创建阴影矩形(设置中的颜色变化) '0'-创建与图表时间框架相对应的文本。 例如,M5,M15等。 SHIFT+向上箭头-使所选线条更粗 SHIFT+向下箭头-使所选线条更细 'c'-复制选定的对象 'a'-复制所有对象 'v'-粘贴复制的对象 'h'-水平对齐选定的趋势线(在左边缘) 'r'-从图表中删除所有对象 'q'-关闭指示器
指标应该在所有图表上运行。

Gold Edge Pro is the EA designed exclusively for GOLD (XAUUSD). It can also be used in other currency pairs. This EA trades trend-follow using the moving average and multiple time frame RSIs. Use GRID trade. News filters are available. This EA closes with the "DD Reduce" function when drawing down.
You can set trailing stop for "GRID trading" and "DD Reduce" function. Additional trades can be made using the panel. These are automatically settled as GRID series.
You can also manually settle all t

The EA works with 24 pairs, it has been programmed with specific indicators designed by me, it is not the result of optimizations on past facts and events. The EA is fully customizable from input. The EA is able to detect countertrend movements and therefore opens hedging positions until the new signal to protect the account from strong drawdowns (this is a rare fact. In the backtest 2 or 3 times at most) but it still manages to reduce the drawdoWn and avoid major stop losses. Don't judge EA by

專業的交易工具 - AO 和價格之間的背離指標,讓您及時接收趨勢反轉的信號或捕捉價格回調(取決於設置)。指標設置允許您調整由於 AO 峰值的斜率和價格變化的百分比而導致的背離強度,從而可以微調信號的強度。作為 EA 的一部分,指標代碼經過非常快速的優化和測試。
指標不會重新繪製,交易方向的箭頭正好位於信號出現的位置 - 在柱的開盤處。 Fractal True FastPeriod_P = 5 ; //Fast period SlowPeriod_P = 34 ; //Slow period LeftBars_P = 1 ; //LeftBars RightBars_P = 1 ; //RightBars IndDivForce_P = 15.0 ; //Divergences force of indicator (not for Lite version) PriceDivForce_P = 0.01 ;
FREE
A strategy based on triangular arbitration. At the same time, we open positions on three currency pairs. For example, EURUSD – USDJPY – EURJPY, i.e. we buy all three currencies so that the circle is closed. Thanks to this, wherever the price goes, open positions insure each other. Due to this, you can open quite large lots. The adviser will provide you with triangle options himself from all open pairs in the market overview.
The Expert Advisor opens triangles simultaneously in two directions a

This EA watches for trend reversals and pullbacks and opens a position in the right direction based on them. It opens up to three positions in one direction. The exit from a position is based on several criteria. This EA is optimized for the EUR/USD currency pair and the M15 timeframe, but works good on: EUR/USD M10, M12, M20, M30 AUD/NZD M15, M20 NZD/CAD M15, M20 No need to worry about complicated settings. According to the size of your account, enter the starting lot.
Buy Start Lot
Sell Start

MoonWalkerEA 是一款智能外汇交易顾问。 用户手册 支持的货币对: AUDCAD,EURAUD,EURCAD,EURCHF,EURGBP,EURUSD,GBPAUD,GBPCAD,GBPCHF,GBPUSD,USDCHF
特征:
- 全自动模式,每月自动切换配对
- 自动检测时区和夏令时
- 一次一个订单,没有鞅和网格
- 通过挂单最大程度避免滑点
- 用于跟踪位置、修改和退出的高级算法
- 多种退出机制
- 高盈利/亏损比率的策略
-严格使用止损管理,让每一笔交易都得到提前保障
- 只需安装在一张图表中即可运行多对
要求:
时间周期: 任何周期 最低存款: 50 美元 杠杆作用: 1:500及以上 经纪人: ECN账户、对冲账户 虚拟主机: 可视化 Windows 桌面

The Average Daily Range (ADR) is an indicator that shows how far a currency pair can move in a day.
Automatically displays the upper and lower ADR levels.
Automatically calculates the percentage and distance of ADR achieved by the currency pair for the day.
Changes the color and thickness of the ADR line when the price reaches it.
The payment is made in 14 days. It is displayed on timeframes from M1 to M30.

The utility for manual trading to manage open positions.The built-in trailing stop has three modes and seven instruments: by pips, by bar extremes, by fractals, by volumes, by MA, by Parabolic SAR and by ATR. With the help of the built-in trading simulator, you can check how the EA works in the strategy tester. Guide to UTrailingMiniMT5 can be found in the "Comments" section. Benefits 3 trailing stop modes: normal, total and mobile stop loss; 7 options: by points, by bar extremes, by fractals, b

Demarker pullback system - is the manual trading system for choppy markets. It show 2 colored histogram. When histogram is blue - market is quite bullish, when histogram ir orange - market is more bearish. Up arrow is plotted when histogram is in oversold zone but blue color. Down arrow is plotted when histogram is in overbought zone but orange color. These patterns shows false breakout and possible soon reverse(price is overbought but shows bearish signs and price is oversold but shows bullis

Violence Great Wall是MT5智能交易机器人。它考虑了价格的支撑和压力位置,提供了未来阶段化预测,精准的开仓点位,以及稳定的止损位置。
主要交易品种为黄金!保险起见,建议您提供资金在3000美金以上,杠杆建议1:500以上。
开仓极为精准,但是由于开仓因素复杂,一定要保持EA的长时间稳定运行。 下图中展示了开仓获利情况,多因素多周期结合考虑,同时具有一定布林带指标因素,布林带指标提供可随意更改选项,用户可以结合自己盈利目标,自定义布林带,用户也可以不做更改,本EA同样会高精准开单,一旦遇到特定行情会攫取大量利润。 本EA只在MT5上具有运行权力,不提供其他第三方软件的运行。 如遇到强烈波动行情,建议您将手数调低。

Core Long this bot works with the help of two iEnvelopesM indicators (modified iEnvelopes) and one iFractals trading principle for buying and selling at the same time.
The essence of the work is to open a series of orders and exit the market either in profit or with losses, but exit and not linger and open the next series according to indicator signals. The heart of this algorithm is market exit formula, when to exit and with what profit or loss, how many orders can be allowed to be used in a

Core TDM this bot works using the Trend TD indicator.
The essence of the work is to open a small series of orders and exit the market either in profit or with losses, but exit and not linger and open the next series on the signals of the indicator. The heart of this algorithm is the formula for exiting the market, when to exit and with what profit or loss, how many orders can be allowed to be used in a series. And the settings of the Trend TD indicator. The bot works throughout history, but yo

Short TD this bot works using the Trend TD indicator.
The essence of the work is to open a small series of orders and exit the market either in profit or with losses, but exit and not linger and open the next series on the signals of the indicator. The heart of this algorithm is the formula for exiting the market, when to exit and with what profit or loss, how many orders can be allowed to be used in a series. And the settings of the Trend TD indicator. The bot works throughout history,
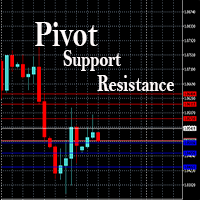
This EA is designed to calculate and draw Pivot Point, Support and Resistance for your selected time frame on the chart.
Works on all currency pair and on any time frames available on MT5.
To make sure the EA works, you need to select the pivot time frame as well as the candle shift that you want to calculate the pivot.
0 = Current candle on chart
1 = Previous 1 candle on the chart

Do you know what is The Blue Ocean Strategy ?
It is when an entrepreneur goes on a brand new market with no concurrence because nobody knows about it. This way, the entrepreneur is in a situation of monopoly and can enjoy this situation as long as nobody comes into the market. And you know what ? This situation is reproducible in bot trading thanks to the Blue Ocean Strategy EA MT5.
I’m a prop firm trader and I use it myself to make all my trades. After many years of use, a friend told me

Session Killzone Indicator
Indicator that helps you to identify the killzone times of both London and NewYork sessions which usually is the most times for high volatility and taking liquidity from the market. Killzone times are configurable through indicator parameters. The indicator adjusts the range of the killzones based on the daily trading range.
FREE

OnBoard stats is a panel that show in a single view a lot of usefull information about working orders and trading account. It has 4 different sub-panels (from left to right): Symbols order statistics : it can be found symbols for which there are orders (market or pendings). Symbol with pendings are colored with "Pendings color". Clicking on a specific symbol row, chart will be changed to that symbol. Current symbol statistics : informations about the "current" symbol, the one which is opened in
FREE

Optimize for time frame and asset before back test and use, use last year or monthly for parameters. XAU/USD 1 HR recommended. Parabolic works on any asset or time frame. This EA uses parabolic sar as the signal. Percentage of margin is used for entries. So for low risk it would be 1% of margin and for medium risk it would be 5-10% and high risk would be above these amounts. Also taking into account the smaller time frame or larger time frame + asset for risk management assessment.
Risk D

Seven copies left at $99 USD. Next price is 149 USD . set file Smooth Lift is an indicator-based trading system that includes 7 indicators, including trend indicators, volume indicators and indicators of possible price movement strength. They are used to confirm the analysis of the main Smooth Lift trading system. The trading is performed on 24/5. The strategy was developed taking into account the movement of the currency pair USDCHF and the best trading performance is on it.
Recommendations:

The KT Trend Angle helps to identify ranging and trending markets. The idea is to only enter a trade following the market trend if the slope is steep enough.
An angle is the ratio of the number of bars to the number of points: The bars mean the time offered by standard (M1, M5, etc.) and non-standard time frames. Points represent the unit of price measurement with an accuracy of 4 or 5 decimal places.
Input Parameters Period: An integer value to define the intensity of angled trendlines. Angl
A very good indicator for experienced and professional traders . A practical approach to trading. Easy to understand. A helping tool for traders looking for price movements .
Signals: Signal Number 1: When yellow line which is a signal line crossing the zero line towards downward direction is a selling opportunity. Signal Number 2:
When yellow line which is a signal line crossing the zero line towards upward direction is a buying opportunity.

2 copies left at 49 USD. Next price is 99 USD . set file
- This is a very aggressive trading strategy, based on a modified MACD indicator. It is used to analyze the anomalous zones of the market + author's methodology to restore the critical movement.
The strategy was developed taking into account the movement of the currency pair USDCHF and the best rates of trade just on it.
Recommendations:
- H1 USDCHF - Leverage of 1:500 or higher (ideally 1:1000 or 1:2000) - Minimum deposit 100 units -

KT Forex Blau Balance combines elements of momentum and volatility. It helps you identify entry and exit points.
Blau Balance consists of two moving averages (a slow-moving average and a fast-moving average) intersecting key transition points in market price. The indicator turns green or red when one is above or below the other, signaling to buy or sell trade signals.
It can be used in currency pairs and other markets that your MT4 or MT5 platform supports. Both short-term and long-term trade

The KT De Munyuk is a trend-based indicator that uses Parabolic SAR to identify the market direction. The indicator shows the PSAR in the form of green/red dots using a separate window. Buy Signal: When a green dot appears after a series of at least three red dots. Buy Exit: When a red dot appears on the current or next higher time frame. Sell Signal: When a red dot appears after a series of at least three green dots. Sell Exit: When a green dot appears on the current or next higher

KT Forex Trend Rider uses a trend following algorithm developed specifically for the Forex market to provide reliable buy & sell signals across the major currency pairs. It works best on major FX pairs and all time-frames.
Features
It comes with a Multi-Timeframe scanner that can search for upcoming signals across all the time-frames. It comes with four preset profiles to facilitate trading for scalpers, tick-trend, swing, and trend traders. It marks the potential reversal points in the market.

Overview This expert advisor is based on statistic model created using historical data. Our model lead to prepare parameters to drive Martingale strategy. It plays on USDCAD pair. To work proper with full strategy EA should be able to open total positions of 3.62 lots (sum of all possible open positions at the same time) and some margin for safety. For example it can be approximately at least 1200GBP with 500:1 leverage on account. It must be able to play 0.01 lots positions. Screenshots presen

About the indicator: DALA Forecast is a universal tool for predicting the dynamics of time series of any nature. For prediction, modified methods of nonlinear dynamics analysis are used, on the basis of which a predictive model is built using machine learning methods. To get the trial version of the indicator, you can contact me in private messages.
How to use the indicator: Apply the indicator to your chosen financial instrument or indicator with the settings you need. The prediction will be
FREE

Violence Great Wall是MT5智能交易机器人。它考虑了价格的支撑和压力位置,提供了未来阶段化预测,精准的开仓点位,以及稳定的止损位置。
主要交易品种为黄金!保险起见,建议您提供资金在3000美金以上,杠杆建议1:500以上。
开仓极为精准,但是由于开仓因素复杂,一定要保持EA的长时间稳定运行。 下图中展示了开仓获利情况,多因素多周期结合考虑,同时具有一定布林带指标因素,布林带指标提供可随意更改选项,用户可以结合自己盈利目标,自定义布林带,用户也可以不做更改,本EA同样会高精准开单,一旦遇到特定行情会攫取大量利润。 本EA只在MT5上具有运行权力,不提供其他第三方软件的运行。 如遇到强烈波动行情,建议您将手数调低。

Katana Trading Panel is a tool with many features that help you open and manage your trades more easily. Note: - Click here for Tutorial and Download demo .
- Click here for Katana Trading Panel MT4
- G o to my profile to message me .
- This EA will not work in Tester
The Features: - Line Preview: Show preview on the chart for opening price, take profit and stop loss. It's draggable and contains some valuable information. For market trade and pending trade. - Opening Trade Setting :

The Roll the Field indicator displays signals in a simple and accessible way in two colors (when to buy and when to sell is determined by changing the color). Knowing the entry point of each currency is very important for every forex trader. The intelligent algorithm of the indicator accurately determines the trend, filters out market noise and generates entry signals.

Point discussion is a fundamental technical indicator - an algorithm that allows you to obtain data on future prices using quotes data for a certain period of time specified in the indicator settings. The technical analysis indicator Point discussion is based on a special formula. It is with its help that the calculation takes place. The indicator is well suited for determining a reversal or a large sharp jerk to one side, thanks to it you will know when this happens, it will notify you by the a

the fundamental technical indicator Informative Trend, which allows you to assess the current market situation in order to enter the market of the selected currency pair in a trend and with minimal risk. It basically uses the process of identifying the rate of change in price growth and allows you to find entry and exit points from the market.
The indicator was created on the basis of the original indicators for searching for extreme points and is well suited for determining a reversal or a la

Core SCB this bot works without indicators , the principle of trading is for buying and selling at the same time .
It should be noted that no matter how well the indicators show, there is always a moment when the indicator can give a signal to enter at the peak of the beginning of the trend in the other direction. Thus, the essence of using the indicator is completely reset. Therefore, one of the options for getting out of the situation is to completely abandon indicators and constantly work o

The movement exhaustion is a color rule that helps indicate when the movement will revert its direction. The darker the color, the greater the probability to revert. The indicator is based on the price statistic. Works on every timeframe, every instrument. Five color options: 0. Natural movement. (Gray) 1 - 4. Movement exhaustion (Yellow to maroon) The trader can use it as reversal or exhaustion signal. In a trend following trade it can be used as an exhaustion signal, indicating the movement ca

Here’s the problem: the default zigzag indicator given in MT5 trading platform does not really capture the most of the highs and lows on chart do draw zigzags. On chart below, notice that some of ther high, low of price have been missed to draw zigzags by this default zigzag indicator (picture 1). It is not so apparent until you compare default zigzag indicator to this SwingZZ indicator. Have a look on picture 2 and 3. The swing zigzag indicator is best because it captures most of the swing high
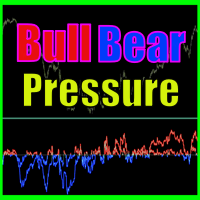
Bull bear pressure indicator - is the manual system which defines bull/bear market. When lines is above zero level - market is strong bullish, and when lines below zero level - market is bearish. First line represents global trend and second one are smoothed and shows local market's mood. Main inputs are : MainPeriod- main indicator's period for global trend calculation; SignalPeriod - period for smoothed and shows local market's trend; Main Indicator's Features Signals are not repaint,non-late
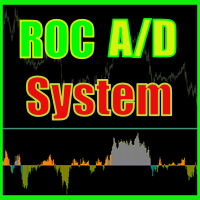
ROC acceleration-deceleration is the manual system for medium-term scalping. Indicator based on custom ROC system which defines bullish/bearish market and especially acceleration-deceleration of tendention in the market's main direction. Buy arrow is plotted during bearish market when current trend decelerates and sell arrow is plotted during bullish market when current trend decelerates. Main Indicator's Features Signals are not repaint,non-late or disappear(exept cases when system recalculat

ASI fractals with DPO filter - is the manual trend-following system. ASI fractals are the base of every trend. System plots an arrow when fractal pattern appears on ASI indcator and DPO direction is same as incomming signal. System has several ways of usage : simply indicator, indicator with suggested arrows, arrows with single targets and arrows with common profit targets. User can simply switch indicator's modes directly from chart. Main Indicator's Features Signals are not repaint,non-late or
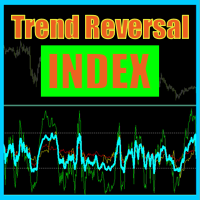
Trend reversal index - is the manual trading system that works with overbought , oversold levels and reversal patterns. Sell arrow is plotted when indicator is higher than overbought level and here forms reversal pattern, all pattern points located higher than overbought level. Opposite with buy arrow : ndicator is lower than oversold level and here forms reversal pattern, all pattern points located lower than overbought level. Main Indicator's Features Signals are not repaint, late or disapp

Theoretical Foundation The Keltner Channels are channels ploted using volatility deviations above and bellow a moving average. The indicator is an excellent tool to help the trader build trend and mean-reversion strategies. Parameters The Orion Dynamic Keltner allows the user to select the Volatility Calculation Type, being ATR or Average Range (not considering price gaps). Also, the user can select the Calculation Period, Number of Deviations, Moving Average Mode and the Moving Average Ca

Theoretical Foundation Similar to the well-known Average True Range (ATR), the Average Range indicator is a volatility measure that is calculated using only the range of the bars (high – low), not considering the Gaps, as with the ATR. The Average Range can be very useful for day traders as it allows one to get the measure of the volatility of the last N bars. Parameters You can select the calculation period of the indicator.

Early WPR divergence - is the manual system to define trend reverse. Green histogram shows main trend, Orange one - shows "short"/local trend. System is looking for clear divergence between both trends and pick up position(plot buy/sell arrows). When main trend is up, but local trend reverses to bearish trend and get's big power - sell arrow is plotted; When main trend is down, but local trend reverses to bullish trend and get's big power - buy arrow is plotted; Main inputs are : mediumTrendPe

Optimized from 2004 to 2022. Optimize further after this date, use monthly or yearly. Experts need optimizing as markets develop new ranges. New Age Bot trades XAU/USD on 5 minute charts. Entry - Bollinger bands and trend trading reversals is used for entries. Stops - Trailing stops are used with ATR. Money - lots Bollinger band period - 20 MA period - 100 Deviation - 2.0 Symbol for build - XAU/USD Time frame for build - 5 minute charts Risk Disclaimer Trading foreign exchange on margin carri
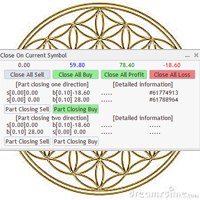
Utility / EA to simplify the exit from the drawdown. Allows you to gradually exit the drawdown correctly, reducing the volume of losing trades. At the same time, profitable trades opened on the same symbol cover losing trades in whole or in part. The volume of partial closing of a losing trade is calculated automatically. Trades opened both in one direction and in the opposite direction are supported. Position Management Closing positions only for purchase, only for sale, only profitable, only

BLACK FRIDAY SPECIAL: 70% OFF + FREE GIFT! Massive savings on our top automated systems: Buy Forex Trend Detector: Only $197 (Save 70% — Regular price: $547) BONUS EA: Get Crypto Master EA 100% FREE (Regular price: $497) Total Value: $1044 — Yours today for just $197! How to claim: Direct message (DM) us your purchase confirmation to unlock your free Crypto Master EA license! Full offer details & live performance stats: https://www.mql5.com/en/blogs/post/778315 For Settings and Instructions Cli

Robô Davi I by Êxodo Capital is a professional system for traders created for the MT5 platform and optimized to work with MINI FUTURE INDEX (WIN) at B3 in BRAZIL.
The system uses bias algorithms. After identifying the trend, the position is opened and the robot conducts the trade through a trailing stop that will be driven by the 13-period average. Maximum GAIN of 2200 pts.
Main features Our setup has the option to use martingale, the EA has the option to customize. Presentation in the grap
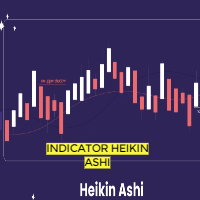
In this indicator, Heiken Ashi candles are calculated with the most optimal method. You can also customize the results by adjusting the amount of period and method input. But the most important advantage of this indicator is the adjustment of the time frame value. You can use this to calculate the Heiken Ashi chandels to See in time frames with lottery in the lower time chart. In this case, you get the best signal to buy or sell using two or more Heiken Ashi indicators with different timeframes
FREE

Normal Parabolic SAR with label of long or short state. Tells also "Parabolic long" and "short". Can be used in multitimeframe layouts together with Swiss HolyGrail indicator or in different timeframes. So, if all the indicators show "long" or "short" you can be sure that the risk of a wrong direction is small. The standard values for Parabolic SAR are 0.02 for step and 0.2 for maximum. You may experiment with changing the maximum to get smother curves. Note that changes in parabolic SAR are la
FREE
Индикатор отображает изменение баланса В правом нижнем углу окна.
Отображаются следующие периоды Сегодня Вчера 3 дня Неделя 10 дней Месяц 3 месяца Полгода Год Все время Есть возможность выставить расчетное время. Удобно пользоваться для расчетов прибыли/убытков с определенного часа.
Будет полезен например ночным скальперам. Данные совпадают с расчетами отчета в терминалее.
FREE

Happy Summer EA is Powefull Expert Advisor base on trend following strategy. This expert using dynamical algorithm to cathching the market trend. With this EA orders that are made seem to be happy in the market in tune with the trend signal. This EA have a good performance that has been tested more than 1 years with real ticks history data.
Although this EA can be use on any pairs, but please Use this EA on EURUSD Pair at M15 timeframe. Account type : HEDGE.
Happy Summer EA design for EUR

Precision Trading with the Inside Bar Pro Indicator for MT5 The Inside Bar Pro indicator by @Billyenaire is a powerful tool designed for traders who rely on clean, price-action-based setups. It automatically detects inside bar formations—candlestick patterns where the current candle is completely contained within the high and low of the previous candle. Key Features: Automatically identifies inside bars in real-time Highlights inside bars directly on the chart using customizable candle colors W

Boleta para operações Long & Short na bolsa Brasileira B3 exclusiva para o mercado A VISTA com lotes padrão. A boleta calcula automaticamente as quantidades dos ativos (compra/venda) da operação baseado no capital informado. É possível determinar os horários de início e término das operações quando selecionado opção para Day Trade. A boleta pode iniciar e terminar as operações automaticamente baseado em horários. Podem ser definidos altos de Ganho (TP) e perdas (SL) em percentual (%). Basta cli
You need to optimize before back test and use Last Month or Last Year Option in Tester. This is part of this EA, which has more advanced aspects to it: https://www.mql5.com/en/market/product/87051 This Expert work towards a positive expectancy. It take positions in a hedging fashion buy and sell on both sides. A hedge account is needed in order for this EA to do as intended. The EA is based on taking both sides, the random nature of the market and the capability of one side being in a positi

OPTIMIZE BEFORE BACKTEST AND TRADING Day trade the markets. Any market, any time frame but its recommended to trade 5 minutes for some inputs but experiment with time frames and assets to see the best . It is important to optimize the inputs of the EA before back testing and using. Last month option to a year is recommended.
Parameters for intraday trading are: Weight Weight of signal of the module in the interval 0 to 1. GoodHourOfDay Number of the only hour of day (from 0 to 23) when trad

reguired set file Live Siqnal - is a trading system based on the correlation of several classical indicators with certain parameters to achieve the necessary goals of market entry and exit control. The minimum number of parameters greatly simplifies the work with the Expert Advisor. The strategy is based on a classic overbought/oversold system with the possible influence of market strength on the price movement in a certain direction. Recommendations for trading: - TF H1GBPUSD - leverage 1:500
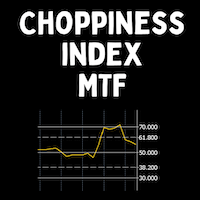
The Choppiness Index was created by Australian commodity trader E.W. Dreiss. It is designed to determine if the market is choppy (trading sideways) or not choppy (trading within a trend in either direction). A basic understanding of the indicator would be; higher values equal more choppiness, while lower values indicate directional trending. The values operate between 0 and 100. The closer the value is to 100, the higher the choppiness (sideways movement) levels. The closer the value is to 0,

Meet the new generation ichimoku cloud. You can develop hundreds of strategies on it. Or you can open a trade directly by looking at whether it is above or below the cloud.
Now it is much easier to know the trend...
Once you get used to this cloud, you won't be able to look at the graphics without it.
The calculation logic is completely different and you will experience the privilege of looking at the market from a different perspective.
By looking at the chart, set the appropriate paramete

YouTube上的指標直播。更多可信度請點擊下面的鏈接。還有指標的視頻可以觀看。注意直播晚了,不要依賴,只有對指標的回顧僅回顧指標的準確性,幾乎不輸,利潤率達到 95%。我將在 CRASH coin 1000 INDICES 上非常準確地工作 YouTube上的指標直播。更多可信度請點擊下面的鏈接。還有指標的視頻可以觀看。注意直播晚了,不要依賴,只有對指標的回顧僅回顧指標的準確性,幾乎不輸,利潤率達到 95%。我將在 CRASH coin 1000 INDICES 上非常準確地工作 YouTube上的指標直播。更多可信度請點擊下面的鏈接。還有指標的視頻可以觀看。注意直播晚了,不要依賴,只有對指標的回顧僅回顧指標的準確性,幾乎不輸,利潤率達到 95%。我將在 CRASH coin 1000 INDICES 上非常準確地工作

DESCRIPTION
The EasyFollowerTrader-Bot3-DayTrade indicator only trades with the trend. Thus, the indicator will, at first, observe the trend of three averages synchronous with the selected time-frame. Then the indicator observes the trend of the daily chart. When these two charts are moving in the same direction, we have the highest probability of winnings. We will call this region the region of high probability of gain.
In the region of high probability of gain, the indicator will indicate t

DESCRIPTION
The EasyFollowerTrader Bot4 DayTrade indicator always trades with the trend. Thus, the indicator, at first, observes the trend of the average of the highs and lows of the candles of the selected time-frame. Then see if this trend is in line with the trend of the daily chart to operate in favor of the major trend. When these two charts are moving in the same direction, we have the highest probability of winnings. We will call this region the region of high probability of gain.
In t

DESCRIÇÃO O indicador EasyFollowerTrader-Bot2-DayTrade opera apenas a favor da tendência. Assim, o indicador, em primeiro momento, observar a tendência de três médias síncrona com o time-frame selecionado. Em seguida, o indicador observar a tendência do gráfico diário. Quando estes dois gráficos estiverem se movimentando na mesma direção, teremos a maior probabilidade de ganhos. Chamaremos esta região como região de alta probabilidade de ganho. Na região de alta probabilidade de ganho, o ind

下一代自动化供需区。适用于任何图表的创新算法。所有区域都是根据市场的价格行为动态创建的。
两种类型的警报 --> 1) 当价格触及区域时 2) 当新区域形成时
你不会再得到一个无用的指标。您将获得一个完整的交易策略和经过验证的结果。
新的功能:
价格触及供需区时发出警报
创建新的供应/需求区时发出警报
推送通知警报
以点为单位的区域宽度标签
关于 MTF 的又一个时间表。因此,现在您将能够看到高于当前 3 个时间帧,而不是高于当前 2 个时间帧
启用/禁用警报/区域/MTF 功能的按钮
您获得的优势:
消除交易中的情绪。
客观化您的交易条目。
通过高概率设置提高您的利润。
节省绘图区域的时间。
像专业人士一样交易金融市场。
任何市场的即时多时间框架分析。
你在图表上看到了什么?
蓝色和红色矩形是当前时间范围的供需区。
虚线样式线是当前上方第一个时间范围内的供需区域。
实线样式线是当前上方第二个时间范围内的

Simple ATR Modern 一个简化的工具,用于更清晰地跟踪市场波动性,适合日内交易和波段交易。 它是开始交易或初学者的最佳指标。
视觉指标颜色:ATR Daily - 蓝色 通过结合 Volatility Vision 指标增强分析。 精确测量市场状况的波动,对日内交易和波段交易决策至关重要。 利用基础的 14 天(可配置)简单移动平均真实范围指标确保准确性。 适用于在交易系统中实施开仓或退出策略。 为什么 ATR 指标优于其他指标: 使用简单:ATR 指标易于设置和理解,即使是新手交易者也能轻松上手。 多功能性:适用于日内交易和波段交易,在各种交易策略中提供灵活性。 可靠性:ATR 提供准确的市场波动数据,帮助交易者做出更明智的决策。 可定制性:能够调整移动平均周期,使交易者能够根据自己的特定需求和偏好调整指标。 可组合性:ATR 易于与其他指标结合,如 Volatility Vision ,进行更深入的市场状况分析。

T Manager, the ultimate trade management solution designed by traders for traders. If you are searching for a simple and efficient trade panel, trade manager, or trade assistant, you are at the right place. The market contains a diverse number of those tools , but this one is designed by traders for traders . I designed this tool, and I am using it daily.
Take my advice and stop buying tools blended with un-useful features that you will never use, T Manager provides you with the essential y

交易printscreen是一个脚本,旨在自动保存图像与帐户交易进一步分析。 该面板允许您显着减少与历史记录中搜索交易相关的技术工作的时间,并通过显示和绘制所有操作参数以图像格式保存文件。
这个脚本解决了哪些任务?:
您不需要在交易历史记录中搜索所需的交易:您只需选择一个周期,脚本就可以找到指定周期的所有交易交易,并为每个交易保存一个图像,显示价格水平和一个带有交易参数的面板。 如果您只想保存一个交易的信息,请在输入参数中选择适当的选项,并输入所需交易的票证(ID)。 您不需要浪费时间组织文件,搜索并将它们保存在文件夹中:脚本将根据以下原则将每个文件分解到自己的目录中:/"终端目录"/MQL5/文件/"经纪人名称"/"帐户号码"/"位置票"/"以下是所选文件的数量" 该脚本将为您收集有关交易的必要信息,并将其记录在打印屏幕上的单独面板上
使用脚本的顺序
运行脚本
确保终端已连接到交易账户。 检查账户上是否有交易记录。 输入参数
MetaTrader市场是独有的自动交易和技术指标商店。
阅读MQL5.community用户备忘更多地了解我们提供给交易者的独特的服务:复制交易信号,自由职业者开发的自定义应用程序,通过支付系统完成的自动付款和MQL5云网络。
