 MetaTrader 5
 专家
 指标
 程序库
 实用工具
 窗口小部件
 规则
适用于MetaTrader 5的新EA交易和指标 - 498
 使用EA交易和指标,使外汇交易获得更多盈利。EA交易可使您自动开启和关闭交易,而指标将帮助您更准确地预测市场行为。
该页面提供MetaTrader 5应用程序的目录。
Reversal candles indicator , use in second window with rsi,levels 10-20-50-80-90 so u can see where the reversal candles pop upat the overbought oversold rsi levels.Great oppertunity to get in early and get out at the best moment. Candle turns blue at the 10-20 level "buy" candle turns red at the 90-80 level "sell" Always look at the major trend beore taking a buy or sell!!!
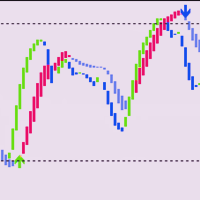
Necessary for traders: tools and indicators Waves automatically calculate indicators, channel trend trading Perfect trend-wave automatic calculation channel calculation , MT4 Perfect trend-wave automatic calculation channel calculation , MT5 Local Trading copying Easy And Fast Copy , MT4 Easy And Fast Copy , MT5 Local Trading copying For DEMO Easy And Fast Copy , MT4 DEMO Easy And Fast Copy , MT5 DEMO
Auxiliary indicators It waits for the hunt, waits for the price limit to appear, waits for a

Stair shape EA was created after several years of effort and programming by a strong program team. This expert is a fully automated, multi-currency trading system that doesn't require any special skills from you. Just fire up this EA and rest. You don't need to set up anything, EA will do everything for you. But if there is a problem or you do not know what to do, be sure to let me know. I will help you in the shortest possible time. The expected estimated profitability according to the backte

Save Profit MT5 was created after several years of effort and programming by a strong program team. This expert is a fully automated, multi-currency trading system that doesn't require any special skills from you. Just fire up this EA and rest. You don't need to set up anything, EA will do everything for you. But if there is a problem or you do not know what to do, be sure to let me know. I will help you in the shortest possible time. The expected estimated profitability according to the backte
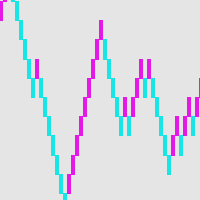
砖块图——一种备用的交易方式 如果你是一个对无数图表中的蜡烛图感到困惑的交易者,又或者说并不知道要怎么画线,也不知道支撑线阻力线怎么画,这个时候就应该另找一个适合自己的交易方法了。就像一个司机在反复遇到问题后会停下来进行全面检修一样, 一笔交易也是如此。 砖块图为盘中交易员提供了一种简单的交易方法,实际上这种方法和K线来说,具有同样的历史,并且也是起源于日本。 为了定义一个砖块图,他们只描述了一个设定点或基点的价格趋势。例如,一个10点的砖块图只能描绘出价格变动中10点的上升趋势或10点的下降趋势。 砖块图有一个得天独厚的优势,就是它的价格不和时间挂钩,也就是说只有价格变化达到了设定的数值,才会有一个新的砖块图出现,并且砖块图去掉了价格的毛刺,所以从感官上感觉会非常的舒服。

The robot uses one of the most used indicators in Asia:
* ICHIMOKU CLOUD *
There are two trading strategies:
Crossing of Tenkan and Kijun lines and; Kumo lines crossing.
Know our products
Position openings are based on the parameters identified as signals, if you activate all the robot will issue a trading order only if the number of signals is greater than the minimum stipulated by the user.
This Expert Advisor (EA) works on HEDGE (Forex, etc.) and NETTING (Bovespa, etc.) accounts, but
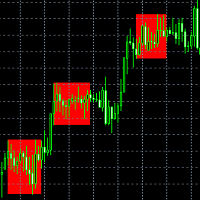
该指标检测平仓,并在发现的区域画上一个彩色的矩形。
该指标的主要思想是,当价格填满图表上的某个区域时,检测出一个平盘。
输入参数:
Color rectangle - 要着色的矩形的颜色。
Bars in rectangle - 矩形中允许的最小条数。
Density in % - 扁平的密度,设置为矩形区域的百分比。 __________________________________________________________________ __________________________________________________________________ ________________________

"Elder Ray" or "Ray" indicator is based on the Dr. Alexander Elder's oscillators: Bulls & Bears Power. Both of them works with an EMA. This indicator is used by traders to identify divergence, market directions and more... Dr. Elder's method generally uses a 13-day EMA Period but this can be modified based on your personal demand. The calculations are: Bulls Power= high candle - EMA close Bears Poder= low candle - EMA close Lime line represents Bulls Power and OrangeRed line, shows Bears Power
FREE

春季大促销 50%! 价格 199 美元。原价 399 美元 我们的所有信号现在都可以在 myfxbook 上获取: 点击此处前往 独特的设置文件和所有建议均免费提供。 顾问的所有未来更新均包含在价格中。 购买后,请联系我,我会帮助您正确安装和配置机器人。 我还将与您分享如何从可靠的经纪人处获得免费 VPS 的信息。 这是一个多货币专家顾问与智能订单打开功能,新闻过滤器和动态下降控制。
专家顾问分析每个蜡烛的价格和它的动态偏差在报价流,并作出决定,只有当蜡烛关闭。 一系列订单只有在取得积极结果时才会关闭。
算法系统与风险控制技术相结合,以减少账户缩编。 冠军EA适合初学者和经验丰富的交易者。
高级仪表板显示每对的交易进度和必要的帐户数据。
所有设置都经过优化。 不需要额外的set文件。 在一个图表中添加一个专家顾问就足够了,它将自动交易所有允许的对。 只需要建立所需的风险比率/收入。
主要货币对: AUDCAD,NZDCAD,AUDNZD
额外对:EURCAD,GBPCAD
使用的时间范围:H1 说明: 这里
冠军EA顾问的优势: 独特的交易算法 内置

Ing (inguz,ingwar) - the 23rd rune of the elder Futhark ᛝ, Unicode+16DD. Add some runic magic to your trading strategies. The correct marking of the daily chart will indicate to you the successful moments for counter-trend trading. Simple to use, has high efficiency in volatile areas. Be careful in lateral movements.
Signals ᛝ are generated when the main lines of construction intersect.
Red arrow down - recommended sales
Blue up arrow - recommended purchases
rare purple arrows indicate exce

Implements a channel based on integrated comparison of moving average values with improved functionality. As a result, the chart displays a channel of deltas of moving averages in the center line and an indentation of the channel boundaries over a specified range.
What is the channel? This is the price range (limited), in which all its dynamics (movement) takes place over a certain period of time. This method is very old, the Forex channel strategy dates back to a long time, when the theory
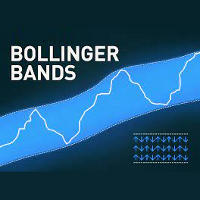
Bollinger Bands (BB) are similar to Envelopes. The difference between them is that the boundaries of the Trade Bands (Envelopes) are located above and below the moving average curve at a fixed percentage distance, while the Bollinger Bands are plotted at distances equal to a certain number of standard deviations. Since the magnitude of the standard deviation depends on volatility, the bands themselves adjust their width: it increases when the market is unstable, and decreases in more stable per
Moving average, moving average (English Moving average, MA) is a general name for a family of functions, the values of which at each point of determining the level of some average value of the original function for the previous period.
CalcPipsOn - In order to add rozruhunok on the chart, you must activate this field.
The previous development of a variant of this indicator differed in that it had an extended functionality for calculating averaging in the set, as well as advanced possibiliti

Implements a channel based on the moving average indicator with improved functionality.
Moving average, moving average (English Moving average, MA) is a general name for a family of functions, the values of which at each point of determining the level of some average value of the original function for the previous period. The channel moves up and down relative to the moving average by a specified number of points.
This indicator is suitable for those who are interested in the classic calcul
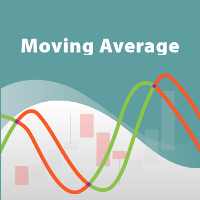
Moving average, moving average (English Moving average, MA) is a general name for a family of functions, the values of which at each point of determining the level of some average value of the original function for the previous period.
This indicator is suitable for those who are interested in the classic calculation method but with improved functionality. There is a version for both MT4 and MT5.
Moving averages are commonly used in time series data to smooth out short-term fluctuations and

Vegas Tunnel, with up to 20 levels, allowing you to plot or not each level with color change, line thickness and ON/OFF visualization for easy use 100% free and lifetime Recommended use for time frames: Original --> H1 Fractals --> M15, M30, H4, D1 and W1 When the black dots are above the tunnel, start short positions. When the black dots are below the tunnel, start long positions. It's important to remember that just because the market breaks the line of lying doesn't mean it's time to enter a
FREE
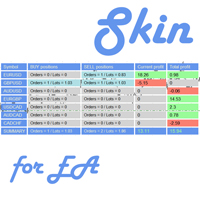
This utility is a graphical shell for other Expert Advisors that do not have their own graphical shell or whose graphical shell you do not like. Just run the utility on a free chart of any currency pair, specify in the input parameters the "Magic Number" of the advisor to which you want to connect the utility, and a graphical shell will appear on the graph, containing information about the traded currency pairs, current positions and trading results of your advisor. If you like this utility, tak
FREE

BLAZING NIGHT SCALPER ALL NEW GRID RECOVERY SYSTEM ADDED
Night scalping using Stop Losses have worked incredibly well in previous years prior to 2022. Blazing Night Scalper was originally tested on more than 10 years of Tick Data using Take profit and Stop Loss with amazing results. As soon as we hit 2022 night scalpers became gradually more difficult to gain profits most likely due to many reason such as brokers increasing spreads and having too many Expert advisors trading during these hours
An indicator of patterns #5 and #6 ("Wedges, ascending, broadening" and "Wedges, descending, broadening") from Encyclopedia of Chart Patterns by Thomas N. Bulkowski.
Parameters: Alerts - show alert when an arrow appears Push - send a push notification when an arrow appears (requires configuration in the terminal) PeriodBars - indicator period ArrowType - a symbol from 1 to 17 ArrowVShift - vertical shift of arrows in pixels ShowLevels - show levels ColUp - color of arrow up СolDn - color of
An indicator of patterns #1 and #4 ("Broadening Tops" and "Broadening Bottoms") from Encyclopedia of Chart Patterns by Thomas N. Bulkowski. Version 1: bottom, top, bottom, top, top breakout. Version 2: top, bottom, top, bottom, top breakout.
Parameters: Alerts - show alert when an arrow appears Push - send a push notification when an arrow appears (requires configuration in the terminal) Variant1 - show version 1 of the pattern Variant2 - show version 2 of the pattern PeriodBars - indicator
An indicator of patterns #2 and #3 ("Broadening formation right-angled and ascending" and "Broadening formation right-angled and descending") from Encyclopedia of Chart Patterns by Thomas N. Bulkowski.
Parameters: Alerts - show alert when an arrow appears Push - send a push notification when an arrow appears (requires configuration in the terminal) PeriodBars - indicator period K - an additional parameter that influences the accuracy of pattern shape recognition. The smaller the value is, the
An indicator of patterns #13 - #20 ("Double Tops" and "Double Bottoms", types Adam-Adam, Adam-Eva, Eva-Adam, Eva-Eva) from Encyclopedia of Chart Patterns by Thomas N. Bulkowski. Adam - sharp tops/bottoms, Eva - flat ones. Parameters: Alerts - show alert when an arrow appears Push - send a push notification when an arrow appears (requires configuration in the terminal) PeriodBars - indicator period K - an additional parameter that influences the accuracy of pattern shape recognition. The smalle

ChannelVM - is a channel indicator converted from an indicator for MT4 to an indicator for working in MT5.
In addition to displaying price channels on a chart, it recognizes the simplest patterns - "triangle" and "flag".
Helps to determine further price movement.
Has simple and understandable settings that do not need a description.
When redesigning for the MT5 trading terminal, the logic of work and the appearance of the original indicator were preserved as much as possible.

Implements an oscillator based on a simple comparison of the last two moving average values with improved functionality. As a result, the graph displays the delta of the two moving average values. In the case of a single value, the moving delta is calculated relative to the last two candles, which price of comparison will be specified in the Price parameter. The delta of two values is often used to determine the trend, depending on the length of the moving averages, it can be a longer or sh
An indicator of patterns #9 and #10 ("Cup with handle") from Encyclopedia of Chart Patterns by Thomas N. Bulkowski.
Parameters: Alerts - show alert when an arrow appears Push - send a push notification when an arrow appears (requires configuration in the terminal) PeriodBars - indicator period K1 - an additional parameter that influences the accuracy of recognition and pattern shape (the lower the value, the smoother the cup edge is) K2 - an additional parameter that influences the accuracy of
An indicator of patterns #24, #25, #26 and #27 ("Head and Shoulders", "Complex Head and Shoulders") from Encyclopedia of Chart Patterns by Thomas N. Bulkowski.
Parameters: Alerts - show alert when an arrow appears Push - send a push notification when an arrow appears (requires configuration in the terminal) PeriodBars - indicator period K - an additional parameter that influences the accuracy of pattern shape recognition. The smaller the value is, the smoother the row of peaks/valleys should
An indicator of pattern #54 ("Dead cat bounce") from Encyclopedia of Chart Patterns by Thomas N. Bulkowski.
Parameters: Alerts - show alert when an arrow appears Push - send a push notification when an arrow appears (requires configuration in the terminal) PeriodBars - indicator period ArrowType - a symbol from 1 to 17 ArrowVShift - vertical shift of arrows in pixels. Note. Arrows appear on a forming bar and do not disappear.
It cannot be guaranteed that the indicator recognizes the patter
An indicator of pattern #55 ("Dead cat bounce, inverted") from Encyclopedia of Chart Patterns by Thomas N. Bulkowski.
Parameters: Alerts - show alert when an arrow appears Push - send a push notification when an arrow appears (requires configuration in the terminal) PeriodBars - indicator period ArrowType - a symbol from 1 to 17 ArrowVShift - vertical shift of arrows in pixels. Note. Arrows appear on a forming bar and do not disappear. It cannot be guaranteed that the indicator recognizes

The QRSI indicator is one of the most important and well-known indicators used by traders around the world. By its nature, the QRSI indicator is an oscillator, that is, it fluctuates in a certain zone, limited by the maximum (100) and minimum (0) values. Specifically, this indicator works according to an accelerated algorithm, but this is not its only difference. This indicator implements a more advanced calculation based on the Relative Strength Index algorithm. The peculiarity of the implemen
An indicator of patterns #50 and #51 ("Triple Bottoms", "Triple Tops") from Encyclopedia of Chart Patterns by Thomas N. Bulkowski.
Parameters: Alerts - show alert when an arrow appears Push - send a push notification when an arrow appears (requires configuration in the terminal) PeriodBars - indicator period K - an additional parameter that influences the accuracy of pattern shape recognition. The smaller the value is, the smoother the row of peaks/valleys should be, so fewer patterns will be
An indicator of patterns #45 and #46 (Three Falling Peaks and Three Rising Valleys) from Encyclopedia of Chart Patterns by Thomas N. Bulkowski. Parameters: Alerts - show alert when an arrow appears Push - send a push notification when an arrow appears (requires configuration in the terminal) PeriodBars - indicator period K - an additional parameter that influences the accuracy of pattern shape recognition. The smaller the value is, the smoother the row of peaks/valleys should be, so fewer patt
This expert advisor trades using the famous super trend indicator: it is completely loyal to the original algorithm and implements many other useful features for the exigent trader, like customizable trading sessions, multi-timeframe filters and many others. [ Installation Guide | Update Guide | Troubleshooting | FAQ | All Products | Get Help ] Easy to use and supervise Fully configurable indicator settings Customizable break-even, stop-loss, take-profit and trailing-stop settings Works fo
FREE

Ferramenta derivada do DR Assistant, a versão Lite conta com recursos semelhantes, mas sendo mais específica em sua aplicação, destina-se exclusivamente ao uso para gestão de ordens abertas a partir de suas funções. Deste modo, quaisquer outras negociações ou posições abertas por outras ferramentas ou manuais serão ignoradas pelo Assitant Lite. Os parâmetros e configurações disponíveis, bem como suas principais funções são: - Take Profit e Stop Loss: duas opções de Steps, em pontos, para ambas a
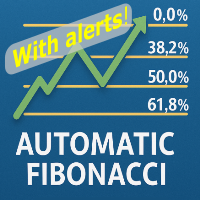
Automatic fibonacci with alerts is an indicator that automatically plots a fibonacci retracement based on the number of bars you select on the BarsToScan setting in the indicator. The fibonacci is automatically updated in real time as new highest and lowest values appear amongst the selected bars. You can select which level values to be displayed in the indicator settings. You can also select the color of the levels thus enabling the trader to be able to attach the indicator several times with d
FREE

RSI Scanner, Multiple Symbols and Timeframes, Graphical User Interface An indicator that scans multiple symbols added from the market watch and timeframes and displays result in a graphical panel. Features: Multi symbol Multi timeframe Alerts and Notifications Live Monitoring Sorting modes One click to change symbol and timeframe Inputs for RSI and scanner settings
FREE

Killer Market MT5 is an advisor with a system for "Resolving" a basket of unprofitable orders, a news filter, a filter for open positions on other trading instruments and the function of sending trading signals to your Telegram channel.
The Expert Advisor can be used to restore unprofitable positions on the account as a utility to bring trades to breakeven that you opened with your hands or other Expert Advisors.
Works inside a linear regression channel, input on several conditions. The sig

This indicator is an oscillators that shows the real strength of 8 main currencies in the Forex market. It recreates a basket of the main currencies and applied a True Strength Indicator on each of them. The calculated real currencies are: EUR - USD - GBP - CHF - JPY - AUD - CAD - NZD. It clearly identifies overbought and oversold ares. From reading the oscillator you can choose the right Forex symbol to trade.
Future versions: I am working on adding alarm and a real buy sell signal, choosin
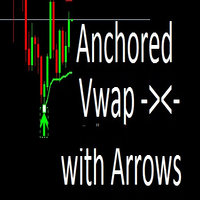
An anchored Vwap With Arrows is an indicator that includes a moving average weighted by volume that allows you to plot on a bottom or a top. Usually banks and institutions measure an average price, this average price is a price range where they agree to make a trade. Using the logic of anchored vwap with arrows it is possible to understand that if the price breaks the vwap it means that someone with enough buying and selling power has lost control. You can use vwap anchored with arrows in any ti
This is the MetaTrader version of the very popular Squeeze Momentum indicator. It is based of of John Carter's TTM Squeeze volatility indicator, as discussed in his book Mastering the Trade. With this version you can enable notifications when a squeeze is released (push notification, email, or pop-up message). Strategie
Grey dots indicates a squeeze in the current timeframe. Blue dots indicates that the squeeze is released. Mr. Carter suggests waiting till the first blue dot after a grey dot an
Horizontal volume bars, Cluster analysis, Volume profile Volume in Range gets information about the accumulated volume in a specified vertical range and period in bars. The received data is then plotted on the chart as rectangular boxes with the volume quantity inside. Usage:- The tool acts as a support resistance levels but most importantly it should be used to check in which direction the price breaks out of the significant levels formed by this indicator and then actions to be taken on correc
Market structures, Market balance, Range breakouts This tools helps to identify areas of market ranges, structures and plots colored boxes on breakout of those areas. User is given the option to receive alerts and notifications on the formation of the blocks. The tool has the ability to become an essential part of a technical trading system or even pure price action trading. Usage:- An essential tool for price action or technical traders. More information in the blog
Trading Strategy The Leicester expert advisors uses three exponential moving averages to determine entry positions. Trend Line Slow Moving Average Fast Moving Average Crossovers between the fast moving average and the slow moving average will create sell signals. If prices are below the trend line then only sell positions will be opened. Vice versa for when prices are above the trend line, only buy positions will be opened. Inputs/Features
Candles after cross - Number of candles to wait before o
Dark Gold is a fully automatic Expert Advisor for Scalping Trading on Gold , Bitcoin , Eurusd and Gbpusd. This Expert Advisor needs attention, in fact presents highly customizable. Dark Gold is based on Dark Support Resistance mt5 indicator (owning it is not necessary) , these Trades can be manage with some strategies. If you Buy this Expert Advisor you can write a feedback at market and get Dark Support Resistance indicator for Free , for More info contact me The basic strate

SemiAuto Martin System
介绍
这个工具用于半自动马丁交易,点击面板下单由EA进行仓位的管理 只需决定交易的方向,其它都交给EA管理 自动马丁,按照设定的网格加仓,也可以禁用这一功能 一键平仓 一键锁单功能 时间控制 预警声音提示 特性
交易图表:任意 可交易的货币:任意 自动止盈平仓 可以用于回测 清晰的面板显示
参数
主要设置参数 LogLevel = LOG_LEVEL_INFO; //写日志的级别 UseAutoMagic = true; //是否使用魔法数 MagicNumber = 6; //设置魔法数 0-2000 Lots = 0.01; //初始交易量 UseMartin = true; //是否使用马丁功能 Booster = 1.7; //加仓的倍数 NetGap
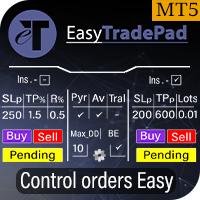
EasyTradePad – MetaTrader 5 交易面板 EasyTradePad 是一款用于手动和半自动交易的工具。该面板可帮助您快速管理订单和持仓,并可一键计算风险管理参数。 面板功能: 按预设的风险比例(% 或账户货币)开仓和平仓 设置止损(SL)和止盈(TP):以点数、百分比或金额表示 自动计算风险回报比(Risk-to-Reward Ratio) 将止损移动至无损位置(保本) 部分平仓 移动止损(Trailing Stop):按点数或K线影线 加仓与均价操作 修改已开仓订单的参数 额外功能: 金字塔加仓
随着价格朝向预设止盈方向运行,分批加仓。每次新加仓可设置减少风险。加仓次数可灵活设置。 均价操作
在图表上手动选择加仓位置,最终按平均价格平仓。 无损转移
当价格达到设定的利润距离后,止损自动移动到开仓价。考虑点差和掉期。 移动止损
支持两种模式: 按点数(可设置启动点数、距离和步长) 按K线影线(可选时间周期) 核心设计理念: 简单易懂的下单方式 高效直观的操作界面 实盘交易中的稳定性与可靠性 您可通过产品页面提供的 演示版本 体验全部功能。
更多信息和支持
MT5 的 Expert Advisor 风险管理器是一个非常重要的程序,我认为对每个交易者来说都是必要的程序。
使用此 EA 交易,您将能够控制您交易账户中的风险。风险和利润控制可以以货币形式和百分比形式进行。
要让智能交易系统工作,只需将其附加到货币对图表并以存款货币或当前余额的百分比设置可接受的风险值。 PROMO BUY 1 GET 2 FREE - https://www.mql5.com/en/blogs/post/754725
顾问功能
该风险经理将帮助您控制风险:
- 交易 - 每天 - 一个星期 - 一个月
你也可以控制
1) 交易时允许的最大手数 2) 每天最大订单数 3) 每天最大利润 4) 设置 Equity 的获利了结
不仅如此,如果您在设置中指定自动设置,顾问还可以为您设置默认的止损和止盈。
顾问会在每个事件中附上警报,并向您解释删除订单的原因。比如你开了,你开了第6个订单,按照你的规则你每天只允许开5个订单,顾问会立即删除6个并说明原因。
例如,您开仓的手数比您最初向自己指示的手数大,顾问将删除订单并解释原因。例如,您每天赚取 5

EA 的策略基于波段交易,在 iPump 指标计算的急剧脉冲之后入场。 如前所述,EA 能够在自动支持下进行手动交易。 - 对于下降趋势 ↓ 我们在价格修正上涨后进入交易,资产进入超买区域,我们沿着趋势卖出。 - 对于上升趋势 ↑,我们在价格回调后进入交易,资产跌入超卖区域,我们顺势买入。 交易所选资产时,顾问会考虑趋势并仅根据当前趋势开仓,无利可图的交易可以通过止损和平均来关闭,第二种选择当然更有利可图但风险也更大 好处 内置电平指示器,用于分析不同 TF 的电平 能够在图表上手动选择平均水平 开多个金字塔订单,利润倍增的能力(订单数量可自行控制) 根据 iPump 指标的反向信号,设置 TP 的更多标准 使用“手”模式手动打开交易的能力 所有趋势策略都基于简单且非常正确的逻辑,即: 在当前趋势中开启交易 价格调整后开仓 考虑交易水平 在这个顾问中观察到所有三个假设。 确定 2 个时间范围的趋势,在价格超买/超卖的最有利时刻进入交易,图表上可以看到修正水平 SL 和 TP。 解释策略 - 对于下降趋势 ↓ 我们在修正价格上涨后进入交易,资产跌入超买区域,我们沿着趋势卖出。 -
此筛选器可让您识别在选定时间段(时间范围)内超出通常超买(增长百分比)或超卖(下降百分比)的资产。 市场受法律支配,买得便宜,卖得贵,但如果没有自动扫描仪,您将很难识别比平时更超买或超卖的货币/股票,例如,在本周内,或当前小时或月份。 仪器可能有几十个或几百个,有时只是物理上可能没有时间手动分析所有东西,这些问题可以使用 Screener 轻松解决 筛选器可以做什么 扫描仪可用于任何 TF 扫描仪适用于货币、股票、加密货币、商品、指数和其他工具 识别资产的逻辑是通用的,因为它基于市场的基本规律 在筛选器的帮助下,您可以根据不同的策略进行工作,最常见的一种是 Pump 和 Dump 揭示每种工具的平均值 - SoftimoTrade Screener 不仅可以确定所选 TF 上资产的超买和超卖情况,还可以计算所选时间段内价格变化的平均值。 此外,所有当前增长率或下降率高于平常的工具都被标为红色,之后可以单独打开所选工具并进行更详细的分析。 使用筛选器的策略变体 对于超买资产↓表,我们正在寻找当前超买指数高于平常的资产,转到图表,更详细地分析资产,如果我们看到一个有趣的切入点,则沿着趋势
策略逻辑 Pump and Dump for mt5 Expert Advisor 是由交易者为交易者创建的全自动交易顾问。 策略是“买得便宜,卖得贵”。在价格大幅上涨/下跌后开立订单。 Pump and Dump 策略的基本含义是在价格下跌时以更低的价格买入资产,在价格上涨时以更高的价格卖出。 您可能已经注意到,在市场价格剧烈波动后,会出现反方向的显着价格回滚,即绘制所谓的“发夹”,EA 抓住价格强劲增长或下跌的时刻,并根据这些信号。我在视频和屏幕截图中进行了更详细的解释。
顾问的策略基于一种算法,该算法基于使用 iPump 指标对价格变化百分比的分析来识别资产的超买和超卖区域,该指标评估资产的超买/超卖水平,并在此基础上识别资产的超买和超卖区域交易工具的最佳买入/卖出区域,然后进入市场。 购买后,给我留言,我将帮助您进行最佳设置和设置。
好处 内建的风险管理机制,让您初步设定账户最大允许回撤水平,就能及时停止交易,节省资金。 控制交易停止时间。在超出风险管理范围的情况下,EA 可以在预定的时间间隔内暂停交易。为便于控制,事件信号将使用推送通知直接发送到您的手机。 订单利润倍增
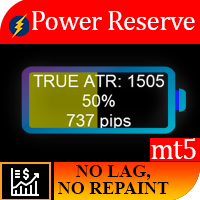
工作逻辑 该指标的重要性在于它可以让您了解“仪器上还剩下多少燃料”。想象一下这样的情况,你留在一辆半放电的汽车里,平均来说,这个能量通常足够一辆汽车行驶250公里,所以如果你愿意,你无法克服700公里的距离。因此,对于每种工具,每天都有一定的价格变动,并且作为统计观察的结果,显示资产每天通过 1 ATR 的情况有 95%,而每天通过 2 个或更多 ATR 的情况只有 5%。
例如,每日 ATR EURUSD = 682 点。您进入交易,例如突破 500 点 TP 的水平,似乎您设置了正确的 TP 大小,但您没有考虑到资产已经超过了其每日 ATR 的 90%交易开始的时间,因此,该工具很可能没有足够的能量来接收你的 TP,如果你看到该工具只剩下 10% 的电量,你很可能要么调整 TP,要么根本不参与交易。
动力储备指示器计算仪器用完惯性的百分比和点数以及剩余多少。
指示器本身以电池充电指示器的形式制成,我们习惯于在电子设备中看到它。 Recommended Robot Scalper - https://www.mql5.com/en/market/product/77108

加密金刚:下一代加密货币自动交易系统 加密金刚(Crypto Kong) —— 专为加密市场打造的超强 EA,适配 MetaTrader 5 集顶尖技术指标 + 智能风控于一身,真正实现 24/7 全自动替你交易! 详细资料 MQL5 官方博客文章:《 加密金刚来袭:开启你的智能加密交易之路 》 视频教学: https://youtu.be/aQLU2TpFxzM 核心亮点与交易逻辑 默认完美优化 BTCUSD H4 (中线策略) 进场:多重指标精准组合过滤 出场:基于 ATR 波动率智能计算 追踪止损 + 保本机制,全系数可调 周末自动休眠(周五 22:30 关,周日 05:30 开),完美避开流动性缺口 真的能赚钱吗? 只有实盘数据会说实话。 直接看 MQL5 文章里的信号链接,如果曲线让你心动,那就入手吧。 超灵活参数,任何行情都能适配 固定手数或按余额比例 止盈默认 5.0×ATR,止损默认 4.0×ATR 追踪止损、保本全可调 支持只多、只空或双向交易 极端波动时把止损系数调到 6.0–7.0,扛得住任何插针 正确启动加密金刚的 4 步 安装 → 直接拖到 BTCUSD H4

工作逻辑
Dow Strategy Expert Advisor 是基于 Chalse Dow 的“趋势保持”理论的智能交易系统。
EA 使用选定的 TF,如果前一根柱线上升,则意味着它将打开买入并在前一根蜡烛线的低点后面设置止损(可以设置过滤器以抵消前一根蜡烛线的偏移),然后在当前蜡烛关闭后,止损将再次移动到最低点之外,因此交易将在市场中保持,直到它不会被击倒。
非常适合交易中/长期趋势工具。在开始交易之前,需要对工具进行独立分析以了解趋势的存在。非常适合在从 m1-MN 的所有时间范围内按柱线追踪头寸。
对于交易,股票、货币、金属、指数是合适的——一般来说——大多数有中期趋势的金融资产。
推荐的时间范围是 D1。
在价格方向突破前一根柱线的高/低后开仓。
止损设置在烛台的前一个峰值之后。
交易逻辑取自 Charles Doe 的趋势保持理论。
使用此 EA 的目的是通过不使用固定止盈来最大化盈利交易。
账户类型:净额结算、对冲。
不使用鞅,平均,网格。
交易建议:
要使用“EA 交易”,您必须首先选择您认为具有潜在长期下降趋势或上升趋势的工具。例如,有前

iPump 指标是一种多功能指标, 结合了三类指标的优点。
多个 TF 上的同时趋势检测 定义阻力和支撑区域 确定超买和超卖区域 指标功能: 定义趋势 对于希望客观评估当前市场方向并避免主观性的所有交易者来说,此功能将是必需的。在一瞬间,您将能够在最重要的时间范围内比较趋势的方向,这将变得清晰直观。 确定支撑位和阻力位 使用 iPump 指标,您将能够在几秒钟内评估资产的潜在价格障碍。
而且该指标会告诉您您面前的级别是什么类型: 测试水平(阻力/支撑) 反转水平 弱水平 未测试级别 确定超买和超卖区域 对于此任务,该指标具有非滞后和非重绘信号振荡器,显示资产的当前状态,基于此数据,您可以:
确切地知道哪些区域何时值得购买 什么时候出售资产会很有趣的区域 振荡器优势: 独特的计算算法 该算法实际上能够帮助我和我的同事以及我的同事进行交易,该算法用于 Pump and Dump Expert Advisor。 无需重绘 当超卖或超买价格高于平常时,该指标将准确显示信号。这将使您能够及时就开仓的可取性做出决定 毫不拖延 该指标每秒处理有关价格状态的报价的传入数据,这使交易者可以随时

Utility MTI (Main Trading Info) - 顯示交易者的基本交易信息,即:
點差的平均和當前大小 空頭和多頭頭寸的掉期大小 1 個交易手的 1 個點的成本 止損位大小(放置掛單的最小距離) 當前(紅色)結束前的時間和下一個(灰色)交易時段開始前的時間 距離當前交易時段結束的時間顯示為紅色,距離下一個交易時段開始的時間顯示為灰色。顏色可以在指標屬性中獨立調整。 Recommended Robot Scalper - https://www.mql5.com/en/market/product/77108
顯示通過以下方式執行:
歐洲交易時段(歐盟旗幟) 美國交易時段(美國國旗) Pacific Trading(澳大利亞國旗) 亞洲交易時段(日本國旗) 了解交易時段的結束時間和變化很重要,因為在交易時段結束時,許多交易者固定他們的頭寸,這可能導致趨勢變化,從而導致頭寸逆轉。
變量
Time On - 當前交易時段的顏色選擇
休息時間 - 選擇下一個會話開始前的時間顏色
平均點差 - 計算平均點差所涉及的最後一次報價的數量。
Swap Di
FREE

该面板具有每个初学者都可以处理的最直观的界面。
在 SLp 列中 - 您需要以点子为单位指定 SL 大小。如果该值变为灰色,同时 Bay / Sell 按钮也处于非活动状态,则您指定的 SL 值小于经纪商设置之前允许的值。
在 TP% 列中 - 您以帐户余额的百分比表示 TP。在设置中,您可以根据此指标的计算方式选择净值、余额或可用保证金。
在 R% 栏中,您可以设置交易的风险值。
插入按钮。 - 允许您立即使用设置的值打开订单,如果禁用,则您可以直接在图表上预设交易参数。
在顶部,您可以通过单击左上角的减号来最小化图表上的面板。 Pro Trading Panel - https://www.mql5.com/en/market/product/72256
还可以通过调整面板名称下方的 + 和 - 按钮来增加或减少面板本身的大小。
如果您还想开挂单和转移到BU,追踪止损,保存开单的各种设置,支持各种技术的定单,那么考虑一个功能更强大的EasyTradePad面板,您可以在我的产品中找到它。
FREE

你想要一个带有小止损的EA吗? 你想要一个刚刚进出市场的EA吗?
这个EA正在突破dax(德国指数)或道琼斯。 它只在市场开盘时买入,并在10分钟或更短的时间内买入。
这种策略(是的,它是2种不同的策略,可以与3种不同的图表一起使用)具有紧密的止损和一个获利,通常会在几秒钟内达到!
这些策略得到了很好的证明。 我手动使用它们多年,效果很好。 设置文件可以在我使用的设置的评论部分下找到(如果您随着时间的推移找到更好的东西,请随时更改TP或SL)
这个EA的特点
它每天只需要一个交易和策略(有时没有交易) 在所有交易上使用TP和SL(内置于EA中,因为SL和TP很紧) 买入和卖出止损订单的可能使用 没有鞅 没有对冲 无套利 没有多重交易
促销价格:$50. 2买左,价格上涨至$100。 最终价格:$499 时间:1分钟
符号:DAX(Strat1&2)和Dow Jones(strat3)
如何设置EA
快速设置 策略1-设置文件 策略2-设置文件 策略3-设置文件 请注意将TP和SL设置为正确的值;取决于您的经纪人有多少小数!
手动设置 每个图表只使用一
EA 按时打开和关闭新订单。它可用于通过创建任务列表来实现任何复杂性的交易场景。 完成任务有两种选择 任务在指定的日期和时间执行 - 它执行一次并从列表中删除。 任务在指定的星期几和时间重复执行 - 重复的任务不会从列表中删除。 面板设置 Symbol - 选择交易功能的交易品种。 Time - 交易函数执行的日期和时间。输入格式:日期和时间“yyyy.mm.dd hh:mi:ss”或时间“hh:mi:ss”。 Trade - 贸易功能列表。 Lot - 交易量。 Price - 挂单的开盘价。 Stop Loss - 以点为单位设置止损订单的距离。 0 - 禁用。 Take Profit - 以点为单位放置止盈订单的距离。 0 - 禁用。 Repeat - 按星期几重复。 Add - 添加到列表中。 交易功能: Buy, Buy Stop, Buy Limit, Sell, Sell Stop, Sell Limit. 关闭功能 Close Buy - 关闭所有买入交易。 Close Sell - 关闭所有卖出交易。 Close Buy/Sell -
The Martinware Eye Rest Reminder serves to periodically remind traders to rest their eyes without the need for a tool outside MT5.
Input parameters: Periodicity: play the alert every n minutes Alert with sound: define if the alert should include playing a sound Custom sound file: name of the custom sound file to be used instead of the default. It must be inside a folder named "Sounds", this one inside the "Files" folder in the Terminal's MQL5 directory tree. Alert with Alert message: informs
FREE
If you are looking for a safe ea to start trading in index this is your ea
This ea performs a market entry that starts the algorithm at the time of day that the trader decides. We recommend it to be 1 min after the opening of the index.
It also allows you to say close the operation at the close of the session or keep the cycle open.
It only performs a daily cycle that starts at the scheduled time and remains alive until it exits for profit or session close.
This system is designed to be used
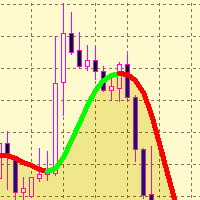
The SMTrendLine indicator is based on the principles of graphical construction of Bollinger bands.
Graphically, the Bollinger is two lines that limit the price dynamics from above and from below, respectively. These are a kind of support and resistance lines, which most of the time are located at levels far from the price.
As we know, the Bollinger bands are similar to the envelopes of moving averages. The difference between them is that the envelope boundaries are located above and below the
FREE
Иногда бывает, что наши построения на графике выходят за пределы последнего бара. После выходных, эти построения могут измениться в виду особенностей учета времени в мт5. Данный индикатор поможет решить эту проблему - он проходит по всем графикам и сдвигает дату объекта, которая дальше, чем нулевой бар. После завершения работы индикатор удаляется. Параметры:
Direction - направление сдвига; DaysShift - количество дней, на которые сдвигается дата объекта, правее нулевого бара.
FREE
GannRS Trend Scalper GannRS is an advanced trading tool based on Gann Law and Supports and Resistances. designed to have an active trading at any time not lagging Indications are given at the beginning of a new candle
Please watch the full tutorial video.
How to use GannRS Very easy to set up... Put it on your chart Adjust inputs
Inputs Show Resistance and support : [bool] true = Shows R/S on chart false = does not show Show Levels :[bool] true = Shows levels on the chart false = does n
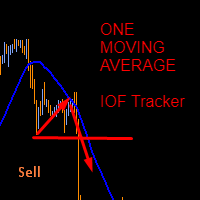
This indicator was created based on posts from forex factory thread titled There is no Magic Moving Average - You need only one - by @andose2 a.k.a Andrei Florin. If you want to know about how to use this trading strategy please go and read https://www.forexfactory.com/thread/691864-there-is-no-magic-moving-average-you.
Note: Below are extracts some of the posts .
Estabilish a trend, based on Market Cycles, then go only long in the Markup Phase and only short in the Decline phase , st
FREE

Imagine what results you could achieve in your manual trading if you had a tool that notifies you of a possible price reversal for all the symbols you are interested in at the same time (futures, stocks, forex or cryptocurrency)?
VSA screener is just the right tool. It was created for traders who value their time and make their own trading decisions on opening or closing a position. The software monitors the presence of trading patterns on the preselected tickers under several timeframes (up to
FREE
Robot functions: 1. TP and SL 2. TSL 3. BE 4. Working time selection function 5. Disconnection of the robot's work after obtaining a given profit or loss. A robot designed to trade on all currency pairs, cryptocurrencies and synthetic indices. Works on any time frame. Tests have shown its great effectiveness in action. If you need more information about the robot, visit my YT channel and use the Telegram messenger: @Mati_FX
MT4 indicator version https://www.mql5.com/en/market/product/72342
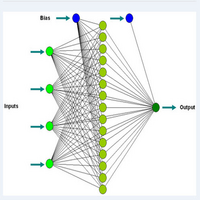
I personally use this indicator to scalp. Accurate for accessing extremes and supports for buy positions primarily for 1 minute time frames. Other time frames can be used but the levels are different. Its a better oscillator and compare with others to see the difference. Day trade using neuro network concepts. This indicator uses elementary forms of neuro networks to generate signals to buy and sell. Use the indicato
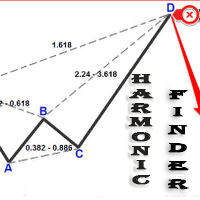
Automatically finding harmonic patterns has been made easy for traders. For those who do not know harmonic patterns : it is a method of technical analysis based on Fibonacci ratios in the markets and patterns made of these. Kind of like patterns such as triangles and double tops, but with precise measurements which makes computerized measuring tools especially appealing for trading these patterns. Some highlights from this Indicator include: Efforts to reduce the amount of screen clutter thro

Hi there! Since I am starting commercial and non-commercial product publishing I would highly appreciate: If you like this product, please rate it. That will help to promote not only this product, but indirectly another ones. So, such promotion will help to make some money from commercial products. Thus, I will have opportunity to fund my another directions of trading researches like bot development using mql4 and mql5 programming languages as well as python written products like crypto bots. If
FREE
GIVE A LOOK TO MY OTHER PRODUCTS ! 100 % PER MONTH PROFIT----CONTACT ME FOR MORE INFO !
What Is the Average True Range (ATR)? The average true range (ATR) is a technical analysis indicator, introduced by market technician J. Welles Wilder Jr. in his book New Concepts in Technical Trading Systems, that measures market volatility by decomposing the entire range of an asset price for that period. The true range indicator is taken as the greatest of the following: current high less the cur
FREE

This DYJ OonClickClose help you to close all orders having profit immediately with only ONE CLICK, its work is very fast. You can choose which symbol you want or close all symbols so it will helpful for you in your trading to manage trading faster. This EA can quick close all Buy and Sell Orders by a selected symbol or total, And delete all pending orders. It includes dynamic target profit tracking function. The software has manual transaction buttons buy and sell. It is a management softw
MetaTrader市场是 出售自动交易和技术指标的最好地方。
您只需要以一个有吸引力的设计和良好的描述为MetaTrader平台开发应用程序。我们将为您解释如何在市场发布您的产品将它提供给数以百万计的MetaTrader用户。
