 MetaTrader 5
 エキスパート
 インディケータ
 ライブラリ
 ユーティリティ
 ウィジェット
 ルール
YouTubeにあるマーケットチュートリアルビデオをご覧ください
ロボットや指標を購入する
仮想ホスティングで
EAを実行
EAを実行
ロボットや指標を購入前にテストする
マーケットで収入を得る
販売のためにプロダクトをプレゼンテーションする方法
MetaTrader 5のための新しいエキスパートアドバイザーとインディケータ - 504
 自動売買ロボットとインジケータを使用して、外国為替取引の収益性を高めます。 自動売買ロボットを使用すると、取引の開始と終了を自動化でき、インジケータは市場の行動をより正確に予測するのに役立ちます。
このページには、MetaTrader5アプリケーションのカタログが掲載されています。

with JR Trend you will able to enter and exit every trade with just a signals appear no need for any strategy just flow the indicator it work on all pairs and all Timeframe i usually take a look on higher timeframe and return to the lowest timeframe and make an order with indicator signals you can see the amazing result so you can depend only on it intraday or swing as you wish
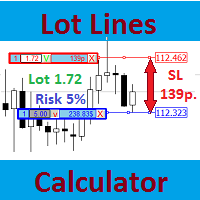
Большинство профессиональных трейдеров декларируют строгое соблюдение управления рисками. Этот простой инструмент разработан для быстрого расчета размера лота, чтобы торговать в соответствии со следующими базовыми правилами риск-менеджмента: Максимально допустимый риск устанавливается как фиксированный процент от общего количества средств на счете (например, 1-2%). Риск измеряется расстоянием в пунктах между открытием ордера и установленным стоп-лоссом. Так как для новичков всегда затруднительно
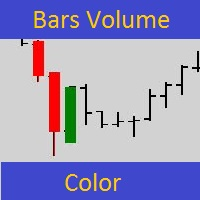
Все знают какую большую роль играют объемы в трейдинге. Основной индикатор объемов чаще всего находится в дополнительном окне и визуально плохо воспринимается. Этот простой инструмент разработан для быстрого и наглядного представления заданного объема непосредственно на графике с котировками для лучшей наглядности. Можно сразу оценить в каких местах на графике сконцентрировались большие объемы. Индикатор подкрашивает свечи по заданному объему от хая или лоу свечи до цены закрытия свечи. Если све

Use for EURUSD H1 is very good for low drawdown and high profit. Can use original data for trade if you want high profit you can adjust new data and test before run. Can run it minimum capital 500 USD but you increase capital you can safe very good for port. We recommend that you run it on port standard not run on port raw spread because your profit will decrease. If you run port on swap free is very good for you.

Entry Point EA 10 copies out of 10 left at $799 Next price --> $1467 Entry Point EA is the advanced scalping system which utilizes smart entry/exit algorithms with sophisticated filtering methods to identify only the safest entry points during calm periods of the market. This system is focused on a long-term stable growth. It is a professional tool developed by me years ago that is constantly updated, incorporating all the latest innovations in the trading area. Nothing fancy here, no testi

Moving Average Convergence/Divergence — схождение/расхождение скользящих средних — технический индикатор, разработанный Джеральдом Аппелем (Gerald Appel), используемый в техническом анализе для проверки силы и направления тренда, а также определения разворотных точек. Встроенный в MetaTrader 5 индикатор MACD не соответствует задумке автора (Gerald Appel):
-линия MACD графически изображена в виде гистограммы, однако гистограммой отражается разница между линией MACD и сигнальной линией;
-сигнальн
FREE

We use Price Action and Japanese Candlesticks at important price zones and standard times to open positions and use Risk/Reward: 1/2 - 0.2%/trade. Recommended symbol: EURUSD, GBPUSD, AUDUSD, USDCAD, USDJPY, GBPJPY, EURJPY. Contact me: Gmail: fifund.cuscare@gmail.com, Facebook , Twitter , Instagram . Product: Metatrader4 , Metatrader5 . Broker references: Exness , ICMarket , FBS .
FREE

Little Swinger (Best choice for passive income lovers)
Developed by RobotechTrading key features:
Financial Freedom Back testing results will match with real live trading results Proper TP and SL Controlled Risk Highly Optimized settings Running on our Real Live Accounts Little Risk, Little Drawdown, Little Stress, Little BUT stable income, just set and forget. Strategy:
Not Indicator based No Martingale No Grid No Repaint strategy Safe and Secure calculation of Live data and than take
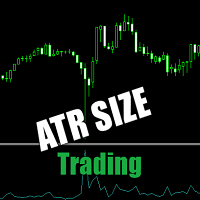
EA uses the value of the ATR indicator as a decision to open a trade, very useful to trade in the first moment of a big movement, because the ATR indicator is able to track the size of the movements in the period chosen by the user. The user includes the period of the indidacor ATR and the value/size that it is of interest to open a trade, the operation will take place in same direction of the signal candle.
EA utiliza o valor do indicador ATR como decisão para abrir uma operação, muito útil p

Binance Future用のMt5ボット(エキスパート)
システムはBinanceFuture市場で稼働しています。
独自のコードに簡単に統合して、操作を自動化できます。
手動操作パネルが利用可能です。
ヘッジmod互換。
すべての操作は画面から手動で行うことができます。
これは、同時に多くの暗号通貨を制御するための最も効果的な方法です。
画面はバイナンス画面のテンプレートタイプです。 リンクからテンプレートファイルをダウンロードできます。
https://drive.google.com/file/d/1WHqGhym0QIK31l7kwfit9_tXb7YbqSuT/view?usp=sharing
このプログラムはインストールが必要です。
https://www.mql5.com/tr/market/product/68694
https://www.mql5.com/tr/market/product/73887
パラメーター
APIキー=バイナンスAPIキー
シークレットキー=バイナンスシークレットキー
* [ツール]メニュー>>
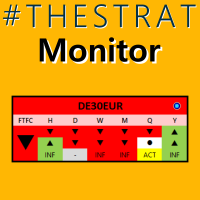
ストラトの取引戦略 についてまだ学んでいない場合は、今すぐグーグルで検索してください。時間を無駄にしないことを約束します。使用するかどうかに関係なく、いくつかの新しいトリックを学ぶことができます。 OK、これで TheStrat とは何かがわかったので、このインジケーターが何をしてくれるかを理解できるようになります。 主な機能
つまり、インジケーターは次のことを行います。 サポートされているすべての時間枠の時間枠の連続性を表示 デイトレーダーとスイングトレーダーの2つのタイムセットビューをサポート 連続する 4 つの時間枠で完全な時間枠の継続性が適用されている場合に表示します 各時間枠の現在のろうそくの状態を表示します すべての時間枠で現在のパターンがあれば表示します 有効なパターンと実行可能なパターンの両方を表示 5 秒ごとに更新 (1 秒から設定可能) パネルをクリックして、選択した銘柄と時間枠のチャートを開くことができます チャートを開くために使用するチャート テンプレートを選択できます 表示するグループとそのグループ内のシンボルを選択します インジケーターは、ブローカーがサポ

作業ロジック
ストップアウトユーティリティは、ストップアウトレベルまで残っているポイント数を示すシンプルですが非常に便利なインジケーターです。
その利点は、多くのトレーダーが利益を追求して取引する際のリスクを故意に過大評価し、利用可能なマージンを最大限に使用するという事実にあります。この場合、ブローカーがあなたのポジションを強制的に閉じることができる場所を知ることは非常に重要です。
チャートにインジケーターを配置するだけで、買いまたは売りのオープンポジションに応じて、チャート上にこの取引の価格の境界マークが表示されます。
ポジションを開くまで、ラインはチャートに表示されません。
チャートに線が表示されない場合、これはユーティリティが機能しないことを意味するものではなく、おそらく取引のリスクが最小限であり、預金が大きい場合は、ストップアウトラインをはるかに高く探す必要があります/現在のリスクではストップアウトから遠く離れているため、トレードよりも低くなります。
ご不明な点がございましたら、ディスカッションセクションにご記入ください。幸せな取引。 Recommended Ro
FREE
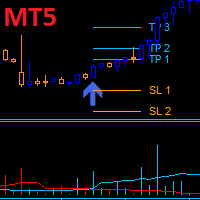
Dark Power is an Indicator for intraday trading. This Indicator is based on Trend Following strategy, also adopting the use of an histogram to determine the right power . We can enter in good price with this Indicator, in order to follow the strong trend on the current instrument. The histogram is calculated based on the size of the bars and two moving averages calculated on the histogram determine the direction of the signal
Key benefits
Easily visible take profit/stop loss lines Intui
[ MT4 Version ] DoIt Order Blocks - Multi-Timeframe Order Block Indicator for MT5 Most multi-timeframe order block indicators for MT5 give you two bad options: keep switching between charts or display so many rectangles that none of them feels important. DoIt Order Blocks detects bullish and bearish zones from up to four timeframes on one chart. It tells you which timeframes are active and when price is touching one of their blocks, so you can stop searching and start waiting for price to reach

1. What is this. This is a very rigorous indicator to show different market trading sessions. It shows the main markets: NewYork, London, Frankfurt, Sydney, Wellington, Tokyo. Very important: Different markets have different start and end dates for daylight saving time, and the trading session of a market can vary depending on daylight saving time and winter time. Also, the daylight saving time system is different for countries in the northern hemisphere and southern

The multi-currency indicator Currency Strength Index Plus can be set on the chart of any of the 28 currency pairs formed by 8 currencies (USD, EUR, GBP, AUD, NZD, CAD, CHF and JPY), for example, on EURUSD, H1. The indicator is designed to determine the direction of strength of each of the 8 currencies relative to each other. Using the strength and its direction of two opposing currencies, it is possible to make a currency pair with the best trading potential. Currency indices have flexible smoot

1. What is this. This is a very rigorous indicator to show different market trading sessions. It shows the main markets: NewYork, London, Frankfurt, Sydney, Wellington, Tokyo. Very important: Different markets have different start and end dates for daylight saving time, and the trading session of a market can vary depending on daylight saving time and winter time. Also, the daylight saving time system is different for countries in the northern hemisphere and southern hemisphe

The Asian Session - it is a Secure Automated Software for trade Forex market and indices.
This system detects the ranges between the end of the American session and the beginning of the Asian session, operating in favor of the break, thinking that this break prior to the start of the session occurs because within the Asian session there will be an impulse in favor of the break. breaking off. To adapt to the different schedules of the different brokers, you have to set the closing time of the Am
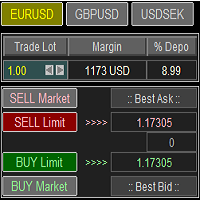
Trade Panel with Loss Breaking for MT5
Multi-instrumental trading panel with the function of transferring the stop loss of positions to loss breaking.
Has the following distinctive properties:
All trading parameters and panel operation are set in the settings. The traded position volume (lot size) is quickly changed. The required margin and the percentage of the required margin of the current deposit for the specified lot size are displayed. Shows profit when take profit is triggered and losses

Sprocket is an Expert Advisor that implements the scalping principle. A minimum spread is required for correct operation. What is a prerequisite.
There is an opinion that scalping is the lot of beginners. But in fact, it is wrong. In order to conduct a trading operation correctly for himself, a trader needs to learn scalping, otherwise the result may be negative. That is why this bot exists to be an assistant to the trader.
By placing currency fluctuations on time charts with timeframes for 1
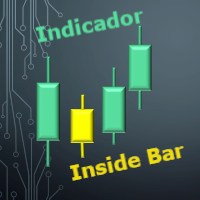
Identificador de Inside Bar O Inside Bar é uma formação de vela de reversão / continuação, e é um dos padrões de Candle mais operados pelos trader. Esse indicador permite que você identifique um O Inside Bar no gráfico de forma rápida e fácil, lhe permitindo uma tomada de decisão muito rápida e precisa. Sendo ideal para lhe ajudar nas suas diversas estratégias de Day Trade ou swing trade. O visual e a marca registrada da análise gráfica por esse motivo esse indicador conta com 3 opções visuais p
This indicator shows the breakeven line level for the total number of open positions of the current symbol with P/L value and total volume. This indicator is helpful to decide the exit level when using a trading grid strategy. The style of the breakeven line is customizable to choose the color, line shape and font size of the positions description. Send mobile notification when crossing a positive P/L target
FREE

Less is more. Find the strongest trends! This expert scans ALL currency pairs for a strong trend combined with a breakout.
Requirements for a trend report: 1. Up-trend or down-trend must be found in all of the following timeframes (D, H4, H1, M30) 2. Breakout in the daily timeframe (the upper or lower band of the Bollinger band must be broken)
The correctness of the trend is confirmed to 90%
FREE

Bundles — Three Indicators, One Smart Grid
Bundles brings three of our tools together — the Channels, Supply & Demand and Trend indicators — into a single multi-directional system. It's a smarter take on the grid: instead of blindly adding trades, it waits for confirmation in supply and demand zones before it acts.
What it does for you Three engines in one: Channels, Supply & Demand and Trend, working together. Multi-directional grid: not the usual martingale — a structured, confirmation-based
FREE

Santa Trend Indicator is an efficient way to forecast and detect the trend in any market. Advantages Generates instant buy and sell signals. Provides an alternate exit strategy to your existing trading system. Never repaints, never backpaints, never recalculates. Works in all symbols and all timeframes. Perfect trend filter for any strategy or expert advisor. Fully compatible with Expert Advisor (EA) development. Does not lag.
FREE

Santa Donchian Indicator is an efficient way to detect support, resistence and break outs in any market.
The Donchian channel measures the high and the low of a previously defined range. Typically, a trader would look for a well-defined range and then wait for the price to break out to either one side for a trade entry trigger. Advantages Never repaints, never backpaints, never recalculates. Works in all symbols and all timeframes. Perfect trend filter for any strategy or expert advisor. Full
FREE

Santa Bollinger Indicator is an efficient way to detect price retracement in any market. A common approach is to identify overbought or oversold market conditions. When the price of the asset breaks below the lower band of the Bollinger Bands, prices have perhaps fallen too much and are due to bounce. On the other hand, when price breaks above the upper band, the market is perhaps overbought and due for a pullback . Advantages Generates instant buy and sell signals. Never repaints, never back
FREE
Reversal candles indicator , use in second window with rsi,levels 10-20-50-80-90 so u can see where the reversal candles pop upat the overbought oversold rsi levels.Great oppertunity to get in early and get out at the best moment. Candle turns blue at the 10-20 level "buy" candle turns red at the 90-80 level "sell" Always look at the major trend beore taking a buy or sell!!!
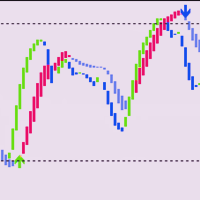
Necessary for traders: tools and indicators Waves automatically calculate indicators, channel trend trading Perfect trend-wave automatic calculation channel calculation , MT4 Perfect trend-wave automatic calculation channel calculation , MT5 Local Trading copying Easy And Fast Copy , MT4 Easy And Fast Copy , MT5 Local Trading copying For DEMO Easy And Fast Copy , MT4 DEMO Easy And Fast Copy , MT5 DEMO
Auxiliary indicators It waits for the hunt, waits for the price limit to appear, waits for a

Moving Wizard indicator will guide you to work with Trend and give pure Entry point depending on crossing on the chart it work on all currency and all Timeframe you can use it daily or scalping or swing its good with all and This indicator you can make it your strategy i work on it on H1 Timframe and make a good money you can take alook on it and you see a great resault on chart .Gold moving is to Know the Trend of price other moving below it mean we looking to sell orders . if above it we loo
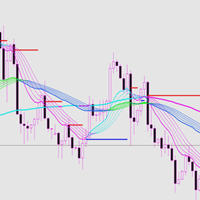
This indicator has good trend malleability and a good trend resistance support line. Index characteristics The color changes, following the trend of different levels . The support and resistance line means that the price follows or reverses.
Basic display A price tag showing historical support and resistance. Shows the approximate recommended range of historical entry positions, as well as take-profit and stop-loss recommendations, and target forecasts. Display the judgment of the current direc

Stair shape EA was created after several years of effort and programming by a strong program team. This expert is a fully automated, multi-currency trading system that doesn't require any special skills from you. Just fire up this EA and rest. You don't need to set up anything, EA will do everything for you. But if there is a problem or you do not know what to do, be sure to let me know. I will help you in the shortest possible time. The expected estimated profitability according to the backte

High and Low
The indicator marks bars with a simple trend definition“ each subsequent high above/below the previous one and each subsequent low above/below the previous one ”. Charles Dow
Formula:
Max – The current maximum Min – The current minimum MaxK – Maximum per period MinK – Minimum per period
Min>MinK & Max>=MaxK – Symbol on top Max<MaxK & Min<=MinK – The symbol on the bottom
Input parameter:
Number of bars in the calculated history Period for current timeframe The distance to th
FREE

Basket EA MT5 は、強力な利益収穫ツールであり、包括的な口座保護システムがシンプルで使いやすい形で統合されたソリューションです。その主な目的は、すべてのポジションを個別管理ではなく“バスケットレベル”で一括管理することで、口座全体の損益を完全にコントロールすることにあります。EAは、テイクプロフィット、ストップロス、ブレイクイーブン、トレーリングストップといったバスケットレベルの機能を備えており、これらを口座残高の%/口座通貨の固定額/管理対象取引の平均ポイントといった形で設定できます。この柔軟性により、トレーダーは個々のリスクと利益戦略を自分に合わせてカスタマイズできます。さらに、 Basket EA MT5 は、Magic Number、通貨ペア、コメントなどに基づいて特定の取引を管理対象から除外または含めるフィルタリング機能を提供し、望む取引だけを管理できるようにします。 追加の保護機能として、高度な口座セーフガード機能を搭載しています。指定したエクイティのテイクプロフィット・ストップロス水準、または最高残高からの最大ドローダウンに達した場合、EAはすべてのオープンポ
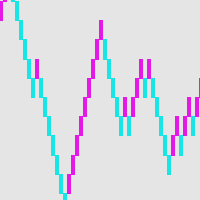
ブリックダイアグラム-別の取引方法 数え切れないほどのチャートのローソク足で混乱しているトレーダー、または線の描き方や支持線と抵抗線の描き方がわからない場合は、現時点で自分に合った別の取引方法を見つける必要があります。NS。ドライバーが繰り返し問題に遭遇した後、完全なオーバーホールのために停止するのと同じように、同じことがトランザクションにも当てはまります。 レンガチャートは、日中のトレーダーに簡単な取引方法を提供します。実際、この方法は川崎汽船と同じ歴史があり、日本でも始まりました。 ブリックチャートを定義するために、それらはセットポイントまたはベーシスポイントの価格トレンドのみを記述します。たとえば、10ポイントのブリックチャートは、価格変動の10ポイントの上昇傾向または10ポイントの下降傾向のみを表すことができます。 ブリックダイアグラムには、価格が時間に関係しないという独自の利点があります。つまり、価格の変化が設定値に達したときにのみ、新しいブリックダイアグラムが表示され、ブリックダイアグラムによって価格のバリが削除されるため、感覚から非常に快適です。

EAは、平均値からの最大価格偏差の原則に基づいて機能します。 価格は常にバランスを保つように努めるという考え方ですが、 そして、平均からの大きな偏差は、相互力-反作用につながります。 入り口はこれらの逸脱で実行されます。 これは、このアドバイザーのためのシグナルの一例です https://www.mql5.com/en/signals/2047087
(希望する場合は、より保守的に取引することができます)。
オプション: sigal_deviation-取引が開始された後の最大偏差。 フィルタ:
closeBarOnly-バーが閉じている場合にのみ機能し、バーが閉じた後にのみ取引を開始および終了します。
waitFastMovement-急速な衰退または下降を待っています。 Nは秒数で、0は無効です。最小値または最大値の形成からN秒が経過した場合にのみ入力します。即時の価格変動中のエントリーを防ぐのに役立ちます。
oneOrderInDay-1日に1つのオープントレードのみ。日中の突然の価格変更のリスクを軽減するのに役立ちます。
onlySwapPlus-正のスワップの方向

Mercurial Position Sizing Trade Manager は、正確なリスク管理、自動ロット計算、高速な注文執行を求めるトレーダー向けに開発された無料の MT5 Expert Advisor です。 この EA は裁量型 Forex トレーダー向けに設計されており、選択したリスク率に基づいて適切なポジションサイズを自動計算することで、感情的な判断や手動計算ミスを削減します。 以下のトレーダーに最適です: Forex トレーダー プロップファームトレーダー スキャルパー スイングトレーダー デイトレーダー Smart Money および Price Action トレーダー 自動ロットサイズ計算機能 以下の条件に基づいて、適切なポジションサイズを即座に計算します: 口座残高 リスク率 ストップロス距離 手動で pip 値を計算する必要はありません。 高度なリスク管理 固定リスク率ベースのリスク配分により、すべての取引で一貫したリスク管理を実現します。 取引資金を保護し、長期的な安定性向上をサポートします。 ワンクリック注文執行 チャート上から直接 BUY / SEL
FREE

Smart Gridder MT5は、RSIおよびボリンジャーバンドに基づいています。最適化された設定を以下に示します。 EAの戦略は、ボリンジャーバンドを横切るろうそくに基づいており、RSIは、買いまたは売りの取引を開始するかどうかを決定する要因になります。グリッドサイズは自動的に計算されます。
最適化された設定:
最小入金額:$ 400セントアカウント
EURUSD-https://drive.google.com/file/d/1BVz5ad8kwgz7NcJCNr0mfQzGurc53u1t/view?usp = sharing GBPUSD - https://drive.google.com/file/d/1HresrpXpbpWPhiCF_GlnVdVszFX6bUwr/view?usp=sharing
設定:
RSI設定
RSI期間
買われ過ぎ
売られ過ぎ
RSIの時間枠
平均グリッド
AGタイムフレーム
スプレッドフィルター
最大スプレッド
時間枠
資金管理
自動ロット1
自動ロット2
最大ロット
乗数
こ

"Elder Ray" or "Ray" indicator is based on the Dr. Alexander Elder's oscillators: Bulls & Bears Power. Both of them works with an EMA. This indicator is used by traders to identify divergence, market directions and more... Dr. Elder's method generally uses a 13-day EMA Period but this can be modified based on your personal demand. The calculations are: Bulls Power= high candle - EMA close Bears Poder= low candle - EMA close Lime line represents Bulls Power and OrangeRed line, shows Bears Power
FREE

Ing (inguz,ingwar) - the 23rd rune of the elder Futhark ᛝ, Unicode+16DD. Add some runic magic to your trading strategies. The correct marking of the daily chart will indicate to you the successful moments for counter-trend trading. Simple to use, has high efficiency in volatile areas. Be careful in lateral movements.
Signals ᛝ are generated when the main lines of construction intersect.
Red arrow down - recommended sales
Blue up arrow - recommended purchases
rare purple arrows indicate exce

GRat Clusters is an indicator that shows various data in the form of clusters on a price chart: volume, delta, ratio of sales and purchases, etc. It allows you to visually see the market profile in real time and on history at a given depth. Capabilities 1.8 types of cluster data: volume, delta, purchases and sales , volume and delta, imbalance between sales and purchases , volume profile, delta profile, buy and sell profile. 2. A cluster period can be either any available in MT5 timeframe or
Moving average, moving average (English Moving average, MA) is a general name for a family of functions, the values of which at each point of determining the level of some average value of the original function for the previous period.
CalcPipsOn - In order to add rozruhunok on the chart, you must activate this field.
The previous development of a variant of this indicator differed in that it had an extended functionality for calculating averaging in the set, as well as advanced possibiliti

Vegas Tunnel, with up to 20 levels, allowing you to plot or not each level with color change, line thickness and ON/OFF visualization for easy use 100% free and lifetime Recommended use for time frames: Original --> H1 Fractals --> M15, M30, H4, D1 and W1 When the black dots are above the tunnel, start short positions. When the black dots are below the tunnel, start long positions. It's important to remember that just because the market breaks the line of lying doesn't mean it's time to enter a
FREE

Expert capable of generating profit by opening positions randomly. Shows good results in long-term trading – on timeframes from H12.
Features Fully automatic mode is available. Positions are opened randomly. Martingale is applied – if the previous position closed with a loss, the current one is opened with a volume that compensates for that loss.
Parameters Mode – Expert's operating mode: Automatic – automated (recommended); Manual – manual. In automatic mode, the Expert does not require any p
FREE

This is an intra day strategy that is simple and resilient for long term use. There are only a few parameters and the entry is triggered by price action, no indicators are needed. The time of entry and exit will affect the performance, defaults can be used for safe and conservative trading. Broker spreads will also affect the returns, because it is intraday, the frequency of trade is once per day per pair. Do try out the backtest and forward test to verify the results. No grid or martingale
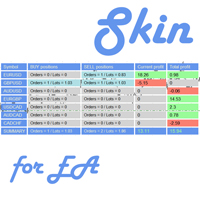
This utility is a graphical shell for other Expert Advisors that do not have their own graphical shell or whose graphical shell you do not like. Just run the utility on a free chart of any currency pair, specify in the input parameters the "Magic Number" of the advisor to which you want to connect the utility, and a graphical shell will appear on the graph, containing information about the traded currency pairs, current positions and trading results of your advisor. If you like this utility, tak
FREE

BLAZING NIGHT SCALPER ALL NEW GRID RECOVERY SYSTEM ADDED
Night scalping using Stop Losses have worked incredibly well in previous years prior to 2022. Blazing Night Scalper was originally tested on more than 10 years of Tick Data using Take profit and Stop Loss with amazing results. As soon as we hit 2022 night scalpers became gradually more difficult to gain profits most likely due to many reason such as brokers increasing spreads and having too many Expert advisors trading during these hours
An indicator of pattern #54 ("Dead cat bounce") from Encyclopedia of Chart Patterns by Thomas N. Bulkowski.
Parameters: Alerts - show alert when an arrow appears Push - send a push notification when an arrow appears (requires configuration in the terminal) PeriodBars - indicator period ArrowType - a symbol from 1 to 17 ArrowVShift - vertical shift of arrows in pixels. Note. Arrows appear on a forming bar and do not disappear.
It cannot be guaranteed that the indicator recognizes the patter
An indicator of pattern #55 ("Dead cat bounce, inverted") from Encyclopedia of Chart Patterns by Thomas N. Bulkowski.
Parameters: Alerts - show alert when an arrow appears Push - send a push notification when an arrow appears (requires configuration in the terminal) PeriodBars - indicator period ArrowType - a symbol from 1 to 17 ArrowVShift - vertical shift of arrows in pixels. Note. Arrows appear on a forming bar and do not disappear. It cannot be guaranteed that the indicator recognizes

The QRSI indicator is one of the most important and well-known indicators used by traders around the world. By its nature, the QRSI indicator is an oscillator, that is, it fluctuates in a certain zone, limited by the maximum (100) and minimum (0) values. Specifically, this indicator works according to an accelerated algorithm, but this is not its only difference. This indicator implements a more advanced calculation based on the Relative Strength Index algorithm. The peculiarity of the implemen
An indicator of patterns #50 and #51 ("Triple Bottoms", "Triple Tops") from Encyclopedia of Chart Patterns by Thomas N. Bulkowski.
Parameters: Alerts - show alert when an arrow appears Push - send a push notification when an arrow appears (requires configuration in the terminal) PeriodBars - indicator period K - an additional parameter that influences the accuracy of pattern shape recognition. The smaller the value is, the smoother the row of peaks/valleys should be, so fewer patterns will be
An indicator of patterns #45 and #46 (Three Falling Peaks and Three Rising Valleys) from Encyclopedia of Chart Patterns by Thomas N. Bulkowski. Parameters: Alerts - show alert when an arrow appears Push - send a push notification when an arrow appears (requires configuration in the terminal) PeriodBars - indicator period K - an additional parameter that influences the accuracy of pattern shape recognition. The smaller the value is, the smoother the row of peaks/valleys should be, so fewer patt
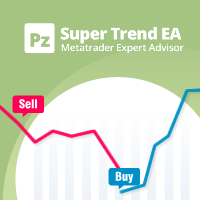
This expert advisor trades using the famous super trend indicator: it is completely loyal to the original algorithm and implements many other useful features for the exigent trader, like customizable trading sessions, multi-timeframe filters and many others. [ Installation Guide | Update Guide | Troubleshooting | FAQ | All Products | Get Help ] Easy to use and supervise Fully configurable indicator settings Customizable break-even, stop-loss, take-profit and trailing-stop settings Works fo
FREE
This expert advisor works on price volatility, it scans the market every single tick trying to find great opportunities for day trading. it has alarms, analisys and much more to provide great trades for you, give it a try.
It is a cross-over alarm which bips when standard deviation goes from low to very high so that you can surf the movement. It is all about volatility and high flow.

MT4/5通用交易库( 一份代码通用4和5 ) #import "K Trade Lib5.ex5" //简单开单 long OrderOpen( int type, double volume, int magic, string symbol= "" , string comment= "" , double opprice= 0 , double sl= 0 , double tp= 0 , int expiration= 0 , bool slsetmode= false , bool tpsetmode= false ); //复杂开单 void SetMagic( int magic, int magic_plus= 0 ); void SetLotsAddMode(int mode=0,double lotsadd=0); long OrderOpenAdvance( int mode, int type, double volume, int step, int magic, string symbol= "" , string comm
FREE

The 7 energies of the price.
it is an expert advisor analyst. it analizes the 7 energies of the price which are:
direction
momentum
fractals
cicles
support/resistance
volatility
Amplitudeness
When you have all these energies aligned you have a better understanding of the price movement.
This EA helps students who are learning technical analisys and it keeps new learners away from the bad trades.
give it a try now for free.
FREE

Killer Market MT5 is an advisor with a system for "Resolving" a basket of unprofitable orders, a news filter, a filter for open positions on other trading instruments and the function of sending trading signals to your Telegram channel.
The Expert Advisor can be used to restore unprofitable positions on the account as a utility to bring trades to breakeven that you opened with your hands or other Expert Advisors.
Works inside a linear regression channel, input on several conditions. The sig
An anchored Vwap With Arrows is an indicator that includes a moving average weighted by volume that allows you to plot on a bottom or a top. Usually banks and institutions measure an average price, this average price is a price range where they agree to make a trade. Using the logic of anchored vwap with arrows it is possible to understand that if the price breaks the vwap it means that someone with enough buying and selling power has lost control. You can use vwap anchored with arrows in any ti
This is the MetaTrader version of the very popular Squeeze Momentum indicator. It is based of of John Carter's TTM Squeeze volatility indicator, as discussed in his book Mastering the Trade. With this version you can enable notifications when a squeeze is released (push notification, email, or pop-up message). Strategie
Grey dots indicates a squeeze in the current timeframe. Blue dots indicates that the squeeze is released. Mr. Carter suggests waiting till the first blue dot after a grey dot an
Horizontal volume bars, Cluster analysis, Volume profile Volume in Range gets information about the accumulated volume in a specified vertical range and period in bars. The received data is then plotted on the chart as rectangular boxes with the volume quantity inside. Usage:- The tool acts as a support resistance levels but most importantly it should be used to check in which direction the price breaks out of the significant levels formed by this indicator and then actions to be taken on correc

Market structures, Market balance, Range breakouts This tools helps to identify areas of market ranges, structures and plots colored boxes on breakout of those areas. User is given the option to receive alerts and notifications on the formation of the blocks. The tool has the ability to become an essential part of a technical trading system or even pure price action trading. Usage:- An essential tool for price action or technical traders. More information in the blog

Adapted from the award winning international best seller (Short Term Strategies That Work) by Larry Connors and Cesar Alverez in 2008, this concept was retested 10 years after the book published and that will give you an idea of the concept if it still works. Take the last 10 years as walk forward and this strategy is added with a twist to risk management with arbitrary 5% stop loss and exit day counted as calender days instead of trading day. This EA works on dual mode, Long and Short. Origin

Open Risk Profit shows your current risk or possible profit of all open positions. Total open risk is your loss if all positions run into the stop loss.
Total open profit is your profit if all positions reach your take profit.
Total float is your current profit or loss of all positions. The program also breaks down the information into the individual symbols. For example, you can monitor how much is your current profit and your potential risk in EURUSD, no matter how many individual positions
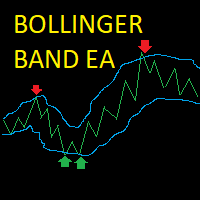
Bollinger Band Scalper EA This EA opens trades when the price hits and bounces off the Bollinger Bands, it closes the trade when it reaches the opposite Bollinger band or if the price reverses into the trailing stoploss. Posisitions are sized dynamically depending on the user's account balance. The EA waits for the price to cross the Bollinger Band and then opens a market order at a set percentage of the bandwidth from the band chosen by the user. The position is sized a percentage of the user's
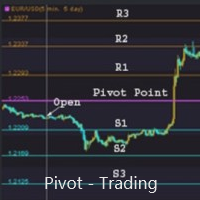
支点交易 : 1.pp 支点 2. r1 r2 r3 , s1 s2 s3 交易实用必备工具指标 波浪自动计算指标,通道趋势交易 完美的趋势-波浪自动计算通道计算 , MT4版本 完美的趋势-波浪自动计算通道计算 , MT5版本 本地跟单复制交易 Easy And Fast Copy , MT4版本 Easy And Fast Copy , MT5版本 本地跟单复制交易 模拟试用 Easy And Fast Copy , MT4 模拟账号运行 Easy And Fast Copy , MT5 模拟账号运行
支点( pivot points) 作为一种交易策略已经很长时间了,最初是场内交易员使用这种方法。使用这种方法通过几个简单的计算就可以了解市场在一天中的去向。 支点法中的支点是一天中市场方向的转向点,通过简单地计算前日的高点、低点和收盘价,可以得到一系列点位。这些点位可能形成关键的支撑和阻力线。支点位,支撑和阻力位被统称为支点水位。 你所看到的市场每天都有开盘价、高价、低价及收盘价(有一些市场是 24 小时开盘,比如外汇市场,通常用 5pm EST 作为开盘和收盘时间)。这些信息
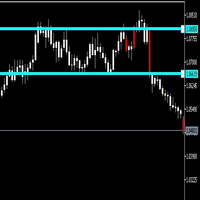
CandleVolume is an indicator that colors bars according to increasing or decreasing volume. You can use it to identify strategic regions of the chart and complete an analysis. White means low volume, yellow means medium volume and red means climax volume. It is a recommended indicator if you like to interpret market contexts and understand how market cycles work.

Все паттерны из книги Томас Н. Булковский "Полная энциклопедия графических ценовых моделей" в одном индикаторе со сканером. Cканер включается параметром ScannerMode. При ScannerMode=false индикатор ищет один паттерн (выбирается переменной Pattern). При выявлении паттерна индикатор рисует стрелку, открывает окно сообщений, выполняет push-уведомление. У индикатора много параметров, некоторые их них задействованы всегда, некоторые выборочно. Включите переменную ShowHelp - на графике отобразится по

Save Profit MT5 was created after several years of effort and programming by a strong program team. This expert is a fully automated, multi-currency trading system that doesn't require any special skills from you. Just fire up this EA and rest. You don't need to set up anything, EA will do everything for you. But if there is a problem or you do not know what to do, be sure to let me know. I will help you in the shortest possible time. The expected estimated profitability according to the backte

セミオートマーティンシステム
導入
このツールは半自動マーティン取引に使用され、パネルをクリックして注文すると、EAがポジションを管理します トランザクションの方向を決定し、残りはEA管理に任せてください 自動マーティン、設定されたグリッドに従って倉庫を追加し、この機能を無効にすることもできます ワンクリック清算 1つのキーロック機能 時間制御 警告音プロンプト
特性
トレーディングチャート:任意 取引可能な通貨:任意 自動テイクプロフィットクロージング バックテストに使用できます クリアパネルディスプレイ
パラメータ
主な設定パラメータ
LogLevel = LOG_LEVEL_INFO; //ログの書き込みレベル UseAutoMagic = true; //マジックナンバーを使用するかどうか MagicNumber = 6; //マジックナンバー0-2000を設定します ロット= 0.01; //初期取引量 UseMartin = true; // Martin関数を使用するかどうか ブースター= 1.7; //増加の倍数 NetGap = 10; //グリッドの
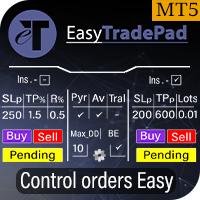
EasyTradePad – MetaTrader 5用取引パネル EasyTradePadは 、手動および半自動取引のためのツールです。パネルでは、注文とポジションを迅速に管理できるほか、リスク管理の計算もワンクリックで行えます。 パネルの機能: 事前に定義されたリスク(%または預金通貨)で取引を開始および終了します SLとTPをポイント、パーセンテージ、または金額で設定します リスクと報酬の比率を自動計算 損切りを損益分岐点に移動する 部分的なポジションのクローズ トレーリングストップ(ポイントまたはローソク足の影による) ポジションの平均化とピラミッディング アクティブな取引のパラメータを変更する [ デモ ] [ 説明 ]
追加機能: ピラミッド化
価格がテイクプロフィットに近づくにつれて、段階的に取引を追加します。新規取引ごとのリスクを軽減できます。追加する取引数は簡単に設定できます。 平均化
チャート上のカスタムレベルで追加注文を出すことができます。ポジションは平均エントリー価格で決済されます。 損益分岐点移転
価格が指定された利益幅に達した後、ストップロ
MetaTraderマーケットは、他に類のない自動売買ロボットやテクニカル指標の販売場所です。
MQL5.community ユーザーメモを読んで、取引シグナルのコピー、フリーランサーによるカスタムアプリの開発、支払いシステムを経由した自動支払い、MQL5Cloud Networkなど、当社がトレーダーに対して提供するユニークなサービスについて詳しくご覧ください。

取引の機会を逃しています。
- 無料取引アプリ
- 8千を超えるシグナルをコピー
- 金融ニュースで金融マーケットを探索