 MetaTrader 5
 专家
专家 指标
指标 程序库
程序库 实用工具
实用工具 窗口小部件
窗口小部件 规则
规则适用于MetaTrader 5的新EA交易和指标 - 508
 使用EA交易和指标,使外汇交易获得更多盈利。EA交易可使您自动开启和关闭交易,而指标将帮助您更准确地预测市场行为。
该页面提供MetaTrader 5应用程序的目录。
使用EA交易和指标,使外汇交易获得更多盈利。EA交易可使您自动开启和关闭交易,而指标将帮助您更准确地预测市场行为。
该页面提供MetaTrader 5应用程序的目录。 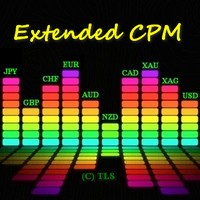
该算法基于货币功率计指标的思想。在此版本中,显示值的数量不受限制,其代码更加紧凑和快速,可以通过指标缓冲区获取当前柱的值。 指标显示的内容 :货币前的细条带和上方数字显示最近 N 小时的相对强弱指数(N 在变量“小时”的参数中设置),较宽的条带显示每日指数。您在输入参数中指定的使用该货币的货币对越多(假设您的经纪商为这些货币对提供报价),该指数的权重就越大(但要小心“非主要”或外来货币对,它们可以扭曲整体画面)。例如,如果您只指定了 EURUSD,则欧元的相对指数将仅基于此对计算,如果您添加 EURGBP,则欧元指数将基于两个对计算并获得更加权的值。 如何使用数据 :在没有重要新闻的情况下,指数值越低/越高,技术修正或趋势延续的可能性就越大。
FREE
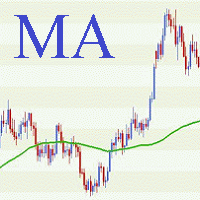
专业的机器人,实现贸易和过境价格滑动的经典策略。
当穿越移动和价格买入或卖出的信号之间形成的。该信号的方向被设置在该设置。
法官正确处理错误,工作可靠,在市场上。 100元的营运资金!选择工作的方向或双方,或只是购买或出售是很重要的。
专家使用的基本概念,盈亏平衡点,拖网,止损和止盈,以及关闭相反的信号。
参数概述:
魔术 - 魔术数字,任意整数。
工作周期 - 在其上专家的工作时间。
风险 - 即进入市场的风险,定义为存款项目的总损失的百分比是指相对于止损和允许亏损时止损。
LotRounding - 四舍五入很多(以小数)。
偏差 - 重新报价。
卧具 - 等待打开,关闭或修改的位置。
止损 - 止损。
止赢 - 平仓。
结尾句点 - 运行拖网的时间。
尾随盈亏平衡 - bezubytka0级 - 关闭。
尾部开始 - 级开始拖网0 - 关闭。
追踪止损 - 0级拖网 - 拖网下车点,较积极的拖网时期
TrailingStep时期 - 二尖瓣时期
禁止新系列 - 如果你想完成的当前位置,并且不再开放新的,那么你必须启用该选项。
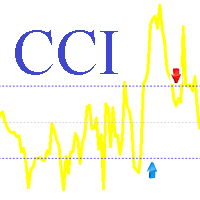
This is a professional trading robot, which implements the classical CCI based trading strategy. The signal is produced upon exiting of CCI from the overbought/oversold areas; the levels of those areas will be levels with the values of LevelMax and LevelMin . We buy, as CCI falls lower then level LevelMin and then rises above it. We sell, as CCI rises above level LevelMax and then falls below it. Also, the signal can be inverted. The EA correctly processes errors, and works reliably in the marke
The indicator determines and marks the short-term lows and highs of the market on the chart according to Larry Williams` book "Long-term secrets to short-term trading". "Any time there is a daily low with higher lows on both sides of it, that low will be a short-term low. We know this because a study of market action will show that prices descended in the low day, then failed to make a new low, and thus turned up, marking that ultimate low as a short-term point. A short-term market high is just
FREE

This is a professional trading robot, which implements the classical Envelopes based trading strategy. A signal is generated when prices rolls back from the boundaries of the Envelopes. If the price pierces or touches the upper border of the Envelopes channel and then returns back, it's the signal to sell. If the price pierces or touches the lower border of the Envelopes channel, it's the signal to buy. The EA correctly processes errors and works reliably in the market. It is important to choose
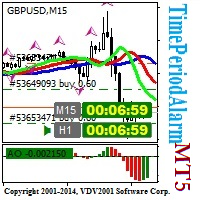
The TimePeriodAlarm indicator shows time till closure of a bar. If the 'Time period' is specified explicitly (i.e. not 'current'), the indicator displays the time till bar closure of the current period and the explicitly specified period. Ten seconds before the closure of the bar (at the period specified explicitly), a preliminary sound alert is played and a color alert is generated, then the main signal (can be set by the user) in the parameter 'Sound file(.wav)' is played. The sound file shoul

热图指示器 此热图指标允许您显示在市场报价中选择的所有代码的“热图”。在此版本中,它显示了 相对于上次每日收盘价的价格变化百分比 ,可以快速了解市场概况。 这是一种工具,可帮助交易者确定一种货币相对于所有其他货币对的强度。这是一个可视化工具,不能在“EA 交易”中使用。从这个意义上说,它更像是一种自由交易者的工具,而不是自动交易者。因此,对于那些有兴趣使用此工具进行自动交易的人来说,很遗憾这是不可能的。 它对股票或期货市场特别有用,例如巴西交易所 Bovespa。
设置 热图指示器中有几个设置需要自定义: <头> 设置 可能的值
描述
隐藏图表? 真 /假
您可以完全隐藏图表或保持原样。当指标从图表中移除时,图表将恢复。
在前景中绘制的图表? 真/ 假
如果之前的设置为 True,您可以选择在前景 (true) 或背景 (false) 中显示图表。
自动排列热图? 真 /假
如果为 true,所有尺寸和排列都会自动完成。否则必须选择进一步的设置。
刷新时间(毫秒) >=1000
数据默认每 5 秒刷新一次。最小值为 1,000(1 秒)。
上色 任何颜色
默认为蓝色。此颜色用于指示具

This is a multiple timeframe version of the classic Parabolic SAR indicator (stands for "stop and reverse"). PSAR follows price being a trend following indicator. Once a downtrend reverses and starts up, PSAR follows prices like a trailing stop. You can choose the timeframes for displaying PSAR on the chart. Of course, you can see PSAR only from the current and higher timeframes. Input parameters: bM15 - PSAR from M15 bM30 - PSAR from M30 bH1 - PSAR from H1 bH4 - PSAR from H4 bD1 - PSAR from D1

This is a utility for storing the data on open interest (OI), ratio of buyer/seller orders' number and the ratio of buyer/seller orders' volumes on the Russian FORTS futures market. This is the first product of the series. Now, you can trace history of the specified data in real time in МТ5 terminal. This allows you to develop brand new trading strategies or considerably improve the existing ones. The data received from FORTS market is stored as a database (text CSV or binary one at user's discr
FREE

This is an open interest indicator for the Russian FORTS futures market. Now, you can receive data on the open interest in real time in МТ5 terminal. This allows you to develop brand new trading strategies or considerably improve the existing ones. The data on the open interest is received from the database (text CSV or binary one at user's discretion). Thus, upon completion of a trading session and disabling the terminal (or PC), the data is saved and uploaded to the chart when the terminal is

Trade Copier Pro MT5 is a tool to copy trade remotely to multiple MT4, MT5 and cTradfer accounts at different computers/locations over internet. This is an ideal solution for you if you are a signal provider and want to copy your trades to other receivers globally on your own rules. One provider can copy trades to multiple receivers and one receiver can get trade from multiple providers as well. The provider can even set the subscription expiry for each receiver, so that receiver will not be abl

Attention: Demo version for review and testing can be downloaded here . It does not allow trading and can only be run on one chart. Active Lines - a powerful professional tool for operations with lines on charts. Active Lines provides a wide range of actions for events when the price crosses lines. For example: notify, open/modify/close a position, place/remove pending orders. With Active Lines you can assign several tasks to one line, for each of which you can set individual trigger conditions

Trade in the opposite directions with HedgeTerminal HedgeTerminal is a full-featured trading terminal inside MetaTrader 5. This is a graphic panel resembling MetaTrader 4 terminal. It allows you to track oppositely directed positions in the manner it is possible in MetaTrader 4. In other words, we can open unlimited number of positions on a single symbol even if positions are in complete or partial hedge (lock). Thus, you can maintain long and short positions simultaneously, which is impossible
FREE
Introduction to Sideways Market Analyzer Notable period of Low volatility and non-trending movements in the financial market is considered as Sideways Market. Sooner or later, the low volatility will increase and the price will pick up a trend after Sideways Market. In terms of trading point of view, Sideways Market can serve as the very good entry timing for traders. Sideways Market is also quite often the representation of accumulation of large orders from big investors. Therefore, knowing the

Trade Controller provides multiple methods to protect and maximize your profits. This powerful weapon helps you to set the protect and trailing-stop rules on your trade automatically in many effective methods. Once it is set and turned on, you don't need to monitor your orders anymore, the software will keep watching and control your orders with your predefined rules. It's designed to support multi-protection and trailing strategy: Protect by break-even, protect by percentage, protect by pip, pr

Vates is a Latin word meaning a prophet. Vates is a multicurrency trend Expert Advisor that can run on any type real accounts, on any timeframe, with any initial deposit, with a fixed or varying lot size, with four and five-digit quotes, with brokers offering different order filling types. A distinctive feature of the EA is its stability and reliability. The results of Expert Advisor testing in the Strategy Tester in four modes (two main modes – normal and with a delay, and two additional modes

My Money Manager like a risk controller, which places your trades with the exact volume that meets your desired stop loss risk percentage. It can also help you to preview your EP/SL/TP levels before placing an order by dragging these levels directly on a chart, and keep reporting about them during the position opening. With this tool, you will feel more comfortable when deciding to open orders, as well as forecasting your profit/loss with your orders. Placing orders is a very precise and profess

This tool is designed to measure the distance between two points on a chart and much more.
List of measured values:
Distance in points Profit (with and without spread) Time difference Percentage price change Slope angle Number of bars (various variations) Ratio of distance in points to the reference value Features:
Snap to OHLC prices Automatic color profile setting based on chart background color Various types of pointers to choose from Display of values of selected points on th
FREE

这是基于即时报价的剥头皮系统。它的基础是分析即时报价,而非柱线。本产品可在 4 和 5 位报价的平台上工作。重新报价是至关重要的。最小延迟执行的平台是必需的。 本 EA 不使用保存在数据库中的历史数据。它在线下载历史数据并创建它自己的数据库,保存在内部的内存里。重启之后, 数据库被删除并将会再次下载。通过 CountTick 参数管理内部内存的大小,并再开始工作时指定将有多少即时报价会写入数据库。所提到的数据库被用于长线分析。从长线数据库提取的信息设计为堆栈,用于短线分析和入场。换句话说, 本 EA 使用的来自堆栈的许多当前选择的即时报价,均接收自长线数据库的信息。 在下载了指定数据之后, 本 EA 开始由两个阶段构成的操作。在第一阶段期间, 下载的即时报价数据按照指定数量 (CountTick) 进行分析, 周期性则通过 ReOptimization 参数设置。本 EA 在工作时将会选择最佳的参数。换言之,最好的结果是通过穷举法搜索并选择的。由于没有太多的参数以供选择,这种方法是合理的。为进行搜索,三个内部参数被选择: 调整堆栈大小,从 1 至 CountSteck。 检查入场 (

Currency Power Meter 显示了主要货币对彼此的力量。该指标显示货币/对当前时刻在一段时间内的相对强度(每天,每周,每月)。它是日间交易,波段交易和适期期权头寸交易者有用。
货币的权力是市场走势的真正原因:对最弱货币最强的货币将结合成一个最趋势对。我们知道,趋势使得货币和所有的交易者喜欢趋势。 你 有没有问过自己,为什么有些行业似乎有一个良好的信号,但仍然会失败?原因是你只看到个别的信号在您喜欢的一双,但没有对所有的人,这是更好地做出决定货 币权力的忽视。因此,这一指标显示哪些货币是最强的,哪些是最薄弱的,因此最趋势对。它也让你知道哪些货币(因而对)是中性的,你应该避免进行交易了。 突出特点:
实时和主要货币的视觉存在对他人的权力。 每日,每周,每月:分析周期之间切换。 提示信息时,货币或对改变它的电源。 通知发送到移动和电子邮件时货币或对改变它的电源。 选择字号以适应你的屏幕分辨率。 注: 指标可能需要一段时间来分析和安排货币细胞在第一次加载新的时间表,所以请等待,直到它完成。
用户指南:
指标得出的主要货币表中
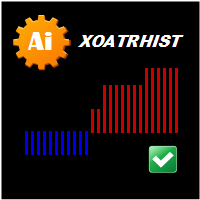
Version for MetaTrader 5. The indicator is based on point and figure chart, but their period is equal to ATR indicator values. Displays in the form of steps. Steps above zero indicate an uptrend. Below zero on a downtrend. Parameters: ATRPeriod - ATR period for calculation of steps. Note: The indicator uses closes price, thus it is recommended to consider completed bars.

Trend indicators tell you which direction the market is moving in , if there is a trend at all because they tend to move between high and low values like a wave
This indicator shows Up Trend (Green Histogram), Down Trend (Red Histogram) and Sideways Trend (Yellow Histogram). Only one input parameter: ActionLevel. This parameter depends of the length of the shown sideways trend.

MAPC (Moving Average Percent's Change) shows the Moving Average's percent change from one period to another selected period allowing you to track the smoothed price change rate. MAPC is calculated according to the following equation: MAPC[i] = 100 * (MA[i] - MA[i - n]) / MA[i], where: MA[i] - current Moving Average value; MA[i - n] - value of the Moving Average that is n periods away from the current Moving Average value.
Input Parameters Period - Moving Average period; Method - smoothing me
FREE

MA Crossing displays two moving averages on the chart painting their crossing points in different colors - blue (buy) and red (sell). The indicator clearly defines the trend direction and power and simplifies the perception of market signals. The indicator may be useful in the strategies involving two moving averages' crossing method. The indicator's input parameters allow you to select the following settings for each moving average: period (Fast Period, Slow Period); smoothing period (Simple, E
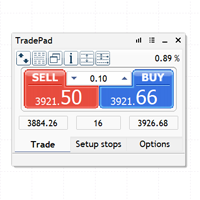
TradePad 是一種既可用於手動交易又可用於演算法交易的工具。我們為您提供一個簡單的解決方案,用於快速交易操作和控制多種交易工具的持股。 注意,該應用程式不適用於策略測試器! 模擬帳戶應用程式的試用版和所有工具的描述
應用程式介面適應高解析度顯示器,簡單直覺。為了方便工作,我們為交易者提供了以下工具:
熱鍵管理器,用於管理交易操作、在主圖表的週期之間切換、在 TradePad 工具之間切換; 標記交易等級的工具,用於在開倉或設定掛單時評估虧損風險並計算潛在利潤; MultiCharts 工具用於直觀地監控多個交易符號,以及接收演算法交易的交易訊號。為了方便起見,您可以組織交易對的集合,這將使您有機會在多個時間範圍內監控價格並進行多幣種交易; 用於查看任何歷史時期的交易統計資料的資訊模組,能夠產生擴展的 HTML 報告、查看交易符號的特徵和有關交易帳戶的資訊; 掛單管理器用於管理掛單 - 設定單一或一組(網路)掛單,可按訂單類型和單一符號或交易帳戶上的所有類型進行分組刪除; 設定賣出停損限價和買入停損限價掛單的工具; 頭寸管理器用於管理一個或多個頭寸(取決於帳戶類型) - 全部

This indicator is a visual combination of 2 classical indicators: Bulls and MACD. Usage of this indicator could be the same as both classical indicators separately or combined. Input parameters: BearsPeriod = 9; ENUM_MA_METHOD maMethod = MODE_SMA; ENUM_APPLIED_PRICE maPrice = PRICE_CLOSE; SignalPeriod = 5.

Only Exponential Moving Average at Close Price is used in standard Bulls Power limiting the possibilities of that indicator to some extent. Bulls Power Mod enables you to select from four Moving Averages and seven applied prices, thus greatly expanding the indicator's functionality.
FREE

Only Exponential Moving Average at Close Price is used in standard Bears Power limiting the possibilities of that indicator to some extent. Bears Power Mod enables you to select from four Moving Averages and seven applied prices, thus greatly expanding the indicator's functionality.
FREE

В стандартном индикаторе DeMarker используется простая скользящая средняя - Simple Moving Average, что несколько ограничивает возможности этого индикатора. В представленном индикаторе DeMarker Mod добавлен выбор из четырех скользящих средних - Simple, Exponential, Smoothed, Linear weighted, что позволяет существенно расширить возможности данного индикатора. Параметры стандартного индикатора DeMarker: · period - количество баров, используемых для расчета индикатора; Параметры индикат
FREE

This indicator is a visual combination of 2 classical indicators: Bears and MACD. Usage of this indicator could be the same as both classical indicators separately or combine. Input parameters: input int BearsPeriod = 9; input ENUM_MA_METHOD maMethod = MODE_SMA; input ENUM_APPLIED_PRICE maPrice = PRICE_CLOSE; input int SignalPeriod = 5.

This indicator gives full information about the market state: strength and direction of a trend, volatility and price movement channel. It has two graphical components: Histogram: the size and the color of a bar show the strength and direction of a trend. Positive values show an ascending trend and negative values - a descending trend. Green bar is for up motion, red one - for down motion, and the yellow one means no trend. Signal line is the value of the histogram (you can enable divergence sea
FREE
该指标分析过去的价格走势以预测市场的买入和卖出压力:它可以通过回顾过去并分析当前价格附近的价格高峰和低谷来做到这一点。这是最先进的确认指示器。 [ 安装指南 | 更新指南 | 故障排除 | 常见问题 | 所有产品 ] 预测市场的买卖压力 避免陷入购买狂潮的陷阱 无需设置也无需优化 该指标在所有时间范围内均有效 极易使用 潜在的供求价格是指许多市场参与者可能持有其亏损头寸,希望在收支平衡时清算的价格。因此,在这些价格水平上有大量活动。 供需双方都量化为数字 如果供应高于需求,则可以预期卖压 如果供应低于需求,则可以预期购买压力 当供应高于需求时寻找空头 当供应低于需求时寻找多头
输入参数 范围:当前价格附近的波动率乘数,用于搜索过去的高峰和低谷。
作者 ArturoLópezPérez,私人投资者和投机者,软件工程师,零零点交易解决方案的创始人。

Auto Trade Copier 被设计成多的MT5账户/端子,绝对精度之间复制交易。
有了这个工具,你可以充当要么提供商(源)或接收(目的地) 。每一个交易行为将由提供商克隆到接收器,没有延迟。
以下是亮点功能:
在一个工具提供商或接收器之间转换角色。 一个供应商可以交易复制到多个接收者的账户。 绝对兼容MT5的顺序/位置管理规则,该规则允许与调整容积为每个符号只有一个位置。
自动识别和同步代理之间的符号后缀。 允许高达5特殊符号的设置(即: GOLD - > XAUUSD ,等等) 。 多lotsize设置选项。 允许过滤的订单类型将被复制。 关断端子或电源关闭后恢复以前的设置和状态。 实时控制面板。 使用方便,界面友好。
用法:
- 安装工具提供的MT5终端,并选择角色“提供者” ,然后启用它。
- 安装工具接收的MT5终端,并选择角色的“接收器” ,输入提供商的帐号,然后启用它(你可以有很多接收者的帐户,只要你想) 。
设置和参数:
特殊符号设置(菜单) : 配置高达5对特殊
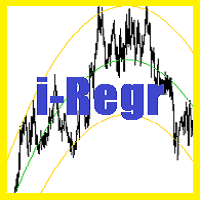
回归通道是一种技术指标,由两条与回归趋势线等距的平行线组成。这些线形成一个通道,资产价格倾向于在该通道内波动。通道边界与中心回归线之间的距离由收盘价与回归线的最大偏差决定。这种方法使交易者能够更好地了解当前的市场动态并做出明智的决策。
回归通道的主要特征: 对称性和精确性:两条通道线相对于中心回归线对称放置,确保准确反映价格波动。 动态适应:通道参数自动适应市场变化,因为计算基于最新数据。 趋势指标:回归线显示总体趋势,而通道边界有助于识别超买和超卖情况。 易于解释:一种易于解释的指标,适合新手和有经验的交易者。 使用回归通道的优势: 趋势识别:使交易者能够快速确定当前趋势的方向和强度。 市场偏差评估:通道边界有助于识别极端价格值,表明潜在的逆转。 支撑和阻力:通道线可以作为支撑和阻力水平,帮助交易者找到最佳的进入和退出点。 应用灵活性:可用于任何时间范围和任何金融工具,包括股票、货币和商品。 如何在交易中使用回归通道: 趋势确定:回归线的斜率表示当前趋势是向上、向下还是横向。 进入和退出点:当价格触及通道边界时进入交易,当触及相反边界时退出。 偏差分析:使用回归线的最大价格偏差来评
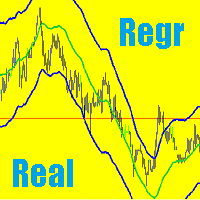
在 MetaTrader 5 中实现具有实时残差显示的回归通道 MetaTrader 5 中的回归通道由两条线组成,它们在回归趋势线的上方和下方等距。通道边界和回归线之间的距离由最高收盘价与回归线的偏差决定,这与最近的回归点相关。
问题和解决方案 通常,回归通道线会随着每个新条形图重新绘制,因此只有最新的点才相关。这会导致通道的历史准确性出现差异。为了解决这个问题并获得回归状态随时间变化的实时表示,有必要在每个时间点显示回归线而不重新绘制它们。这是该指标与常规回归通道之间的主要区别。
实施的主要好处 历史数据准确性:显示每个时间间隔的回归通道的实际状态使交易者能够看到通道随时间的变化,从而提高历史数据分析的准确性。
不重绘线:将回归线固定在每根柱线上,消除了不断重绘的问题,确保了分析的准确性和可靠性。
全面的趋势表示:保留通道的历史状态有助于更好地跟踪和了解长期趋势及其变化。
如何在 MetaTrader 5 中使用真实回归通道 指标安装:将真实回归通道指标添加到 MetaTrader 5 并根据您的需要配置其参数。
历史数据分析:使用真实回归线的显示来分析历史数据并识别一
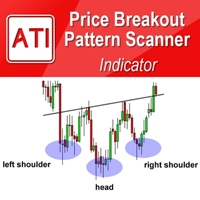
Price Breakout pattern Scanner is the automatic scanner for traders and investors. It can detect following patterns automatically from your chart. Head and Shoulder - Common tradable pattern. Reverse Head and Shoulder - This pattern is the reverse formation of the Head and Shoulder. Double Top - When the price hits resistance level twice and decline toward the support level, the trader can anticipate sudden bearish breakout through the support level. Double Bottom - The double bottom pattern is


本指标是一款众所周知的 MetaTrader 4 指标,现直接免费在互联网上提供。它完全不会重绘。 它实现了一类突破策略。箭头指示行情的方向。在 M15 或更高时间帧里使用此指标。
FREE

Trend is the direction that prices are moving in, based on where they have been in the past . Trends are made up of peaks and troughs. It is the direction of those peaks and troughs that constitute a market's trend. Whether those peaks and troughs are moving up, down, or sideways indicates the direction of the trend. The indicator PineTrees is sensitive enough (one has to use input parameter nPeriod) to show UP (green line) and DOWN (red line) trend.
The Commitments of Traders Ratio Indicator is one of these things you never thought about it before you really see the magic behind it. The indicator shows the Ratio of long/short positions released by the CFTC once a week.
If you have a look on the Sreenshot you can see two (three) zones of interest. Important note: MAs are not available in version 1.0. Zone 1: The Switches (Red -> Green, Green -> Red) Zone 2: MA cross Zone 3: If you combine this with the COX indicator an additional zone will
FREE

Optimistic trader may enter the market when the price crosses the blue line. More reliable entry will be when the price crosses the yellow line. When the price comes back and crosses the red line you can open a position in the course of price movements. If the price is moving between aqua lines - stay out of the market.

The Bull and Bear Power indicators identify whether the buyers or sellers in the market have the power, and as such lead to price breakout in the respective directions. Bulls Power vs. Bears Power is a unique tool that displays on each candle the balance between the bears (sellers) and the bulls (buyers). This particular indicator will be especially very effective when the narrow histogram and the wide histogram reside on the same side (above or under the Zero line)

The MWC COX indicator shows the extreme zones of net short/long positions of the Commitments of Traders Report released by the CFTC once a week for four periods of time. Default settings are periods of 12, 26, 52 and 156 weeks.
Additional Features Displays the sum of all 4 periods in one line MA, MOM and RSI indicators are integrated ( not in the MQL5 Version 1.0 ) Please make sure that you download the MWC_Demo.zip file and unpack it into [...]/MQL5/Files folder. -> www.myweeklycot.com/t
FREE
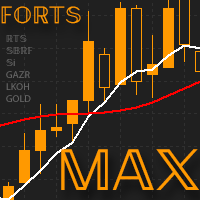
The reversing Expert Advisor FORTS MAX is designed specially for trading futures contracts on FORTS . Its trading algorithms are based on the original methods of price dynamics analysis and the specifics of the Russian market. The main feature of this EA is the use of reverse trading technique, reverting a position and taking into account the free margin. Before reverting a deal, it closes the current position, and opens a new one only after margin is released. The FORTS MAX Expert Advisor uses

Auto Trade Driver is an automatic powerful tool (run as Expert Advisor) that helps you to manage risk and control orders and maximize your profit in multi-protect/trailing-stop rules. This tool is very useful for both scalpers and trend followers. It not only calculates the trade risk exactly, but also protects and maximizes your profits in real-time. With this tool, the only thing you have to do is to enter trade by your own strategy, then it will auto-drive your position with exit strategy you
"Support" and "Resistance" levels - points at which an exchange rate trend may be interrupted and reversed - are widely used for short-term exchange rate forecasting. One can use this indicator as Buy/Sell signals when the current price goes above or beyond Resistance/ Support levels respectively and as a StopLoss value for the opened position.

AutoCloseTimer allows you to close positions and delete pending orders at a specified time.
Usage Download and drag and drop AutoCloseTimer onto the chart. Check Allow AutoTrading in Common tab. Set parameters in Inputs tab. Notice: The close time must be later than the current market time.
Input Parameters CloseSymbol - there are 2 options SymBol Of Chart - just close the symbol of the current chart
All Symbols - close all symbols CloseTimerDay - specify a day for AutoCloseTimer. The default

自动设置、止损、止盈、追踪止损、盈亏平衡水平,实现 虚拟 止损和止盈。
经验助理 将帮助您组织职位维护。 该程序(EA 交易)旨在自动设置 真实或虚拟 交易时您的仓位的 止损和止盈 水平。 您可以从图表上的控制面板轻松管理 EA 交易的所有操作。 如果您在为未平仓头寸设置止损、止盈、 追踪止损 或 盈亏平衡 时遇到任何困难 ,或者如果您更喜欢手动交易,您可以使用助手。 它将自动执行必要的操作,例如为您的交易设置止损和获利、打开追踪止损以及在需要时将止损移至盈亏平衡。 该助手还具有基于 抛物线 Sar 指标的追踪止损功能。 MT4 版本
详细描述 +DEMO +PDF 如何购买
如何安装
如何获取日志文件 如何测试和优化 Expforex 的所有产品 我们的助手的9个主要功能:
打开买入卖出; 止损/止盈集; 设置追踪止损; 一套收支平衡; 抛物线追踪止损; 虚拟止损和止盈; 虚拟栏杆止损和盈亏平衡; 显示当前柱的结束时间; 显示有关帐户的有用信息; 对于实时图表上的一键交易,您可以下载实用程序 VirtualTradePad for MetaTrade
FREE

Fibonacci Arcs in the full circles are based on the previous day's candle (High - Low). These arcs intersect the base line at the 23.6%, 38.2%, 50%, 61.8%, and 78.6%. Fibonacci arcs represent areas of potential support and resistance. Reference point - the closing price of the previous day. These circles will stay still all day long until the beginning of the new trading day when the indicator will automatically build a new set of the Fibonacci Arcs.

Support and resistance represent key junctures where the forces of supply and demand meet. On an interesting note, resistance levels can often turn into support areas once they have been breached. This indicator is calculating and drawing 5 pairs of "Support and Resistance" lines as "High and Low" from the current and 4 previous days.

The three basic types of trends are up, down, and sideways. An uptrend is marked by an overall increase in price. Nothing moves straight up for long, so there will always be oscillations, but the overall direction needs to be higher. A downtrend occurs when the price of an asset moves lower over a period of time. This is a separate window indicator without any input parameters. Green Histogram is representing an Up-Trend and Red Histogram is representing a Down-Trend.
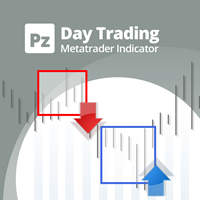
该指标仅使用价格行为分析和donchian渠道以锯齿形检测价格反转。它是专门为短期交易而设计的,根本不需要重新粉刷或补漆。对于精明的交易者来说,这是一个绝佳的工具,旨在增加他们的运作时间。 [ 安装指南 | 更新指南 | 故障排除 | 常见问题 | 所有产品 ]
极易交易 它在每个时间段都提供价值 实施自我分析统计
它实现了电子邮件/声音/视觉警报 基于可变长度的突破和拥挤区域,该指标仅使用价格行为来选择交易并对市场快速做出反应。 显示过去信号的潜在利润 该指标分析其自身的质量和性能 突围的损失突出显示并解决 该指标是不可重涂和不可重涂的 该指标将帮助盘中交易者不要错过单个价格反转。但是,并非所有价格反转都是一样的,也不是具有相同的可行质量。决定要突破哪些突破而忽略哪些取决于交易者的良好判断。
如何解释统计数据 该指标研究其自身信号的质量,并在图表上绘制相关信息。将分析每笔交易,并在图表的左上角显示总体历史结果,这使您可以针对任何给定的工具和时间范围自行优化指标参数。每个乐器和时间表都有其自己的最佳设置,您可以自己找到它们。 最大优惠交易:对于任何给定的交易,MFE都是最好的结

Introduction Harmonic Patterns are best used to predict potential turning point. Traditionally, Harmonic Pattern was identified manually connecting peaks and troughs points in the chart. Manual harmonic pattern detection is painfully tedious and not suitable for everyone. You are often exposed under subjective pattern identification with manual pattern detection. To avoid these limitations, Harmonic Pattern Plus was designed to automate your harmonic pattern detection process. The functionality

When the bands come close together, constricting the moving average, it is called a squeeze. A squeeze signals a period of low volatility and is considered by traders to be a potential sign of future increased volatility and possible trading opportunities. Conversely, the wider apart the bands move, the more likely the chance of a decrease in volatility and the greater the possibility of exiting a trade. This indicator can be used at any time frames and currency pairs. The following input parame

这个脚本允许比较来自不同交易服务器或者不同经纪商的报价和价差,以识别出一个提供最好的买价/卖价和最小价差的服务器/经纪商。
一次可与最多6个不同的服务器或经纪商进行比较,通过分数很容易就能找到最好的报价提供商。
用法:打开最多6个MetaTrader 客户端终端,分别登入不同的服务器/经纪商,然后在每个终端的图表上启动脚本。
。。。。。。。。。。。。。。。。。。。。。。。。。。。。。。。。。。。。。。。。。。。。。。。。。。。。。。。。。
。。。。。。。。。。。。。。。。。。。。。。。。。。。。。。。。。。。。。。。。。。。。。。。。。。。。。。。
。。。。。。。。。。。。。。。。。。。。。。。。。。。。。。。。。。。。。。。。。。。。。。。。。。。

Indicator Cloud is drawing "clouds" on the chart. If the current price is behind the cloud then no actions should be done. If the current price departs from the cloud then one should consider to go Long or Short according to the price movement. Input parameters: Period1 and Method1 could be used as indicator settings for each TimeFrame and Currency pairs.

Self Explanatory Indicator: buy when the Aqua line crossing the Yellow line upward and Sell when the Aqua line crossing the Yellow line downwards. Input parameters: Period1 = 13. Method1 = 2. MODE_SMA=0, MODE_EMA=1, MODE_SMMA=2, MODE_LWMA=3. Period2 = 5. Method2 = 0. MODE_SMA=0, MODE_EMA=1, MODE_SMMA=2, MODE_LWMA=3.

This indicator is intended to guard your open position at any time frame and currency pair.
Long position In case the current price goes above the Take Profit price or below the Stop Loss price of the opened position and the Dealing Desk does not close this position, the indicator creates an Excel file with the name: Buy-TP_Symbol_Date_PositionID.csv or Buy-SL_Symbol_Date_PositionID.csv which will be placed in the folder: C:\Program Files\ ........\MQL5\Files Excel file for Buy-TP: You will h

This indicator is designed for H1 timeframe and shows: Sum of points when the price goes up (Green Histogram). Sum of points when the price goes down (Red Histogram). In other words, by the number and ratio of bullish points to bearish ones, you can do a technical analysis of the state of the market.
If the green histogram prevails over the red one, you can conclude that at the moment the buyers are stronger than the sellers, and vice versa, if the red histogram prevails over the green, the se

交易水平支撐和阻力的概念是技術分析中討論最多的屬性之一。 作為分析圖表模式的一部分,交易者使用這些術語來指代圖表上的價格水平,這些水平往往充當障礙,防止資產價格被推向某個方向。 指标计算 nBars(n根柱线) 的距离,并绘制支撑和阻力线。 技術分析師使用支撐位和阻力位來確定圖表上的價格點,其中的概率有利於當前趨勢的暫停或逆轉。 支撐出現在由於需求集中而預期下降趨勢暫停的地方。 由於供應集中,在預計上漲趨勢將暫時暫停的地方會出現阻力。 市場心理起著重要作用,因為交易者和投資者記住過去並對不斷變化的情況做出反應以預測未來的市場走勢。 可以使用趨勢線和移動平均線在圖表上識別支撐和阻力區域。 如果输入参数 Fibo = true 则在线间出现菲波纳奇(黄金分割)线。

Divergence MACD indicator shows price and MACD indicator divergence. The indicator is not redrawn! The algorithm for detection of price and MACD extremums has been balanced for the earliest entry allowing you to use the smallest SL order possible. The indicator displays all types of divergences including the hidden one, while having the minimum number of settings. Find out more about the divergence types in Comments tab. Launch settings: Max Bars - number of bars calculated on the chart. Indent
FourAverage是趋势检测中的一个新词。 随着信息技术的发展和大量的参与者,金融市场越来越不适合用过时的指标进行分析。 传统的技术分析工具,如移动平均线或随机指标,其纯粹形式无法确定趋势的方向或其逆转。 一个指标可以根据14年的历史指示未来价格的正确方向,而不改变其参数吗? 与此同时,不要失去充足的横向市场走势? 答:可以。 我们的团队开发了一个指标,具有相当强大和有效的机制来适应不断变化的市场条件。 2025年,领先的趋势指标"FourAverage"正进入新的发展阶段。 现代加密货币和股票市场似乎是为此指标创建的。 独特的平滑公式允许您调整(识别模式)指标的任何特征的货币对或其他工具。 现在,为了盈利,一个指标就足够了,而这仅仅是个开始。 与其他工具结合使用或作为信号滤波器,FourAverage的好处是巨大的。 该指标有一个内置函数,绘制箭头并在指标上显示前一笔交易的结果。 这使得检查历史非常方便。 这是非常容易使用这个趋势指标。 1)确定具有良好增长潜力的资产。 2)使用一组内置指标设置或选择您自己的选项。 3)您正在等待指标的信号来开启交易。 4)打开一个位置,并获得利

The indicator displays divergence for any custom indicator. You only need to specify the indicator name; DeMarker is used by default. Additionally, you can opt for smoothing of values of the selected indicator and set levels whose crossing will trigger an alert. The custom indicator must be compiled (a file with ex5 extension) and located under MQL5/Indicators of the client terminal or in one of the subdirectories. It uses zero bar of the selected indicator with default parameters.
Input parame
FREE

The indicator draws lines that can serve as support/resistance levels. They work both on Forex and FORTS. The main and additional levels are displayed as lines, with the color and style defined by the user. Additional levels are only displayed for currency pairs without JPY. Please see the AUDUSD chart below. Yellow ovals indicate some characteristic points where price reaches one of the levels. The second screenshot shows a FORTS instrument chart with the characteristic points. Simply watch the

The indicator creates 2 dot lines representing an upper and lower bands and the main indicator aqua line as the price power. If the main line is swimming inside the bands, then you should wait and watch before entering the market. When the main line jumps out or in the bands, then you should make a long or a short position.
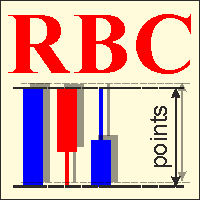
RBC 范围柱线图表 是一款经典范围柱线指标。本指标的功能是提供价格区间图表: 最高价/最低价区间是一个经典的用于分析的选项。它也有开盘价, 最高价, 最低价和收盘价。在第一个选项里, ;两个价格数值同时被分析, 而其它选项只使用一个。以往,范围柱线使用即时报价绘制,但由于即时报价数据未在服务器上提供,图表只可能基于标准时间帧的柱线数据。您应该记住,时间帧越大,图表越粗糙。本指标实现通过标准时间帧选择。 在首次运行时, 您应该按下 R 键 或等待在设置里指定的 'Update period chart'。这将初始化图表。如果指标给出拷贝错误,这意味着正在从服务器拷贝数据的过程中,这可能需要一些时间,您可稍后重试。 注: 如果您选择了一个十分大的时间段来进行分析 (早于开始日期), 则图表需要很长时间, 因为事实上指标在开始阶段要从服务器上拷贝大量数据; 当在策略测试员里进行测试时, 分析的开始数据应早于开始时间一周或一个月 (依赖指定的步长)。 指标设置 Magic number - 独有指标数字,如果同时运行多个指标此数字很有必要 (每个指标必须有自己的魔幻数字); Period o

The indicator shows the angle of the DeMarker indicator line, which allows you to identify possible price extrema more accurately. Histogram bar color and size indicate the direction and angle of the DeMarker line. When the trade volume control is enabled, a yellow bar is an indication of the volume being lower than average over the past 50 bars. The color of the main indicator line shows whether the price has reached an overbought/oversold level in accordance with DeMarker indicator values. The

Smart Trend Line Alert , available for MT5 is a unique professional Trend Line, Support Line and Resistance Line Touch and Break out Alert with awesome Alert History feature, designed to help traders easily manage many charts and symbols without staring at the monitor.
Features Candle Break Out Alert, Price Touch Alert and Time Line Alert; 1 click for converting any drawn line into an alert line (Trend line and Horizontal line or Trend Line By Angle); Alerts History able to re-open closed chart

The indicator is designed for visual multicurrency analysis. It allows synchronous scrolling and analysis of a few charts simultaneously. The product can also be used for pairs trading. The indicator works both on Forex and Russian FORTS market. The product has a very important property - if there are skipped bars at the symbols, the synchronism of charts on the time axis is fully preserved . Each chart point is strictly synchronous with the others on the time axis at any time frame. This is esp

On the current chart, this indicator displays candlestick highs and lows of another time frame. Input Parameters: TimeFrame - chart time frame whose data will be displayed on the current price chart (by default, H12). Time Zone - shift of the indicator by time zone relative to the broker's time (by default, Broker-1). If the broker's time zone is UTC+1 and the Time Zone parameter is set to Broker-1, the bends of the indicator will be plotted in multiples of Greenwich Time. Indicator buffer value
MetaTrader 市场 - 在您的交易程序端可以直接使用为交易者提供的自动交易和技术指标。
MQL5.community 支付系统 提供给MQL5.com 网站所有已注册用户用于MetaTrade服务方面的事务。您可以使用WebMoney,PayPal 或银行卡进行存取款。
